Landis, Vattikuti, Ottenberg, et. al.
Intersection Level of Service: The Bicycle Through Movement Submitted: July 31, 2002 (Resubmitted November 15, 2002) Word Count: 4,773 (3,773 + 2 tables + 3 figures) By Bruce W. Landis – Corresponding Author Venkat R. Vattikuti Russell M. Ottenberg Theodore A. Petritsch Sprinkle Consulting Inc. 18115 U.S. Highway 41 North, Suite 600 Lutz, FL 33549 Phone (813) 949-7449 Fax (813) 948-1712
[email protected] [email protected] [email protected] [email protected] Martin Guttenplan Florida Department of Transportation 605 Suwannee Street, MS 19 Tallahassee, Florida 32399-0450 Telephone: (850) 414-4900 Fax: (850) 921-6361
[email protected] Dr. Linda B. Crider University of Florida Department of Urban and Regional Planning PO Box 115706, Gainesville, FL 32611-5706 Phone (352) 392-8192 Fax (352) 846-0404
[email protected]
C:\Clyde_Documents\WorkFolder\LOS Folder\TM IntBLOS4.doc
1
Landis, Vattikuti, Ottenberg, et. al.
2
ABSTRACT The Florida Department of Transportation (FDOT) has initiated multi-modal level of service methodologies including that for the bicycle travel mode. They have already adopted a bicycle level of service methodology for the roadway segment portion of the transportation network, called the Bicycle Level of Service Model developed by Landis et. al., FDOT’s ultimate goal is to develop corridor and facilities level LOS methodologies. Towards that goal, FDOT sponsored this research study to develop the first part of an intersection bicycle level of service methodology; the Intersection LOS for the bicycle through movement. This Intersection LOS for the bicycle through movment would provide a measure of the level of safety / comfort experienced by bicyclists riding through an intersection. The Intersection LOS model for the bicycle through movement described here is based upon Pearson correlation analyses and stepwise regression modeling of approximately 1,000 combined real-time perceptions (observations) from bicyclists traveling a course through a typical U.S. metropolitan area’s signalized intersections. The study’s (human subject) participants represented a cross section of age, gender and geographic origin of the population of cyclists. Although further hypothesis testing is being conducted, the resulting general model for the Intersection LOS for the bicycle through movement is highly reliable, has a high correlation coefficient (R2=0.83) with the average observations, and is transferable to the vast majority of United States metropolitan areas. The study reveals that roadway traffic volume, total width of the outside through lane, and the intersection (cross street) crossing distance are primary factors in the Intersection LOS for bicycle through movements.
C:\Clyde_Documents\WorkFolder\LOS Folder\TM IntBLOS4.doc
Landis, Vattikuti, Ottenberg, et. al.
3
BACKGROUND There are numerous local governments, MPO’s, and state departments of transportation throughout the United States that are applying various methods to describe the quality of service provided to bicyclists by their collector and arterial systems. The majority base their methods on either the separate or combined works of Landis, Davis, Sorton, Epperson, and Harkey, et.al.(2-6 and 9). While two leading models, Bicycle LOS (9) and BCI (6), address the quality of service for bicycles along segments of the roadway, they do not address intersections. Intersections are among the most complex features of the transportation system; in some cases they represent the most formidable portion of the bicyclists’ routes. The accurate modeling of intersections will enhance the ability of transportation planners and engineers to assess travel conditions more thoroughly. Additionally, a model can provide insight to intersection designs that better and more safely accommodate bicyclists. The perception of hazard, or alternatively safety or user comfort, within a shared roadway environment is a performance measure according to the Highway Capacity Manual (7) (8). Although it has not yet been proven in the United States that the perceptions of safety by transportation system users correlate with actual safety, this perception is a reasonable measure of the quality of service for the bicycle mode of travel and is in keeping with the user based performance measures in the Highway Capacity Manual (HCM)(8). As with performance or quality measures for motor vehicle facilities, gradations in this quality of service are in levels of service. Thus defined, (the segment) bicycle level of service (Bicycle LOS) is not a measure of vehicular flow or capacity as is the convention for motor vehicle modes. Although methods do exist for quantifying bicycle flow and capacity, such performance measures are generally not relevant for mixed-mode collectors and arterials in the United States, at least for the foreseeable future due to low bicycle usage levels. The (segment) Bicycle LOS is based on human responses to measurable roadway traffic stimuli, similar to the comfort and convenience-type performance measures for other transportation modes. Although motor-vehicle system performance measures are usually based on single parameters such as time (average vehicle delay in seconds for intersections) or speed (average travel speed for road links), their gradations are solely based upon operators’ expectations of performance, that is, human perceptions. For example, the lowerbound level of service of signalized intersections is considered failure, F, at 80 seconds of delay based upon the assumption that that is the motorists’ tolerance threshold of control delay. Although the (segment) Bicycle LOS score is a mathematical function of human perceptions (a non-dimensional value) of stimuli, it can be described in a similar manner using measurable physical attributes of motor vehicle traffic and roadway conditions. As demonstrated in Landis (9), a mathematical model for (the segment) Bicycle LOS can be developed with a high degree of statistical reliability for roadway segments. Because of its reliability, state departments of transportation, and numerous government agencies and MPOs have adopted this Model. This research project by FDOT builds upon the (segment) Bicycle LOS methodology to address the level of service for bicycle through movements at signalized intersections. It is represents the next step in FDOT’s efforts to develop a comprehensive Bicycle LOS methodology based upon users perceptions. Future steps will likely include evaluations of other movements through intersections, shared use paths, and the impacts of delay and route convenience (how far one must travel out of one’s way to use a route).
C:\Clyde_Documents\WorkFolder\LOS Folder\TM IntBLOS4.doc
Landis, Vattikuti, Ottenberg, et. al.
4
DESIGN OF RESEARCH Bicyclists express their opinions of how well a particular intersection accommodates their travel by referring to the intersection’s perceived safety or comfort. Cyclists articulate their perceptions with such phrases as “it’s very dangerous” or “it’s pretty safe or comfortable”. Accordingly, this study placed its participants on actual metropolitan area roadways and through signalized intersections under typical traffic conditions. Although the FDOT briefly considered a virtual reality or simulation study, it was considered inappropriate as those types of studies are unable to fully capture all the response stimuli (i.e., operator and vehicle response factors) present in the on-road bicycling environment within intersections. A special event was created to place a significant number of bicyclists on a roadway course that would take them through various intersection configurations. The purpose was to obtain the cyclists’ real-time responses to the roadway environment stimuli and to create and test a mathematical relationship of measurable factors to reflect the study participants’ reactions. It should be noted that the research was designed to elicit responses from participants riding individually, not in pairs or groups. Participants The nearly sixty (60) bicyclists who completed the course represented a good cross section of age, gender and geographic origin. Participants ranged in age from 14 to 71. Because of the potential difficulty of riding in metropolitan area traffic, children under the age of 13 were not allowed to participate in the study. Figure 1 shows a histogram of the ages of the cyclists participating in the Study. The gender split of the study was 34 percent female and 66 percent male. The researchers and sponsor also sought participant diversity in both geographic origins and cycling experience, or skill level. Accordingly, the study test course was located in Orlando, Florida, a metropolitan area with significant in-migration. Sixty-six percent of the participants had lived in areas other than the Orlando region for the majority of their lives. Despite an extensive plan for outreach into the general population, the local sponsors of the event were not successful in soliciting participation from non-experienced Group B cyclists (10), who averaged less than 322 km (200 mi) of bicycling per year. The higher level of participation came from the segment of the population who bicycle the most often (most of whom averaged more than 1600 km (1000 mi) of bicycling per year). Metropolitan-area Course A roadway-course was developed to allow participants to experience a variety of intersection configurations and traffic conditions. Approximately 27 km (17 mi) in length, the course included 21 intersections, 19 of which were signalized. A STOP controlled intersection and a roundabout were included for comparison purposes. The roadways used for the course included two, four, and six lane roadways and ranged from local roadways to major arterials. An initially selected route was modified to include sections of roadway with higher traffic volumes; Course modification is customary during the “design phase” of course development. This ensures that a wide range in the potential variables can be tested. During the special event, the traffic volumes ranged from a low of 800 average daily traffic (ADT) to a high of 38,000 ADT, with a mean of 25,600 ADT. The percentage of trucks (as defined by the Highway Capacity Manual [8]) ranged from zero to 8.1 percent. Posted speeds ranged
C:\Clyde_Documents\WorkFolder\LOS Folder\TM IntBLOS4.doc
Landis, Vattikuti, Ottenberg, et. al.
5
from 40 to 88 km/hr (25 to 55 mph) with a mode of 64 km/hr (40 mph). The number of lanes on the cross streets ranged from two to six lanes, divided and undivided. The course included curb and guttered roadways as well as open shoulder cross-section roadbeds. The pavement through the course intersections was in good condition. Additionally, the course was checked to ensure debris would not be a problem for the participants (one roadway was swept to remove gravel from the travel lane). There were a myriad of lane widths, bicycle-facility types, and striping conditions (and combinations thereof) present at the intersections along the course. The width of the outside motor vehicle lanes ranged from 2.75 to 4.89 m (9 to 16 feet). Striped bike lanes and paved shoulders ranged from non-existent to 1.25 m (4 feet) wide. The course ran through the entire spectrum of land use forms and street network patterns typically found in U.S. metropolitan areas. Retail commercial uses ranged from shopping malls to small convenience strip centers. Modern community- and neighborhoodscaled centers were also prevalent. Some of the roads on the course were fronted with office buildings, others with medical complexes. Other land uses included churches, convenience stores, fast food restaurants, car repair shops, neighborhood parks, and light industrial areas. In residential areas, there were a variety of single-family homes and multi-family dwelling units. Each participant was provided a score card to carry on the ride. On the top of the score card was a map with the numbered study intersections shown; on the bottom each intersection number was listed followed by the letters A through F. At a pre-ride briefing, participants were asked to grade each intersection on this 6-point (A to F) scale immediately after riding through the intersection. Specifically they were told to “circle the number that best describes how comfortable you feel traveling through the intersection.” Level A was considered the most safe or comfortable (or least hazardous); Level F was considered the most unsafe or uncomfortable (or most hazardous). Data was collected at each intersection with a combination of video and proctor observations. Elevated wide-angle video cameras were linked to traffic signal strain poles. These cameras were connected to VCRs. Microphones connected to the VCRs were used by the proctors to record the participant numbers worn by the cyclists as they rode through the intersections. Tube counters were used to collect real-time traffic volume data to augment the turning movement data. Participant Response Participants in the Study were solicited through newspaper notices and registration displays at bike shops, colleges, trailheads and public buildings. The real-time data collection activity was promoted as an event entitled the Ride for Science 2002. The need to ensure a large number of volunteer cyclists mandated a weekend testing period. The course run (the event) occurred on the Saturday morning of April 6, 2002. The use of the “Ride for Science” event for the bicycle through movement model calibration was recommended by the FDOT project steering committee with a great deal of careful thought and planning. The methodology was approved by the University of Florida Institutional Review Board, and coordination with the FDOT safety office staff was continuous. The consultant staff of Sprinkle Consulting, Inc. managed the event with assistance from the research project steering committee members. It was carefully carried
C:\Clyde_Documents\WorkFolder\LOS Folder\TM IntBLOS4.doc
Landis, Vattikuti, Ottenberg, et. al.
6
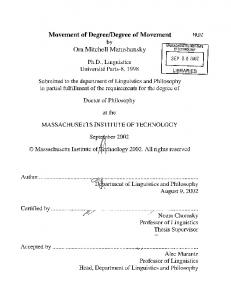
out on a sunny, pleasant Saturday morning in Orlando, Florida. Because there could be no attempt to “control” traffic or influence bicycle rider or motorist behavior through placement of law enforcement officials, and because the cyclists were on regular roadways sharing with motor vehicles, there was a degree of risk involved. This was explained to the participants in advance during a briefing session and by text of the pre-registration forms. Participants were also assured that they could stop at any time along the route and be picked up by a support vehicle if they felt uncomfortable or unsafe. Proctors were deployed at each of the intersections and all precautions were taken should an emergency arise, including assist vehicles that continually drove the Course. There was one reported incident that required medical attention. Throughout the data collection event, care was taken to provide water, Gatorade and refreshments for the participants. Fifty-nine (59) people participated in the event. They first completed registration forms including a series of questions to generate individual profiles of the participants. The participants were briefed on the course configuration and logistical matters as well as given instructions for completing the response cards. Proctors were also stationed on the course at each study intersection and at several other locations. The proctors included staff from MetroPlan Orlando, FDOT, the University of Florida, Sprinkle Consulting, Inc., and a number of regional and local pedestrian and bicycle coordinators from around Florida, Florida Bicycle Association members and Florida’s State Pedestrian and Bicycle Coordinator, Mr. Theo Petritsch. They ensured temporally spaced starts, individual riding, independent response scoring among participants, and current completed response cards (participants were encouraged to reflect on their accumulating experience and hence re-grade as they proceeded through the course). Similar to the separation between segment and intersection analysis in the highway capacity manual level of service determinations, the study’s purpose was to evaluate the quality or level of service of the intersections, not the roadway segments. Accordingly, participants were instructed to consider only roadway conditions within the intersections and their approach lanes, marked with “BEGIN INTERSECTION” and “END INTERSECTION” signs, when grading the intersection. They were also told to neglect conditions outside the right-of-way. Participants evaluated on a 6-point (A to F) scale how well they were served (how comfortable/safe they felt) as they traveled through each intersection. ANALYSIS OF DATA AND INITIAL HYPOTHESIS TESTING Considerable data on both participants and course attributes were collected to permit extensive hypothesis testing. The participant responses indicated a well distributed range for the perceived level of accommodation through the Study intersections. Figure 2 shows the distribution of intersection scores/grades. The relationship of numerical scores to letter grades is shown in Table 1. Although further hypothesis testing is ongoing, at this writing, three tests have been performed in addition to the initial model development. First, a standard pooled error statistical comparison was made between the mean Intersection LOS for the bicycle through movement scores for female riders versus male riders. The means, standard errors, and sample sizes were respectively, 2.86, 0.011, and 20 for female cyclists and 2.83, 0.0064, and 39 for male cyclists. The computed t-test (1.29) was not significant at ;=0.05. The second hypothesis tested was for perception differences associated with bicyclists who were delayed at intersections and those who rode through without delay. It was interesting to note that there was no significant difference in the way those delayed at intersections (for an average of more than 40 seconds each) rated the intersections compared
C:\Clyde_Documents\WorkFolder\LOS Folder\TM IntBLOS4.doc
Landis, Vattikuti, Ottenberg, et. al.
7
to those who were not delayed. The means, standard errors, and sample sizes were, respectively, 2.93, 0.66, and 26 for delayed cyclists and 2.94, 0.17, and 33 for those who rode through the intersection with out being delayed. The computed t-test (0.04) was not significant at ;=0.05. The third test was to determine if experienced (as determined by their reported amount of annual cycling mileage) cyclists graded the intersections differently from inexperienced cyclists. The means, standard errors, and sample sizes were respectively, 2.80, 1.26, and 55 for experienced cyclists and 3.42, 1.15, and 4 for inexperienced cyclists. The computed t-test (3.33) indicated the difference in reporting between experienced inexperienced cyclists was significant at ;=0.05. To allow for the development of a single population model based upon responses from all participants, responses were combined for each of the intersections. MODEL DEVELOPMENT This study sought to mathematically express the intersection geometric, operational and traffic characteristics that affect bicyclists’ perceptions of quality of service, or level of accommodation, through intersections. The following process was applied in developing the preliminary model: (a) identification of which variables are relevant (via Pearson Correlations and Factor Analysis), (b) test for the best configuration of each variable (or combinations thereof), and (c) establish the coefficients for the variables (or combinations thereof) that result in the best-fit regression model. A “long list” of potential primary independent variables influencing bicyclists’ sense of safety or comfort within the intersection was generated then tested (along with numerous other potential factors) in the stepwise regression portion of the model’s development. Items that were included on this preliminary list, and issues considered, included but were not limited to the following: 1. Conflicts • Overtaking right turning motorists. • Right turn on red motorists from side streets. • Overtaking through motorists. • Left turning motorists from the opposing approach. 2. Exposure • Crossing distance (cross-street width plus intersection radii). • Presence of exclusive motor vehicle right turn lane. • Effective width of through lane through intersection (modified by presence of bike lane). • Clearance interval (possibly modified by loop detection for bicyclists). • Motor vehicle volume. • Motor vehicle speed. 3. Delay • Control delay at signalized intersections. • Crossing delay at unsignalized intersections. Pearson correlation and factor analysis of the extensive array of intersection and traffic variables with respect to through movement bicycle level of service was employed. C:\Clyde_Documents\WorkFolder\LOS Folder\TM IntBLOS4.doc
Landis, Vattikuti, Ottenberg, et. al.
8
Subsequently, the following relevant variables were selected for consideration in the second step of the model development process: motor vehicle volume, width of the outside lane, and the intersection crossing distance. Other variables were dropped from further consideration because of their poor correlation with the dependent variable, through movement intersection bicycle level of service (TM IntBLOS), or because of their co-linearity with more strongly correlated variables. The short list of variables represented the best surrogate measures for some of the more complex operational measures. A more precise operational-level model may be developed in the future. Initial testing of various transformations yielded following model format: TM IntBLOS = a1Wt + a2CD + a3(Vol15/L) + C where TM IntBLOS = perceived hazard of shared-roadway environment through the intersection Wt = total width of outside through lane and bike lane (if present) CD = crossing distance, the width of the side street (including auxiliary lanes and median) Vol15 = volume of directional traffic during a 15-minute time period L = total number of through lanes on the approach to the intersection C = constant Researchers conducted stepwise regression analysis using the combined 1,000 realtime observations. Table 2 shows the terms, coefficients, and T-statistics for the model. The correlation coefficient (R2) of the best-fit model is 0.83 based on the averaged observations from the 18 signalized intersections (one intersection was dropped because of incomplete data collection). See Figure 3 for a plot of predicted TM IntBLOS versus mean observed values. The coefficients are statistically significant at the 95 percent level. DISCUSSION OF FINDINGS The Wt term, total width of the outside through lane, includes the width of a bike lane if present. During the 1996 development of the segment Bicycle LOS model it was found that the presence of a striped bike lane essentially doubled the benefit of the additional width. This was not found to be the case for conditions within the intersection environment even though the data sample had a balanced mix of approach lane striping combinations. While this Wt term includes the bike lane width, no additional factor is warranted for the presence of a marked bike lane. However it is important to note that the marked bike lane on the intersection approach has a beneficial effect to the level of service of the intersection for through-moving cyclists. The CD term, total crossing distance, is the measure of the width of the cross street. It includes the width of all the lanes on the cross street (through and auxiliary lanes) and the width of any median. Curb radii were not found to be statistically significant for the bicycle mode.
C:\Clyde_Documents\WorkFolder\LOS Folder\TM IntBLOS4.doc
Landis, Vattikuti, Ottenberg, et. al.
9
Dedicated Right Turn Lanes The researchers expected that the presence of a dedicated right turn lane would have an effect on the perceived comfort level reported by bicyclists. They anticipated that this factor would be significant and thus reflected in the final model. However, the Pearson correlations revealed the reported impact of dedicated right turn lanes to be highly collinear with the traffic volume of the roadway (Pearson correlation of 0.629) and somewhat collinear with crossing distance (Pearson correlation of 0.354). This is probably because right turn lanes typically occur coincident with high ADT and high cross street ADT (or, alternatively large crossing distances). Further study designed to compare the effect of right turn lanes on cyclists’ comfort while holding other factors constant might provide additional precision to the Model. Speed Another factor that was expected to be included in the final model was the speed of motorists in the adjacent travel lanes. This factor was also found to be highly collinear with ADT (Pearson correlation of 0.843). Again, this may be a function of the type of roadway; higher volume roadways having higher speeds. As with dedicated right turn lanes, additional research might provide data that could be used to add precision to the Model. APPLICATIONS The participants in this study represented a broad cross section of the U.S. population of bicyclists, and the course’s intersections were typical of the collectors and arterials prevalent in the urban and suburban areas of the United States. The initial result of this research is the development of a highly reliable, statistically calibrated model suitable for application in the vast majority of U.S. metropolitan areas. Additional studies are planned to produce intersection left turn and right turn bicycle level of service models that will provide for a more complete intersection bicycle level of service methodology. Table 1 may be used as a basis for stratifying the Model’s numerical result into a LOS class when it is applied to a particular intersection. It should be noted that this stratification was predetermined because the responses gained in the study were based on the standard U.S. educational system’s letter grade structure (with the exception of Grade “E”). The (segment) Bicycle LOS method is used by numerous jurisdictions to determine the level of accommodation provided to bicyclists on roadways between intersections. In some of these jurisdictions, policy decisions to provide a minimum level of accommodation for bicyclists are evaluated using the Bicycle LOS method. The Intersection LOS for the bicycle through movement methodology makes it possible to evaluate complete roadway facility in addition to that for the roadway segments. ACKNOWLEDGMENTS The authors wish to thank the University of Florida, the Florida Department of Transportation, MetroPlan Orlando, William Hunter, Elena Prassas, the state and regional pedestrian and bicycle coordinators and many volunteers of Florida who assisted in the Study.
C:\Clyde_Documents\WorkFolder\LOS Folder\TM IntBLOS4.doc
Landis, Vattikuti, Ottenberg, et. al.
10
REFERENCES 1. 2002 Quality/Level of Service Handbook, Florida Department of Transportation, Tallahassee, FL, 2002. 2. Landis, B.W. Bicycle Interaction Hazard Score: A Theoretical Model. In Transportation Research Record 1438, TRB, National Research Council, Washington, D.C., 1994, pp. 3-8. 3. Davis, J. Bicycle Safety Evaluation. Auburn University, Auburn, AL, 1987. 4. Sorton, A. Bicycle Stress Level as a Tool to Evaluate Urban and Suburban Bicycle Compatibility. In Transportation Research Record 1438, TRB, National Research Council, Washington, D.C., 1994, pp. 17-24. 5. Epperson, B. Evaluating Suitability of Roadways for Bicycle Use: Toward a Cycling Level of Service Standard. In Transportation Research Record 1438, TRB, National Research Council, Washington, D.C., 1994, pp. 9-16. 6. Harkey, D., Donald, R., Knuiman, M., Stewart, J., Sorton, A. Development of the Bicycle Compatibility Index: A Level of Service Concept, Final Report, FHWA, Department of Transportation, 1998. 7. Landis, B.W. The Bicycle System Performance Measures: The Interaction Hazard and Latent Demand Score Models. ITE Journal, Vol. 66, No. 2, Feb 1996, pp. 18-26. 8. Special Report 209: Highway Capacity Manual, 2000. TRB, National Research Council, Washington, D.C., 2000. 9. Landis, B.W., Vattikuti, V., and Brannick, M. Real-Time Human Perceptions: Toward a Bicyclist Level of Service. In Transportation Research Record 1578, TRB, National Research Council, Washington, D.C., 1997, pp. 119-126. 10. Wilkinson, W.C., Clarke. A, Epperson, B., and Knoblauch, R. Selecting Roadway Design Treatments to Accommodate Bicycles, FHWA, Department of Transportation, 1992.
C:\Clyde_Documents\WorkFolder\LOS Folder\TM IntBLOS4.doc
Landis, Vattikuti, Ottenberg, et. al.
LIST OF TABLES AND FIGURES FIGURE 1 Age distribution of participants FIGURE 2 Grade distribution for intersections FIGURE 3 Regression plot of predicted and observed TM IntBLOS values. TABLE 1 TM Level of Service Categories TABLE 2 Model Coefficients and Statistics
C:\Clyde_Documents\WorkFolder\LOS Folder\TM IntBLOS4.doc
11
Landis, Vattikuti, Ottenberg, et. al.
12
12
NUMBER OF BICYCLISTS
10 8 6 4 2
AGE GROUP
FIGURE 1 Age distribution of participants
C:\Clyde_Documents\WorkFolder\LOS Folder\TM IntBLOS4.doc
Unreported
> 60
56 - 60
51 - 55
46 - 50
41 - 45
36 - 40
31 - 35
26 - 30
21 - 25
< 20
0
Landis, Vattikuti, Ottenberg, et. al.
13
Total Number of Grades on the Course
Summary of Grades 400 344
350
304
300 250
212
200
200 150 87
100
64
50 0 A
B
C
D Grades
FIGURE 2 Grade distribution for intersections
C:\Clyde_Documents\WorkFolder\LOS Folder\TM IntBLOS4.doc
E
F
Landis, Vattikuti, Ottenberg, et. al.
14
.
OBSERVED TM IntBLOS VALUE
4.5 4 3.5 3 2.5 2 1.5 1 0.5 0 1.5
2.0
2.5
3.0
3.5
4.0
PREDICTED TM IntBLOS VALUE
FIGURE 3 Regression plot of predicted and observed TM IntBLOS values
C:\Clyde_Documents\WorkFolder\LOS Folder\TM IntBLOS4.doc
4.5
Landis, Vattikuti, Ottenberg, et. al.
TABLE 1 TM Level of Service Categories TM IntBLOS
Model Score
A B C D E F
≤ 1.5 > 1.5 and ≤ 2.5 > 2.5 and ≤ 3.5 > 3.5 and ≤ 4.5 > 4.5 and ≤ 5.5 > 5.5
C:\Clyde_Documents\WorkFolder\LOS Folder\TM IntBLOS4.doc
15
Landis, Vattikuti, Ottenberg, et. al.
TABLE 2 Model Coefficients and Statistics Model Terms Coefficients T-statistics Width of outside lane: Wt -0.2144 -5.2522 Crossing Distance: CD 0.0153 4.7170 Motor vehicle volume: 0.0066 3.0826 Vol15/L Constant 4.1324 6.5635 2 0.83 Model Correlation (R )
C:\Clyde_Documents\WorkFolder\LOS Folder\TM IntBLOS4.doc
16