0021-972X/07/$15.00/0 Printed in U.S.A.
The Journal of Clinical Endocrinology & Metabolism 92(2):491– 496 Copyright © 2007 by The Endocrine Society doi: 10.1210/jc.2006-1718
Thyroid Function Is Associated with Components of the Metabolic Syndrome in Euthyroid Subjects Annemieke Roos, Stephan J. L. Bakker, Thera P. Links, Rijk O. B. Gans, and Bruce H. R. Wolffenbuttel Departments of Endocrinology (A.R., T.P.L., B.H.R.W.) and Internal Medicine (S.J.L.B., R.O.B.G.), University Medical Center Groningen, University of Groningen, 9713 GZ Groningen, The Netherlands P ⫽ 0.014], low-density lipoprotein cholesterol ( ⫽ ⫺0.068; P ⫽ 0.004), high-density lipoprotein cholesterol ( ⫽ 0.100; P ⬍ 0.001), and triglycerides ( ⫽ ⫺0.102; P ⬍ 0.001). Both FT4 and TSH were significantly associated with HOMA-IR ( ⫽ ⫺0.133; P ⬍ 0.001 and  ⫽ 0.055; P ⫽ 0.024, respectively). Median HOMA-IR increased from 1.42 in the highest tertile of FT4 to 1.66 in the lowest tertile of FT4. FT4 was significantly related to four of five components of the metabolic syndrome (abdominal obesity, triglycerides, high-density lipoprotein cholesterol, and blood pressure), independent of insulin resistance.
Context: Thyroid disease and the metabolic syndrome are both associated with cardiovascular disease. Objective: The aim of this study was to explore the hypothesis that thyroid function, in euthyroid subjects, is associated with components of the metabolic syndrome, including serum lipid concentrations and insulin resistance. Methods: A total of 2703 adult inhabitants of a middle-sized city in The Netherlands participated in this cross-sectional study. Subjects who were not euthyroid were excluded, as were subjects taking thyroid medication, medication for diabetes, and subjects for whom medication data were not available (n ⫽ 1122). Homeostasis model assessment for insulin resistance (HOMA-IR) (mUⴱmmol/liter2) was calculated as fasting insulin (mU/liter) times fasting glucose (mmol/liter) divided by 22.5. The metabolic syndrome was defined according to National Cholesterol Education Program’s Adult Treatment Panel III criteria.
Conclusions: We have demonstrated an association between FT4 levels within the normal reference range and lipids, in accordance with the earlier observed association between (sub)clinical hypothyroidism and hyperlipidemia. Moreover, low normal FT4 levels were significantly associated with increased insulin resistance. These findings are consistent with an increased cardiovascular risk in subjects with low normal thyroid function. (J Clin Endocrinol Metab 92: 491– 496, 2007)
Results: After adjustment for age and sex, free T4 (FT4) was significantly associated with total cholesterol [standardized  () ⫽ ⫺0.059;
T
1988, it lasted until 1998 before the first attempt for an internationally accepted definition was put forward (11). Since then, several expert groups have formulated and adapted definitions (12–14). Both the widely accepted National Cholesterol Education Program’s Adult Treatment Panel (ATP) III definition and the recent International Diabetes Federation (IDF) definition comprise abdominal obesity, dyslipidemia, hypertension, and glucose intolerance (12, 14). Most subjects at risk for cardiovascular disease are euthyroid. Little is known about the relationship between insulin resistance and thyroid function. Only a few small studies have been performed. In a cross-sectional study in 47 healthy euthyroid subjects, it was found that concentrations of free T3 (FT3) are associated with insulin production and hyperinsulinemia (15). In the same study population, it was found that insulin resistance modifies the relationship between levels of TSH and lowdensity lipoprotein cholesterol (LDL-C) (16). A similar study in 117 diabetic patients revealed a comparable interaction between thyroid function and insulin sensitivity in contributing to diabetic dyslipidemia (17). We aimed to investigate the relationship between thyroid function, serum lipids, insulin resistance, and components of the metabolic syndrome in a large sample of euthyroid subjects in the general population.
HYROID DISEASE IS associated with atherosclerotic cardiovascular disease (1–3). This is undoubted for overt hypothyroidism, but there is controversy as to whether this association is also present in subclinical hypothyroidism (2, 4, 5). The association of thyroid disease with atherosclerotic cardiovascular disease may in part be explained by thyroid hormone’s regulation of lipid metabolism and its effects on blood pressure (BP). However, the impact of various degrees of thyroid (dys)function on these factors continues to be debated. It is known that overt hypothyroidism leads to an increase in plasma cholesterol levels and BP (4, 5). Most studies in subclinical hypothyroidism show comparable but less pronounced associations (6, 7). Several cardiovascular risk factors cluster within the metabolic syndrome (8). Insulin resistance is supposed to be the central pathophysiological phenomenon underlying this clustering (9). Although Reaven (10) already highlighted the concepts of insulin resistance and the metabolic syndrome in First Published Online November 7, 2006 Abbreviations: Apo, Apolipoprotein; ATP, Adult Treatment Panel; BMI, body mass index; BP, blood pressure; FT3, free T3; FT4, free T4; HDL-C, high-density lipoprotein cholesterol; HOMA-IR, homeostasis model assessment for insulin resistance; IDF, International Diabetes Federation; LDL-C, low-density lipoprotein cholesterol; TG, triglyceride. JCEM is published monthly by The Endocrine Society (http://www. endo-society.org), the foremost professional society serving the endocrine community.
Subjects and Methods Study population The database used for this study consisted of a random sample of 2703 participants of the PREVEND (Prevention of Renal and Vascular End
491
492
J Clin Endocrinol Metab, February 2007, 92(2):491– 496
Stage Disease) study, all inhabitants, aged 28 –75 yr, of the city of Groningen, a middle-sized city in The Netherlands. The protocol of this study has been described elsewhere (18). In short, the PREVEND study prospectively investigates the natural course of renal and cardiovascular disease in a large cohort drawn from the general population. Subjects using insulin were excluded from this study. For our analyses, subjects not being euthyroid and those using thyroid medication were excluded, as well as subjects taking oral blood glucose-lowering medication, subjects with known diet controlled diabetes, and subjects of whom blood was not taken in the fasting state. Moreover, subjects of whom no pharmacy data about the use of earlier mentioned drugs were available were also excluded from further analysis. Finally, 1581 subjects were evaluated. The local medical ethical committee approved the study. All participants gave written informed consent.
Definitions Euthyroidism was defined as TSH (reference range, 0.35– 4.94 mIU/ liter) and free T4 (FT4) (reference range, 9.14 –23.81 pmol/liter) within the normal reference range while not taking any thyroid medication. The homeostasis model assessment (HOMA) index for insulin resistance (HOMA-IR) was calculated as fasting insulin (mU/liter) times fasting glucose (mmol/liter) divided by 22.5 (19). Body mass index (BMI) was calculated as the ratio between weight and height squared (in kg/m2). Waist circumference was measured on bare skin between the 10th rib and the iliac crest in centimeters. The metabolic syndrome criteria according to the ATP III is defined as the presence of at least three of the following five traits: 1) abdominal obesity, defined as a waist circumference in men greater than 102 cm (40 in.) and in women greater than 88 cm (35 in.); 2) serum triglycerides (TGs) 150 mg/dl (1.7 mmol/liter) or greater; 3) serum high-less than 50 mg/dl (1.3 mmol/liter) in women; 4) BP 130/85 mm Hg or greater; and 5) fasting plasma glucose 110 mg/dl (6.1 mmol/liter) or greater (12). The IDF definition of the metabolic syndrome is defined as central obesity (defined as a waist circumference ⱖ 94 cm and ⱖ 80 cm for Caucasian men and women, respectively, with ethnicity specific values for other groups) plus any two of the following four factors: 1) high TG concentration (ⱖ150 mg/dl or 1.7 mmol/liter) or specific treatment for this lipid abnormality; 2) low HDL-C concentration [⬍40 mg/dl (1.03 mmol/liter) in males and ⬍50 mg/dl (1.29 mmol/liter) in females] or specific treatment for this lipid abnormality; 3) high BP (systolic BP ⱖ 130 mm Hg or diastolic BP ⱖ 85 mm Hg) or treatment of previously diagnosed hypertension; and 4) high fasting plasma glucose concentration [ⱖ 100 mg/dl (5.6 mmol/liter)] or previously diagnosed type 2 diabetes (14).
Laboratory methods Serum samples were stored at ⫺20 C until analysis. Serum TSH was assessed using a microparticle enzyme immunoassay (Architect; Abbott Laboratories, Abbott Park, IL). FT4, FT3, and insulin concentrations were also assessed using a microparticle enzyme immunoassay (AxSYM; Abbott Laboratories). Serum TGs were measured enzymatically. Serum total cholesterol and plasma glucose were assessed using Kodak Ektachem dry chemistry (Eastman Kodak, Rochester, NY). HDL-C was measured with a homogenous method (direct HDL, no. 7D67, AEROSET System; Abbott Laboratories). In this assay system, HDL and apolipoprotein (Apo) B-containing lipoproteins are complexed with one reagent, followed by solubilizing HDL particles by another reagent. LDL-C was calculated using the Friedewald-formula (20). Nephelometry (BN II; Dade Behring Marburg, Germany) was used to determine serum Apo B and Apo A-I. The Apo B method has been standardized against the IFCC SP3– 07 reference standard, and Apo A-I was standardized against the IFCC SP1– 01 standard.
Pharmacy records Pharmacy records were collected at community pharmacies. Because Dutch patients usually register at a single community pharmacy, use of pharmacy records provides a near complete listing of a subject’s prescribed drugs (21). The pharmacy data contain, among others, the name of the drug, number of units dispensed, prescribed daily dose, date the
Roos et al. • Thyroid Function and the Metabolic Syndrome
drugs were obtained, and Anatomical Therapeutical Chemical classification code of the drug.
Statistical analysis SPSS 12 (SPSS, Inc., Chicago, IL) and Excel (Microsoft Corp., Redmond, WA) were used for data analysis. Data are expressed as mean ⫾ sd or median (interquartile range) when appropriate. Statistical comparisons were performed by means of independent-samples t tests for data with a normal distribution, Mann-Whitney U tests for data with a skewed distribution, and 2 tests for percentages. When more than two groups were compared, we applied ANOVA with post hoc analysis according to Tukey in case of data with a normal distribution and Kruskal-Wallis tests for data with a skewed distribution. Multiple linear regression models were performed for associations of thyroid function with serum lipid concentrations and with the various metabolic syndrome traits, with and without adjustment for age, sex, and HOMA-IR. TG, TSH, glucose, and insulin concentrations and HOMA-IR values were log transformed to improve the fit of the linear regression models. P ⬍ 0.05 was considered statistically significant.
Results Population characteristics
Population characteristics are shown in Table 1. Metabolic parameters of subjects with a HOMA-IR in the lowest tertile were significantly different from those with a HOMA-IR in the highest tertile. FT4 in subjects with a HOMA-IR in the lowest tertile was slightly, though significantly, higher than in subjects with a HOMA-IR in the highest tertile. FT3 was significantly associated with age (r ⫽ ⫺0.051; P ⫽ 0.01), whereas FT4 (r ⫽ ⫺0.007; P ⫽ 0.711) and TSH (r ⫽ ⫺0.035; P ⫽ 0.077) were not. FT4 and FT3 were both significantly higher in men than in women (13.0 ⫾ 1.9 vs. 12.6 ⫾ 2.7 pmol/liter and 3.96 ⫾ 2.13 vs. 3.63 ⫾ 0.81 nmol/liter, respectively; both P ⬍ 0.001), whereas TSH was significantly lower in men than in women [1.30 (range 0.93–1.80) vs. 1.42 (range 0.97–2.05) mIU/liter; P ⫽ 0.006]. Lipids
Even in the euthyroid range, TSH was positively associated with HDL-C, TG, and Apo A-I. FT4 was negatively associated with total cholesterol, LDL-C, and TG. FT3 was negatively associated with total cholesterol, LDL-C, TG, and Apo B (Table 2). There were significant positive correlations between age and serum total cholesterol (r ⫽ 0.344; P ⬍ 0.001), LDL-C (r ⫽ 0.339; P ⬍ 0.001), TG (r ⫽ 0.237; P ⬍ 0.001), and Apo B (r ⫽ 0.269; P ⬍ 0.001), and a significant negative correlation between age and HDL-C (r ⫽ ⫺0.100; P ⬍ 0.001). Total cholesterol, LDL-C, TG, and Apo B were significantly higher in men than women (P ⬍ 0.01), and HDL-C and Apo A-I were significantly lower in men than women (P ⬍ 0.01). After adjustment for age and sex, the relationships of TSH with TG and Apo A-I of FT4 with total cholesterol, LDL-C, and TG, and of FT3 with total cholesterol, LDL-C, and TG remained significant. The relationship of FT4 with both HDL-C and Apo B also became significant, whereas the relationship of TSH with HDL was no longer significant. Further adjustment for insulin resistance slightly weakened some associations, but all associations remained significant (Table 2). Finally, further adjustment for obesity (adjustment for both BMI as
Roos et al. • Thyroid Function and the Metabolic Syndrome
J Clin Endocrinol Metab, February 2007, 92(2):491– 496
493
TABLE 1. Population characteristics of 1581 euthyroid subjects from the general population, including statistical comparison of characteristics of subjects in lowest vs. highest tertile of HOMA-IR HOMA-IR (tertile)
Age (yr) Gender (males) BMI (kg/m2) Waist in men (cm) Waist in women (cm) Systolic BP (mm Hg) Diastolic BP (mm Hg) Heart rate (bpm) Total cholesterol (mmol/liter) LDL-C (mmol/liter) HDL-C (mmol/liter) TG (median, mmol/liter) Apo A-I (g/liter) Apo B (g/liter) Fasting glucose (median, mmol/liter) Fasting insulin (median, mU/liter) TSH (median, mIU/liter) FT4 (pmol/liter) FT3 (nmol/liter)
Lowest (range 0.15–1.20)
Middle (range 1.21–2.05)
Highest (range 2.05–30.67)
45 ⫾ 11 38% 23.5 ⫾ 2.8 86 ⫾ 8 76 ⫾ 9 121 ⫾ 17 71 ⫾ 9 67 ⫾ 9 5.4 ⫾ 1.1 3.4 ⫾ 1.0 1.5 ⫾ 0.4 0.9 (0.7–1.2) 1.5 ⫾ 0.3 0.9 ⫾ 0.3 4.0 (3.7– 4.3) 4.8 (3.8 –5.6) 1.34 (1.00 –1.88) 13.0 ⫾ 1.8 3.7 ⫾ 0.7
47 ⫾ 12 45% 25.7 ⫾ 3.5 93 ⫾ 9 81 ⫾ 10 127 ⫾ 18 74 ⫾ 9 70 ⫾ 10 5.6 ⫾ 1.1 3.7 ⫾ 1.1 1.4 ⫾ 0.4 1.1 (0.8 –1.5) 1.4 ⫾ 0.3 1.0 ⫾ 0.3 4.4 (4.1– 4.7) 8.0 (7.1–9.0) 1.35 (0.98 –1.88) 12.8 ⫾ 1.7 3.7 ⫾ 0.9
52 ⫾ 13 53% 28.9 ⫾ 4.4 100 ⫾ 11 92 ⫾ 13 138 ⫾ 21 78 ⫾ 10 71 ⫾ 10 5.9 ⫾ 1.2 3.8 ⫾ 1.1 1.2 ⫾ 0.3 1.5 (1.1–2.2) 1.3 ⫾ 0.3 1.1 ⫾ 0.3 4.9 (4.4 –5.4) 14.1 (11.6 –19.2) 1.44 (1.03–2.01) 12.6 ⫾ 1.7 3.7 ⫾ 0.7
P value
⬍0.001 ⬍0.001 ⬍0.001 ⬍0.001 ⬍0.001 ⬍0.001 ⬍0.001 ⬍0.001 ⬍0.001 ⬍0.001 ⬍0.001 ⬍0.001 ⬍0.001 ⬍0.001 ⬍0.001 ⬍0.001 NS ⬍0.001 NS
Each tertile consists of 527 subjects. HOMA-IR range in mUⴱmmol/liter2. Data are given as mean ⫾ SD or median (interquartile range). bpm, Beats per minute; NS, not significant.
a continuous variable and BMI ⬎ 30 kg/m2) did not significantly change any of the associations (data not shown). Insulin resistance
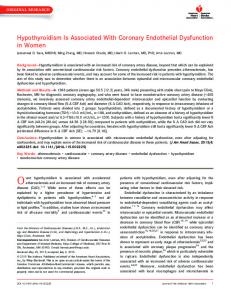
Median HOMA index was 1.55 mUⴱmmol/liter2 (interquartile range 1.03–2.42). We found a clear, negative relationship of HOMA index with FT4 ( ⫽ ⫺0.120; P ⬍ 0.001), independent of waist circumference. After adjustment for age and sex, this relationship remained significant ( ⫽ ⫺0.133; P ⬍ 0.001), whereas the relationship of HOMA index with TSH also became significant ( ⫽ 0.055; P ⫽ 0.024). These associations did not significantly change after further adjustment for obesity. Fasting glucose and insulin levels were significantly related with FT4 too. Median HOMA index in relation with FT4 is shown in Fig. 1. Metabolic syndrome aspects
The overall percentage of the metabolic syndrome in euthyroid subjects according to the ATP III definition was 19.1% for men (presence of three, four, and five metabolic syndrome traits in 13.8, 4.9, and 0.4%, respectively) and 15.4% for women (presence of three, four, and five metabolic syndrome traits in 9.1, 5.4, and 0.9%, respectively), increasing with age. The overall percentage of the metabolic syndrome in euthyroid subjects according to the IDF definition was 18.3% for men and 12.7% for women. As shown in Table 2, FT4 was significantly related to four of five of the metabolic syndrome traits (all but hypertension) when adjusted for age and sex. FT3 was significantly related to two and TSH only to one metabolic syndrome trait. When further adjusted for insulin resistance, associations of FT4 with waist, TG and HDL-C became slightly weaker but remained significant. In contrast, the relation of FT4 with systolic and diastolic BP became significant now. The relation of FT4 with fasting glucose was no longer significant after adjustment for insulin resistance. Finally, further adjustment
for obesity [with BMI as a continuous variable and separately with BMI as a dichotomized variable (BMI ⬎30 kg/m2)] did not materially change any of the associations presented in Table 2, except the association between FT4 and waist circumference, which lost significance. Discussion
In this population-based study, we found a significant negative correlation between thyroid hormone levels (FT4 and FT3) and both total cholesterol, as well as the atherogenic LDL-C and its Apo B within euthyroid subjects. This finding is consistent with the well-known association of (subclinical) hypothyroidism with elevated levels of total cholesterol and LDL-C (4). Moreover, low normal FT4 levels were significantly associated with higher insulin resistance. Finally, FT4 was significantly related to four of five metabolic syndrome traits. These findings might implicate that subjects with low normal thyroid function are already at increased cardiovascular risk. To the best of our knowledge, this is the first community-based study that has investigated this association in subjects with normal thyroid function. It shows that the influence of thyroid function on lipid metabolism extends into the euthyroid range. The pathophysiological process behind the influence of thyroid function on lipid metabolism is known from subjects with overt thyroid dysfunction. Hypercholesterolemia in hypothyroidism, characterized by elevated levels of LDL-C and Apo B, is caused by a decreased catabolism of LDL due to a reduction in the number of LDL receptors on liver cell surfaces (4, 22). This process is under the control of T3 (23). Moreover, changes in plasma LDL-C in the transition from hypothyroidism or hyperthyroidism to euthyroidism were found to correlate with changes in FT4 (24). The elevation of TGs in hypothyroidism is caused by a reduced removal rate of TG from plasma due to a decrease in the activity of hepatic
494
J Clin Endocrinol Metab, February 2007, 92(2):491– 496
Roos et al. • Thyroid Function and the Metabolic Syndrome
TABLE 2. Associations of thyroid function with serum lipid concentrations and the components of the metabolic syndrome Model
Total cholesterol LDL-C HDL-C TG Apo A-I Apo B Waist circumference Systolic BP Diastolic BP Fasting glucose
1 2 3 1 2 3 1 2 3 1 2 3 1 2 3 1 2 3 1 2 3 1 2 3 1 2 3 1 2 3
TSH
FT4
FT3

P

P

P
0.011 0.016 0.013 ⫺0.031 ⫺0.016 ⫺0.020 0.061 0.019 0.036 0.067 0.089 0.069 0.084 0.054 0.062 ⫺0.009 0.007 0.002 ⫺0.044 0.000 ⫺0.025 ⫺0.021 0.005 ⫺0.008 ⫺0.013 0.021 0.010 0.025 0.042 0.011
0.670 0.490 0.594 0.224 0.501 0.402 0.016 0.411 0.098 0.008 ⬍0.001 0.002 0.001 0.026 0.009 0.714 0.758 0.943 0.079 0.993 0.162 0.396 0.803 0.690 0.610 0.351 0.634 0.320 0.075 0.581
⫺0.060 ⫺0.059 ⫺0.050 ⫺0.055 ⫺0.068 ⫺0.059 0.039 0.100 0.059 ⫺0.075 ⫺0.102 ⫺0.051 ⫺0.037 0.010 ⫺0.013 ⫺0.040 ⫺0.057 ⫺0.040 ⫺0.042 ⫺0.098 ⫺0.037 0.041 0.016 0.049 0.057 0.020 0.046 ⫺0.032 ⫺0.048 0.029
0.017 0.014 0.037 0.030 0.004 0.013 0.122 ⬍0.001 0.007 0.003 ⬍0.001 0.023 0.140 0.691 0.587 0.109 0.020 0.104 0.093 ⬍0.001 0.038 0.105 0.462 0.019 0.023 0.366 0.035 0.205 0.046 0.135
⫺0.101 ⫺0.078 ⫺0.078 ⫺0.094 ⫺0.085 ⫺0.085 ⫺0.013 0.041 0.037 ⫺0.053 ⫺0.064 ⫺0.060 ⫺0.004 0.046 0.044 ⫺0.104 ⫺0.105 ⫺0.104 0.004 ⫺0.024 ⫺0.019 0.036 0.044 0.047 0.045 0.035 0.037 ⫺0.030 ⫺0.023 ⫺0.017
⬍0.001 0.001 0.001 ⬍0.001 ⬍0.001 ⬍0.001 0.593 0.078 0.086 0.036 0.009 0.008 0.871 0.059 0.067 ⬍0.001 ⬍0.001 ⬍0.001 0.866 0.251 0.269 0.158 0.043 0.025 0.072 0.112 0.086 0.233 0.326 0.37
Values of  are standardized regression coefficients: model 1, crude; model 2, after adjustment for age and sex; and model 3, after further adjustment for HOMA-IR.
TG lipase (25–27). Our data show that these pathophysiological mechanisms are already operative in the euthyroid state.
5
P < 0.001
H OM A- IR (m U* m m o l / l2 )
4
3
2
1
0
tertiles of FT4
FIG. 1. Box plot of HOMA-IR for tertiles of FT4 in euthyroid subjects. FT4 ranged from 9.14 –12.0 pmol/liter in tertile I, 12.01–13.50 in tertile II, and 13.51–23.81 in tertile III.
Adjustment for age and sex changed several associations of thyroid function with lipids. We think that sex is a confounder in the association of TSH with HDL-C. The association of FT4 with HDL-C appeared to be significant after adjustment for age and sex, whereas its association with Apo A-I was not. Further adjustment for TG did not change the significant association of FT4 with HDL-C. Seemingly, the known effect of thyroid hormone on cholesteryl ester transfer protein mass and activity underlies the association, rather than an effect of TG. The stronger association of FT4 with LDL-C after adjustment for age and sex is consistent with the finding that FT4 and Apo B were significantly associated after adjustment for age and sex. After further adjustment for insulin resistance, the association with Apo B was no longer significant. The concept of the metabolic syndrome has been accepted long before an internationally recognized definition was developed in 1998. The various metabolic syndrome traits are all well documented cardiovascular risk factors that co-occur in an individual more often than might be expected by chance. It is generally hypothesized that the major underlying pathophysiological process is insulin resistance (9). In our study, we found an association of low normal FT4 with insulin resistance. This is consistent with our finding that low normal FT4 was associated with higher TG, lower HDL-C, and abdominal obesity. However, these associations were independent of insulin resistance, indicating that other mechanisms than those associated with insulin resistance
Roos et al. • Thyroid Function and the Metabolic Syndrome
underlie the relation of FT4 with these components of the metabolic syndrome. This independence of insulin resistance was taken even further with respect to BP, where it appeared that insulin resistance was a positive confounder in the relationship with FT4. The relationship of FT3 with the various metabolic syndrome traits was less clear. This may be explained by the fact that serum-FT3 levels do not reflect levels in peripheral tissue, which are known to actually exert the metabolic effect (28). Moreover, it is the general feeling among clinical chemists and endocrinologists that the relation of levels of FT3 in the normal range with thyroid function is not very strong. Our results indicate that, in the euthyroid range, FT4 and FT3 rather than TSH are related to cardiovascular risk factors. Seemingly there is, at least in the euthyroid range, a discrepancy between effects that thyroid hormone has on peripheral tissues and the effect that the hormone has on central feedback inhibition of TSH release. Such a discrepancy may, for instance, originate from differences between the central and peripheral tissues in expression of thyroid hormone receptor isoforms, and in expression of type 1 and type 2 iodothyronine deiodinase, with different catalytic properties (29 –31). Type 1 iodothyronine deiodinase plays an important role in converting T4 to T3 within the thyroid gland itself, and in the liver and kidney, whereas type 2 iodothyronine deiodinase is much more important in the brain, hypothalamus, and pituitary gland (29, 32, 33). Of particular interest for a potential discrepancy is that expression of the thyroid hormone transporter monocarboxylate transporter 8 is thought to be of great importance for the uptake of thyroid hormone by thyroid hormone-sensitive neuronal cells (32, 34), whereas there is no evidence for a hypothyroid state in the liver of male patients with hemizygous mutations in monocarboxylate transporter 8 (35). This suggests that liver cells take up thyroid hormone predominantly via other transporters, such as the Na⫹/taurocholate cotransporting polypeptide and the organic anion transporting polypeptide families, which are expressed in the liver in particular (36). Polymorphisms in the TSH receptor have influenced ratios of plasma TSH and thyroid hormones, and can, therefore, also play a role in inducing a discrepancy between central and peripheral tissues (37). A limitation of this study is that it has a cross-sectional design, implicating that cause and effect relationships cannot be discerned. However, we believe that its strength is due to the great number of subjects derived from the general population. Another point of care is the concept of the metabolic syndrome itself, which some investigators have recently criticized as being a “syndrome.” In these authors’ opinion, there is considerable doubt regarding its value as a cardiovascular disease risk factor and its additional value beyond the individual components (38, 39). However, in an elaborate reply, Alberti et al. (14) continue to state that the criteria for the metabolic syndrome serve a useful purpose for identification of people at increased cardiovascular risk. In our study, we focused mainly on the individual components of the metabolic syndrome. In conclusion, we demonstrated that thyroid function and lipid levels are associated even in subjects classified as being euthyroid, thereby extending the established relation be-
J Clin Endocrinol Metab, February 2007, 92(2):491– 496
495
tween (sub)clinical hypothyroidism and hyperlipidemia in the normal range. Moreover, low normal FT4 levels were significantly associated with increased insulin resistance and with four of five metabolic syndrome traits. These findings are consistent with an increased cardiovascular risk in subjects with low normal thyroid function. A prospective study has to be performed to assess a possible role for the treatment of thyroid dysfunction at an earlier stage. Acknowledgments Received August 9, 2006. Accepted October 31, 2006. Address all correspondence and requests for reprints to: Bruce H. R. Wolffenbuttel, M.D., Ph.D., Department of Endocrinology, University Medical Center Groningen and University of Groningen, P.O. Box 30001, 9700 RB Groningen, The Netherlands. E-mail:
[email protected]. Disclosure Statement: The authors have nothing to disclose.
References 1. Cappola AR, Ladenson PW 2003 Hypothyroidism and atherosclerosis. J Clin Endocrinol Metab 88:2438 –2444 2. Hak AE, Pols HA, Visser TJ, Drexhage HA, Hofman A, Witteman JC 2000 Subclinical hypothyroidism is an independent risk factor for atherosclerosis and myocardial infarction in elderly women: the Rotterdam Study. Ann Intern Med 132:270 –278 3. Klein I, Ojamaa K 2001 Thyroid hormone and the cardiovascular system. N Engl J Med 344:501–509 4. Duntas LH 2002 Thyroid disease and lipids. Thyroid 12:287–293 5. Fommei E, Iervasi G 2002 The role of thyroid hormone in blood pressure homeostasis: evidence from short-term hypothyroidism in humans. J Clin Endocrinol Metab 87:1996 –2000 6. Biondi B, Klein I 2004 Hypothyroidism as a risk factor for cardiovascular disease. Endocrine 24:1–13 7. Canaris GJ, Manowitz NR, Mayor G, Ridgway EC 2000 The Colorado thyroid disease prevalence study. Arch Intern Med 160:526 –534 8. Grundy SM 2004 Obesity, metabolic syndrome, and cardiovascular disease. J Clin Endocrinol Metab 89:2595–2600 9. Eckel RH, Grundy SM, Zimmet PZ 2005 The metabolic syndrome. Lancet 365:1415–1428 10. Reaven GM 1988 Banting lecture 1988. Role of insulin resistance in human disease. Diabetes 37:1595–1607 11. Alberti KG, Zimmet PZ 1998 Definition, diagnosis and classification of diabetes mellitus and its complications. Part 1: diagnosis and classification of diabetes mellitus provisional report of a WHO consultation. Diabet Med 15: 539 –553 12. Expert Panel on Detection, Evaluation, and Treatment of High Blood Cholesterol In Adults 2001 Executive Summary of The Third Report of The National Cholesterol Education Program (NCEP) Expert Panel on Detection, Evaluation, And Treatment of High Blood Cholesterol In Adults (Adult Treatment Panel III). JAMA 285:2486 –2497 13. Balkau B, Charles MA 1999 Comment on the provisional report from the WHO consultation. European Group for the Study of Insulin Resistance (EGIR). Diabet Med 16:442– 443 14. Alberti KG, Zimmet P, Shaw J 2005 The metabolic syndrome–a new worldwide definition. Lancet 366:1059 –1062 15. Bakker SJ, ter Maaten JC, Popp-Snijders C, Heine RJ, Gans RO 1999 Triiodothyronine: a link between the insulin resistance syndrome and blood pressure? J Hypertens 17:1725–1730 16. Bakker SJ, ter Maaten JC, Popp-Snijders C, Slaets JP, Heine RJ, Gans RO 2001 The relationship between thyrotropin and low density lipoprotein cholesterol is modified by insulin sensitivity in healthy euthyroid subjects. J Clin Endocrinol Metab 86:1206 –1211 17. Chubb SA, Davis WA, Davis TM 2005 Interactions between thyroid function, insulin sensitivity and serum lipid concentrations: The Fremantle Diabetes Study. J Clin Endocrinol Metab 90:5317–5320 18. Pinto-Sietsma SJ, Janssen WM, Hillege HL, Navis G, De Zeeuw D, De Jong PE 2000 Urinary albumin excretion is associated with renal functional abnormalities in a nondiabetic population. J Am Soc Nephrol 11:1882–1888 19. Matthews DR, Hosker JP, Rudenski AS, Naylor BA, Treacher DF, Turner RC 1985 Homeostasis model assessment: insulin resistance and -cell function from fasting plasma glucose and insulin concentrations in man. Diabetologia 28:412– 419 20. Friedewald WT, Levy RI, Fredrickson DS 1972 Estimation of the concentration of low-density lipoprotein cholesterol in plasma, without use of the preparative ultracentrifuge. Clin Chem 18:499 –502
496
J Clin Endocrinol Metab, February 2007, 92(2):491– 496
21. Lau HS, de Boer A, Beuning KS, Porsius A 1997 Validation of pharmacy records in drug exposure assessment. J Clin Epidemiol 50:619 – 625 22. Diekman T, Demacker PN, Kastelein JJ, Stalenhoef AF, Wiersinga WM 1998 Increased oxidizability of low-density lipoproteins in hypothyroidism. J Clin Endocrinol Metab 83:1752–1755 23. Chait A, Bierman EL, Albers JJ 1979 Regulatory role of triiodothyronine in the degradation of low density lipoprotein by cultured human skin fibroblasts. J Clin Endocrinol Metab 48:887– 889 24. Diekman MJ, Anghelescu N, Endert E, Bakker O, Wiersinga WM 2000 Changes in plasma low-density lipoprotein (LDL)- and high-density lipoprotein cholesterol in hypo- and hyperthyroid patients are related to changes in free thyroxine, not to polymorphisms in LDL receptor or cholesterol ester transfer protein genes. J Clin Endocrinol Metab 85:1857–1862 25. Nikkila EA, Kekki M 1972 Plasma triglyceride metabolism in thyroid disease. J Clin Invest 51:2103–2114 26. Tulloch BR, Lewis B, Fraser TR 1973 Triglyceride metabolism in thyroid disease. Lancet 1:391–394 27. Ito M, Takamatsu J, Matsuo T, Kameoka K, Kubota S, Fukata S, Tamai H, Miyauchi A, Kuma K, Hanafusa T 2003 Serum concentrations of remnant-like particles in hypothyroid patients before and after thyroxine replacement. Clin Endocrinol (Oxf) 58:621– 626 28. Escobar-Morreale HF, Obregon MJ, Escobar del Rey F, Morreale de Escobar G 1995 Replacement therapy for hypothyroidism with thyroxine alone does not ensure euthyroidism in all tissues, as studied in thyroidectomized rats. J Clin Invest 96:2828 –2838 29. Croteau W, Davey JC, Galton VA, St Germain DL 1996 Cloning of the mammalian type II iodothyronine deiodinase. A selenoprotein differentially expressed and regulated in human and rat brain and other tissues. J Clin Invest 98:405– 417 30. Flamant F, Samarut J 2003 Thyroid hormone receptors: lessons from knockout and knock-in mutant mice. Trends Endocrinol Metab 14:85–90
Roos et al. • Thyroid Function and the Metabolic Syndrome
31. Zhang J, Lazar MA 2000 The mechanism of action of thyroid hormones. Annu Rev Physiol 62:439 – 466 32. Fliers E, Unmehopa UA, Alkemade A 2006 Functional neuroanatomy of thyroid hormone feedback in the human hypothalamus and pituitary gland. Mol Cell Endocrinol 251:1– 8 33. Jansen J, Friesema EC, Milici C, Visser TJ 2005 Thyroid hormone transporters in health and disease. Thyroid 15:757–768 34. Heuer H, Maier MK, Iden S, Mittag J, Friesema EC, Visser TJ, Bauer K 2005 The monocarboxylate transporter 8 linked to human psychomotor retardation is highly expressed in thyroid hormone-sensitive neuron populations. Endocrinology 146:1701–1706 35. Friesema EC, Grueters A, Biebermann H, Krude H, von Moers A, Reeser M, Barrett TG, Mancilla EE, Svensson J, Kester MH, Kuiper GG, Balkassmi S, Uitterlinden AG, Koehrle J, Rodien P, Halestrap AP, Visser TJ 2004 Association between mutations in a thyroid hormone transporter and severe Xlinked psychomotor retardation. Lancet 364:1435–1437 36. Hennemann G, Docter R, Friesema EC, de Jong M, Krenning EP, Visser TJ 2001 Plasma membrane transport of thyroid hormones and its role in thyroid hormone metabolism and bioavailability. Endocr Rev 22:451– 476 37. Peeters RP, van Toor H, Klootwijk W, de Rijke YB, Kuiper GG, Uitterlinden AG, Visser TJ 2003 Polymorphisms in thyroid hormone pathway genes are associated with plasma TSH and iodothyronine levels in healthy subjects. J Clin Endocrinol Metab 88:2880 –2888 38. Kahn R, Buse J, Ferrannini E, Stern M 2005 The metabolic syndrome: time for a critical appraisal: joint statement from the American Diabetes Association and the European Association for the Study of Diabetes. Diabetes Care 28: 2289 –2304 39. Reaven GM 2005 The metabolic syndrome: requiescat in pace. Clin Chem 51:931–938
JCEM is published monthly by The Endocrine Society (http://www.endo-society.org), the foremost professional society serving the endocrine community.