Journal of Chromatographic Science, Vol. 45, July 2007
Evaluation of Ultra-Performance Liquid Chromatography in the Bioanalysis of Small Molecule Drug Candidates in Plasma Lee Goodwin*, Stephen A. White, and Neil Spooner Worldwide Bioanalysis, Glaxosmithkline Research and Development, Park Road, Ware, Hertfordshire, SG12 0DP, UK
Abstract Ultra-performance liquid chromatography (UPLC) combined with mass spectrometric detection (MS) is used successfully in the bioanalysis of small molecule drug candidates in plasma. UPLC–MS is shown to increase sample throughput by reducing run times over 3-fold, without compromising analytical sensitivity or analyte resolution. The technique is demonstrated to be practical and robust on a commercially available ultra-high pressure system when injecting extracts of plasma and has also shown to be a technique that can be used effectively on a conventional highperformance liquid chromatography system fitted with short columns (≤ 30 mm in length).
Introduction The most widely used technique in the pharmaceutical industry for the quantitative determination of small molecule drug candidates in biological matrices is high-performance liquid chromatography (HPLC) with detection by tandem mass spectrometry (MS–MS). Recently, the use of fast HPLC gradients has allowed sample analysis time to be reduced to less than 3 min (1–4), and in our laboratories, isocratic methods ≤ 1.5 min are routinely run. The need to minimize run times is driven by the requirement to increase productivity (i.e., sample throughput) on high cost capital instruments. Further improvements in sample throughput are generally limited using conventional HPLC. For example, speed of separation may be improved by increasing the HPLC flow rate, but this results in reduced analyte response due to dilution of the peak (5). Specifically, the greater the flow rate, the more solvent enters the MS source, making it more difficult to produce gas phase analyte ions. Sample analysis time can also be improved through increased selectivity of MS–MS detection, meaning that baseline resolution is not necessary to determine non-isobaric analyte peaks. Thus, sample analysis time can be rapid as “perfect” chromatog-
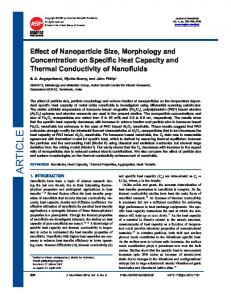
raphy is not required. However, a major factor in maintaining acceptable analyte response whilst speeding up analysis time is ensuring that target analytes do not elute in the chromatographic region affected by ion suppression. It is well known that endogenous components of a biological sample cause a major reduction in electrospray response in the region that they elute (6). Therefore, the minimum run time is determined by the chromatography required to move target analytes away from the ion suppression region. During the mid-1970’s it was demonstrated that reducing the particle size of the HPLC stationary phase resulted in faster separations (7). As the particle size is reduced to 2 µm and below, the efficiency of the column is increased (Figure 1), bringing it into a region termed ultra-performance liquid chromatography (UPLC). Thus, by decreasing the particle size of the stationary phase, greater resolution is achieved between peaks, or the same resolution can be achieved in less time. Also, greater column efficiency results in narrower peaks, increased analyte peak height, and, therefore, improved analyte response. Sub 2-µm particles demonstrate an additional benefit in that they maintain effi-
Figure 1. Representation of efficiency of columns packed with 10, 5, 3.5, and 1.7 µm particles.
* Author to whom correspondence should be address: email
[email protected].
298
Reproduction (photocopying) of editorial content of this journal is prohibited without publisher’s permission.
Journal of Chromatographic Science, Vol. 45, July 2007
ciency of separation over a much wider linear velocity than larger particles (8) (Figure 1). The limiting factor in utilizing small particle size columns is pressure. At typical flow rates (0.5–1.5 mL/min), temperatures (25–50°C), column dimensions (e.g., 50 mm × 2.1 mm), and mobile phase compositions, current HPLC systems can be expected to support columns packed with 3-µm stationary phases. However, as the pressure change is inversely proportional to the square of the change in particle size, moving from 3 µm to a 1.7 µm stationary phase material would increase the back pressure on the system c. 3-fold. (9). Currently, most commercial HPLC systems have a pressure limit ≤ 400 bar (5800 psi) and using typical size columns containing sub 2-µm stationary phase would yield back pressures close to, or greater than the threshold limit on most systems. Thus, there are two opportunities to enable UPLC to be used routinely. Firstly, to use shorter columns (≤ 30 mm) or secondly to introduce hardware that has a higher pressure threshold. The first fully integrated commercially available system that can routinely perform UPLC under typical conditions is the Waters Acquity, a system designed to withstand back pressures of up to 1000 bar (15000 psi). This system has demonstrated some of the advantages expected from UPLC, such as higher column efficiency and reduced run times (10–12). Here an assessment of prolonged, routine use of UPLC is presented in the bioanalysis of drug candidates looking at the advantages over HPLC, both in terms of system robustness and column performance. The performance of the Waters Acquity “high pressure” system and the practicality of performing UPLC on conventional “low pressure” HPLC pumps is assessed.
Experimental
CA). “Normal pressure” UPLC experiments were carried out using an Agilent 1100 pump (Agilent, Palo Alto, CA) that was optimized for minimal dead volume, a CTC autosampler (Presearch, Hitchin, UK), and a Sciex API-4000 MS detector. Columns were supplied by Phenomonex (Macclesfield, UK), Waters, and Agilent. All experiments were performed with a 0.25µm in-line frit (Anachem, Luton, UK) to protect the columns. Waters MassLynx software V 4.0 was used to control the Acquity and Premier MS. Analyst 1.1 (Applied Biosystems) was used to control the Agilent 1100 and Sciex API-4000. Signal-to-noise (S/N) calculations were performed using the calculation software within MassLynx V 4.0. Reagents
All solvents and reagents were of HPLC grade and were obtained from Sigma (Poole, UK) or Aldrich (Poole, UK). For all experiments, the aqueous mobile phase was 1mM ammonium acetate (A), and the organic mobile phase was acetonitrile (B). Extraction of analytes from plasma
The results presented focus on a novel drug candidate (Analyte A) and two of its metabolites (Metabolite I and Metabolite II). The procedure for extracting the analytes from plasma involved precipitation by the addition 800 µL of 95:5 acetonitrile–methanol (v/v) to 100 µL plasma. The extract was vortex mixed, then centrifuged (Multifuge 3 L-R, Heraeus, Hanau, Germany) at 3000 × g for 20 min. The supernatant was transferred to a fresh tube and dried under a stream of nitrogen (40°C) on a Minivap (Porvair Sciences, Shepperton, UK). The sample was then reconstituted in 100 µL of 12.5:12.5:75 acetonitrile–isopropan-2-ol–water (v/v/v). The injection volume was constant throughout the experiments at 15 µL, and, unless otherwise stated, the concentration of each analyte in plasma was 2 ng/mL. Acquity-Sciex API-4000 Interface
Instrumentation
“High pressure” UPLC experiments were carried out using a Waters Acquity UPLC system (Waters, Milford, MA) coupled to either a Waters Premier Triple Quadrupole MS detector or a Sciex API-4000 MS detector (Applied Biosystems, Foster City,
Interfacing the Acquity with the Sciex API-4000 was achieved using a cable that was made up to connect the “Aux I/O” port on the Sciex API-4000 to the “Inject Start” and “Hold Inject” contact closure switches on the Acquity (Figure 2). The system was connected such that the Sciex API-4000 acted as the master and the Acquity as the slave. The API-4000 holds the injection of the Acquity until it is ready to start acquiring. When the API-4000 is ready to acquire signals or to stop the “Hold Inject”, the Acquity injects the sample, sending an “Inject Start” signal back to the API4000 to start data acquisition.
Results and Discussion Progression of a method from HPLC to UPLC
Figure 2. Diagram of 2-way communication set-up between Waters Acquity and Sciex API-4000.
Analyte A and two of its metabolites (Metabolite I and Metabolite II) were chosen as the test compounds for UPLC analyses because of inherent problems in developing an HPLC–MS (multiple reaction monitoring) method for the compounds. Sensitive (pg/mL) limits of quantitation (LOQ) are required for all three analytes, and to achieve this for the metabolites, the same mass transition has to be used, requiring that they are
299
Journal of Chromatographic Science, Vol. 45, July 2007
baseline resolved. The validated HPLC method used to support several preclinical toxicokinetic studies and the first time in human clinical study, required a fast gradient on a 50 × 3 mm, 4 µm Synergi Polar-RP column with a run time of 2.5 min in order to achieve adequate analyte response and separation of Metabolite I and Metabolite II (Figure 3). The theory of UPLC suggests that analyte response should be improved compared with HPLC due to peak sharpening. A potential issue with using MS detection for UPLC is that the scan speed of the instrument needs to be increased to acquire enough data points to adequately define the narrow peak. Typically, validated HPLC methods developed in our group would have scan speeds in the range of 100–200 ms, whereas for UPLC it was envisaged that scan speeds as low as 20 ms may be required. To determine the effect of faster scanning on analyte response, a test solution of Analyte A was prepared, and 15 µL was injected onto
the Agilent 1100-Sciex API-4000 system and Acquity-Premier system. Two detectors were set-up to determine analyte response at 150 and 20 ms. The test solution was then diluted 2-fold continuously until the peak disappeared into the background noise, defined as the limit of detection (LOD). For both detectors, the noise increased at the faster scanning rate, and in each case, the LOD was 50% lower at 20 ms than at the 150 ms scan rate (Table I). The test solution was then injected onto both systems with the scanning speed set at 50 ms, and both instruments displayed the same LOD as they had recorded at 150 ms. It should be noted, however, that the sensitivities of the detectors were different rel-
A
A
B
B
×
Figure 4. Chromatogram of Analyte A (A) and two metabolites (B) using the gradient conditions from the validated HPLC methods with a UPLC column on an Acquity-Premier system. All analytes at a concentration of 2 ng/mL.
×
Figure 3. Typical chromatogram of Analyte A (A) and two metabolites (B) under validated HPLC conditions on a Waters Acquity-Premier system. All analytes at a concentration of 2 ng/mL.
Table I. Results Summary Table for Determination of the Limit of Detection for Analyte A in Positive and Negative Ion Mode on a Sciex API-4000 and a Waters Premier
Mass spectrometer
Ionization mode
Scan rate (ms)
LOD for analyte A (pg/mL)
Sciex API-4000
Positive
150 20 150 20
20 40 5 10
150 20 150 20
25 50 250 500
Negative Waters Premier
Positive Negative
300
Table II. Results Summary Table for Analyte A and Its Two Metabolites on the Waters Acquity UPLC System
S/N for Analyte A
Resolution between metabolites*
Cycle time
Column
Conditions
50 × 3.0 Synergi 4 µm Polar RP
Optimized HPLC gradient
2164
1.54
2.5 min
50 × 2.1 BEH C18 1.7 µm
Optimized HPLC gradient
6770
2.00
2.5 min
50 × 2.1 BEH C18 1.7 µm
Optimized Acquity gradient
8861
1.51
1.0 min
Isocratic
2657
1.64
0.7 min
50 × 2.1 BEH C18 1.7 µm
* Resolution calculated using equation: Rs = 2[(tr)b – (tr)a]/Wb + Wa.
Journal of Chromatographic Science, Vol. 45, July 2007
ative to each other (discussed in the Coupling Waters Acquity UPLC to a Sciex API-4000 MS section). All future experiments described were carried out at a scan rate of 50 ms, which was sufficient to give at least 15 data points across each peak. The first step in developing the HPLC method to a UPLC method was to change to a 50 × 2.1 mm BEH C18 1.7 µm Acquity column, whilst keeping all other conditions the same. As expected, the resulting back pressure increased to c. 600 bar (8700 psi), but gave a faster separation with greater resolution between the two metabolites (Figure 4, Table II). The chromatographic conditions were then optimized to get the fastest separation whilst maintaining baseline resolution between Metabolite I and Metabolite II (Figure 5), resulting in a cycle time of 1 min and a S/N that was four-fold greater than achieved with the validated HPLC method.
A
B
×
Figure 5. Chromatogram of Analyte A (A) and two metabolites (B) under optimized UPLC conditions on an Acquity-Premier system. All analytes at a concentration of 2 ng/mL.
A
B
Figure 6. Isocratic UPLC separation (40% B: A = 1mM ammonium Acetate, B = acetonitrile) of analyte A (A) and two metabolites (B) on an Acquity-Premier system (column = Waters Acquity 50 × 2.1 mm BEH C18 1.7 µm). All analytes at a concentration of 2 ng/mL.
An isocratic separation was developed, keeping conditions the same as those described for the optimized UPLC gradient method, but the solvent composition was maintained at 40% organic (Figure 6). The cycle time was reduced to 0.7 min whilst maintaining resolution between Metabolite I and Metabolite II. Despite losing analyte sensitivity compared to gradient elution, isocratic UPLC gave a better analyte response than was achieved with fast gradient HPLC. The results, summarised in Table II, demonstrate the advantage of moving from HPLC to UPLC. UPLC on a “low pressure” system
Although the back pressure generated when using the 50 × 2.1 mm BEH C18 1.7-µm Acquity column was too high to allow the columns to be used on a conventional HPLC system, commercially available cartridges have been developed by Agilent (Zorbax SB-C18 30 × 2.1 mm 1.8 µm) that may have utility (13). The Agilent cartridge is two-thirds the length of the Acquity column, so theoretically it should have two-thirds the back pressure, but due to the wider particle size distribution of the cartridge, the actual back pressure is reduced still further. Data supplied by Agilent Technologies (14) suggests that there is little difference in column efficiency between a narrow and wide particle size distribution, as it is the mean particle size distribution that is relevant. In our investigations, the back pressure of a wide particle size distribution column is c. 25% lower than an equivalent column with a narrow particle size distribution. An Agilent 1100 pump/CTC HT-PAL autosampler/Sciex API4000 system was optimized to reduce the dead volume to a minimum by locating the different modules as closely to each other as physically possible. The system was set to run under the same conditions that were used for isocratic separation of Analyte A, Metabolite I, and Metabolite II on the Acquity (as described previously). Using the Agilent 30 × 2.1 mm 1.8-µm particle size cartridge, the back pressure of the system was 210 bar (3050 psi), comfortably within the limit of the Agilent 1100 pump (400 bar). The isocratic separation achieved using this system was equivalent to that achieved on the Acquity (Figure 7) and demonstrates that UPLC separations are feasible on commercially available
A
B
Figure 7. Isocratic UPLC separation (40% B: A = 1 mM ammonium Acetate, B = Acetonitrile) of Analyte A (A) and two metabolites (B) on an Agilent 1100Sciex API-4000 (column = Agilent Zorbax SB-C18 30 × 2.1 mm 1.8 µm). All analytes at a concentration of 2 ng/mL.
301
Journal of Chromatographic Science, Vol. 45, July 2007
“low pressure” systems. However, it is interesting to note that even when the Agilent system is optimized for gradient elution, the dead volume is still considerably larger than the Acquity. Pressure equilibration on an optimized Agilent system took c. 0.5 min from changing the solvent composition, 2.5 times slower than the Acquity. Column robustness
A concern with using small particle size columns is that they may block more easily than larger particle size columns, especially when applying “dirty” samples, such as those described in Extraction of analytes from plasma section. To determine the robustness of the Waters 50 × 2.1-mm BEH C18 1.7-µm column and the Agilent Zorbax SB-C18 30 × 2.1 mm 1.8-µm cartridge, the Acquity and Agilent system were set-up to perform 1250
Figure 8. Typical chromatograms of Analyte A (top) and two metabolites (bottom) on an Acquity column after 1250 injections onto a Acquity-Premier (A) and an Agilent cartridge after 200 injections onto an Agilent 1100-Sciex API-4000.
Figure 9. Isocratic UPLC (40% B: A = 1mM ammonium Acetate, B = Acetonitrile) reproducibility data on a Waters Acquity-Premier Showing change in Metabolite I peak area on a Waters UPLC column (A), and Agilent UPLC cartridge, and the change in retention time for all three analytes on a Waters UPLC column (C) and Agilent UPLC cartridge (D)
302
injections onto their respective column/cartridge. The Acquity column performed well throughout the test, and after 1250 injections, it was still operating adequately (Figure 8A compared to Figure 6). Over the course of the reproducibility injections, the back pressure of the system increased from 410 to 462 bar (5900 psi to 6700 psi). The Agilent cartridge did not perform as well, and after c. 250 injections, the run was stopped as the back pressure exceeded the 400 bar (5800 psi) pressure limit of the Agilent 1100 pump. The pressure due to the Agilent cartridge had doubled within 200 injections compared to an increase of c. 15% in pressure over 1250 injections on the Acquity column. The result could not be explained by blocking of the cartridge, as the in-line frits used should have trapped any particulate matter, preventing it from going onto the cartridge. The experiment was duplicated with the Agilent column on the Acquity-Premier system and, although the higher pressure tolerance of the Acquity meant that system did not go over pressure, the same trend of increasing pressure was observed. A typical chromatogram acquired using the Agilent cartridge at injection 200 (Figure 8B compared to Figure 7) demonstrated loss of analyte signal. The loss of analyte signal particularly affected Metabolite I and was not apparent with the Acquity system (Figure 9A and 9B), although the Acquity system did begin to show greater variability in peak area after c. 1000 injections. Agilent product support have suggested that the weak performance of the Agilent cartridge may be due to the fact that the cartridges are not packed under high pressure, so when they are subjected to UPLC pressures the separation bed is forced to the outlet end of the column, thus shortening the bed volume and increasing the pressure. Shortening of the bed volume does appear to be reflected by the fact that the retention time of the three analytes becomes increasingly shorter with the Agilent cartridge, whereas the profile is much flatter with the Acquity column (Figures 9C and 9D). The reproducibility experiment was repeated using an Agilent Zorbax SB-C18 50 × 2.1 mm, 1.8-µm column packed under high pressure, and the results appear to confirm the theory, as over 500 injections were performed
Figure 10. Typical chromatogram of a LLQ sample containing Analyte A and Metabolite II at 5 pg/mL and Metabolite I at 10 pg/mL using fast gradient HPLC (Agilent 1100-Sciex API-4000) (A) and isocratic UPLC (Waters AcquitySciex API-4000) (B).
Journal of Chromatographic Science, Vol. 45, July 2007
without any increase in the system back pressure (back pressure at injection 1 was 390 bar, back pressure at injection 500 was 386 bar) or loss of analyte response. Coupling Waters Acquity UPLC to a Sciex API-4000 MS
The mass spectrometers within our group are Sciex instruments, so a system for interfacing them with the Acquity was devised. The set-up described in the Acquity-Sciex API-4000 Interface section is critical when only small amounts of important sample are available as it prevents the samples being wastefully injected if the API-4000 has an error that causes it to shut down. To prevent the API-4000 source flooding with mobile phase if there is a shut down, the Acquity can be programmed to turn the mobile phase flow off if it does not receive an inject signal for a designated amount of time (e.g., 10 min). Using this set-up, the Acquity and API-4000 communicated with each other effectively. The results obtained show the separation efficiency given by the Acquity coupled with the sensitivity of the Sciex API4000 allowed UPLC-MS under isocratic conditions to achieve the same LLQ in less time than was possible using the original fast gradient HPLC-MS on a Agilent 1100-Sciex API-4000 system (Figure 10)
Conclusion Transferring a method for the separation of a drug candidate and two of its metabolites from fast gradient HPLC to UPLC on the Waters Acquity system gave significant benefits with minimal effort. Simply replacing the HPLC column with a UPLC column whilst keeping all other conditions the same sharpened the analyte peaks, improving response and resolution. The UPLC method was optimized with ease to reduce the run time to 2.5 times shorter than was achievable by HPLC, whilst maintaining separation and gaining up to 4-fold improvement in analyte response. The run time was shortened even further using isocratic UPLC conditions, and, despite losing response due to absence of the gradient sharpening effect, the sensitivity of the method was still better than achieved with fast gradient HPLC. The Waters Acquity system is designed to operate at higher pressures than conventional HPLC systems; therefore, it can withstand the back pressures generated by columns of typical dimensions (50 × 2.1 mm) packed with sub-2 µm particle size stationary phase. However, the resolving power of UPLC columns means that for many bioanalytical applications where few analytes are being determined, shorter columns with back pressures within the tolerance range of conventional HPLC systems are a feasible alternative. Utilizing 30 × 2.1 mm 1.8-µm particle size Agilent cartridges on a conventional “low pressure” Agilent 1100 pump gave an equivalent separation to 50-mm Acquity columns on the “high pressure” Waters Acquity system. Due to the reduced column length and wider particle size distribution profile of the Agilent cartridge, the back pressure of the system was only c. 50% of the upper pressure limit. There are concerns over the robustness of the Agilent cartridges compared to the Acquity columns. After 1200 injections, the Acquity column was still performing adequately with a pres-
sure increase of < 15%, but the back pressure of the system utilizing the Agilent cartridge had doubled and over-pressured after c. 250 injections. The increasing pressure is believed to be attributable to the low pressure packing process, as recent data acquired using an Agilent UPLC column packed under high pressure did not display this problem. However, the only high pressure packed Agilent columns commercially available at the time of writing are 50 mm in length and ideally, the columns should be ≤ 30 mm for use on conventional HPLC instrumentation. The two systems described demonstrate the benefits over conventional HPLC, although they both have different associated problems. The Agilent system is not able to re-equilibrate gradient conditions as quickly as the Acquity due to the larger dead volume, impacting on injection to injection times whilst waiting for the pressure to equilibrate. The Acquity does not suffer from re-equilibration delays reaching pressure 2.5 times quicker than an optimized Agilient system, although it has the drawback that connections to detectors from other manufacturers require consideration. Our results show that for some applications, the Sciex API4000 is a more sensitive detector than the Premier instrument. To achieve the best LLQ for some applications it is desirable to use the Sciex API-4000 as the detector for the Acquity. It has been demonstrated that coupling the two instruments is possible and that adequate communication can be achieved by using the Sciex API-4000 as the master (Aux I/O port) and the Acquity as the slave (Hold Inject and Inject Start contact closure switches). This allowed LLQs to be reached by isocratic UPLC that were only possible previously by fast gradient HPLC, in less than a third of the run time. Overall, we feel that UPLC is a valuable tool in the field of small molecule bioanalysis through its ability to significantly increase sample throughput and productivity without compromising analyte resolution or response. As the major manufacturers make UPLC instrumentation and columns available commercially on a wider basis, the performance of the technique should improve further.
Acknowledgments Support from Les Turner and Mike Tucker (In Mass) for assistance with the connecting the Waters Acquity to the Sciex API4000 is gratefully acknowledged.
References 1. J. Ayrton, G.J. Dear, W.J. Leavens, D.N. Mallet, and R.S. Plumb. Use of generic fast gradient liquid chromatography–tandem mass spectroscopy in quantitative bioanalysis. J. Chromatogr. B 709: 243–54 (1998). 2. M. Bayliss, D. Little, D. Mallet, and R. Plumb. Parallel ultra-high flow rate liquid chromatography with mass spectrometric detection using a multiplex electrospray source for direct, sensitive determination of pharmaceuticals in plasma at extremely high throughput. Rapid Commun. Mass Spectrom. 14: 2039–45 (2000).
303
Journal of Chromatographic Science, Vol. 45, July 2007
3. Y.F. Cheng, Z. Lu, and U. Neue. Ultrafast liquid chromatography/ ultraviolet and liquid chromatography/tandem mass spectrometric analysis. Rapid Commun. Mass Spectrom. 15: 141–51 (2001). 4. L. Romanyshyn and P. Tiller. Ultra-short columns and ballistic gradients: considerations for ultra-fast chromatographic liquid chromatographic–tandem mass spectrometric analysis. J. Chromatogr A 928: 41–51 (2001). 5. A. Murphy, M. Berna, J. Holsapple, and B. Ackermann. Effects of flow rate on high-throughput quantitative analysis of protein-precipitated plasma using liquid chromatography/tandem mass spectrometry. Rapid Commun. Mass Spectrom. 16: 537–43 (2002). 6. P. Kebarle and L. Tang. From ions in solution to ions in the gas phase—The mechanism of electrospray mass spectrometry. Anal. Chem. 65: 972A–86A (1993). 7. I. Halasz, R. Endele, and J. Asshauer. Ultimate limits in high-pressure liquid chromatography. J. Chromatogr. 112: 37–60 (1975). 8. A.D. Jerkovich, J.S. Mellors, and J.W. Jorgenson. The use of micrometer-sized particles in ultrahigh pressure liquid chromatography. LC. GC. N Am. 21: 600–610 (2003). 9. J.M. Cintron and L.A. Colon. Organo-silica nano-particles used in
304
10.
11.
12.
13. 14.
ultrahigh-pressure liquid chromatography. Analyst 127: 701–704 (2002). J. Castro-Perez, R. Plumb, J.H. Granger, I. Beattie, K. Joncour, and A. Wright. Increasing throughput and information content for in vitro drug metabolism experiments using ultra-performance liquid chromatography coupled to a quadrupole time-of-flight mass spectrometer. Rapid Commun. Mass Spectrom. 19: 843–48 (2005). R. Plumb, J. Castro-Perez, J.H. Granger, I. Beattie, K. Joncour, and A. Wright. Ultra-performance liquid chromatography coupled to quadrupole-orthogonal time-of-flight mass spectrometry. Rapid Commun. Mass Spectrom. 18: 2331–37 (2004). S.A.C Wren. Peak capacity in gradient ultra performance liquid chromatography (UPLC). J. Pharm. Biomed. Anal. 38: 337–43 (2005). A. Fandino and S. Schuette. Agilent Technologies Application Note, Publication Number 5989-1603EN (2004). Agilent Technologies. Personal communication. Manuscript received May 17, 2006; revision received December 1, 2006.