we focus on tidal variability in acoustic range and detection using data from a summer 2014 ... and tag/receiver pairs oriented alongshore have more detections.
2016 IEEE International Conferences on Big Data and Cloud Computing (BDCloud), Social Computing and Networking (SocialCom), Sustainable Computing and Communications (SustainCom)
Tidal Variability of Acoustic Detection Sungjin Cho, Fumin Zhang, Catherine Edwards
changed because of tidal influence. However, their results assume that detection range remains constant over a tidal cycle. More recent work using data from a static array of multiple receivers deployed near an acoustic Doppler current profiler (ADCP) that measured currents over multiple years suggests that detection rate and range may be dominated by environmental processes. While the annual cycle was found to be the largest control on successful detection, patterns in detection probability were noted at tidal, diurnal, and synoptic time scales [4]. Active acoustic communication such as long-base-line and ultra-short-base-line [6] employs information on time of arrival in order for accurately estimating distances between transmitters and receivers. By contrast, acoustic telemetry provides coarse measurements, detections and non detections, or, binary information of receivers with time stamps of detection and identity of transmitters. Underwater acoustic propagation can be modified by changes in sound speed, which depends on competing forces of density stratification and mixing around transmitters and receivers, and this information is not always measured as part of an acoustic array. Further, instrument performance and thus detection efficiency of receivers can be affected by natural environmental (temperature) and artificial factors (e.g., boat noise) [1]. Signal collision can be problematic for dense acoustic arrays. Signal collision occurs when two or more tags arrive at the receiver at the same time, but the receiver cannot simultaneously detect multiple tags, and no detections are recorded. Because the signals are both lost, it is difficult to assess the influence of signal collision in acoustic arrays, though it is possible to predict the probability of collision [7]. In this paper, we examine the variability of acoustic detections in an acoustic array installed on the inner shelf off Georgia, where the barotropic tide is amplified over the shelf [8]. Strong tidal currents on the order of 30-40 cm/s at this mesotidal site [9] allow the effect of tidal currents on acoustic telemetry data to be examined more thoroughly. Unlike other studies that simply place receivers for the highest probability of fish detection, we use data from an array specifically designed to examine the role of tides and other environmental variability on detection efficiency. Tidal variability is identified in the recorded data of receivers, and compared to measured flow direction and relative location of receiver/tag pairs. We organize the paper into the following sections: Section II describes the configuration of receivers and tags, and the measured data, including hourly detections, receivers with the highest signal collision, and detection variability. Section
Abstract— Acoustic telemetry is an essential tool for ecological and behavioral analysis of fish and marine mammals in fresh and sea water. However, the accuracy of acoustic telemetry is a challenging problem in that acoustic detection is affected by various environmental factors that govern sound speed and propagation: density, density stratification, mixing, and the environmental processes that control them. In this paper, we focus on tidal variability in acoustic range and detection using data from a summer 2014 experiment at Gray’s Reef National Marine Sanctuary in which an array of stationary receivers was deployed with co-located tags for 53 days. We assess the potential effect of signal collision, which occurs when multiple tag transmissions interfere and cannot be detected by the receiver, and find that signal collision may occur more frequently than predicted. Number of hourly detections at each receiver is found to vary significantly in space and in time, and tag/receiver pairs oriented alongshore have more detections than cross-shore pairs. The principal lunar component (M2 ), the tidal constituent that contributes the majority of current variance, is found to explain variability in detections. Maximum detections occur when currents are aligned with the semimajor axis (oriented cross-shore), while no strong directional correlation is found when detections are least likely. This result may give us clues about how important tidal variability can be in determining acoustic range relative to other processes that govern acoustic propagation. Better understanding of detection range and its variability in time can improve array design and data interpretation.
I. I NTRODUCTION Over several decades, acoustic telemetry has been used to monitor fish and marine mammals in freshwater and oceanic environments [1]. Acoustic telemetry uses acoustic receivers to monitor for the presence of fish tagged with transmitters attached to inside or outside skin of fish (depending on size), and records both time stamps of detection and identification numbers of transmitters. Ecological and behavioral analysis of telemetric data has revealed important new information about life cycles of marine species [2], [3]. However, the accuracy of telemetry is dependent on the detection range, or the maximum distance over which receivers are able to detect transmitters/tags. If detection range is unknown, telemetry does not inform scientists about where the detected animal fish is located. Moreover, detection range with spatial and temporal variability is affected by a great number of environmental factors such as density, density stratification, and mixing, which are mediated by wind, buoyancy input, and other effects [1], [4]. Previous studies have examined tidal influence on acoustic detection patterns. Authors in [5] use Fourier analysis of detection rate to show that fish have a tidal pattern in their movements by assuming that if fish are detected by more than one receiver within a tidal cycle, the fish’s position has 978-1-5090-3936-4/16 $31.00 © 2016 IEEE DOI 10.1109/BDCloud-SocialCom-SustainCom.2016.70
431
III presents tidal analysis of receivers. Section IV presents the phase analysis of receivers, and Section V provides conclusions.
three tags at 2.4 meters (surface), 8.5 meters (mid-depth), and 15 meters (bottom) depth. Using the acronyms S, M, and B that represent surface, mid-depth, and bottom depth, respectively, we index the tags by station number and vertical placement: 1S, 1M, 1B, 2M, 3S, 3M, 3B, 4M, 5S, 5M, 6M, 7S, 7M, 8M (see details in the caption of Figure 1). When the receiver’s omnidirectional hydrophone detects the transmitter, the receiver records time stamps of detection and identification number of the transmitter. Each surgicallyimplantable transmitter [15] is programmed to send one ping randomly in each 45-second interval at 69kHz with power output 147dB. Minimum delay and maximum delay for randomly pinging are zero and 90 seconds, respectively.
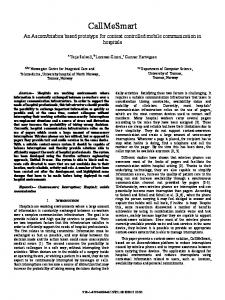
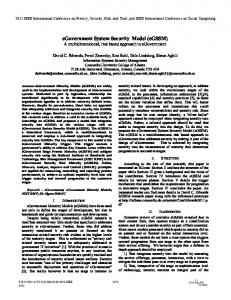
II. P ROBLEM F ORMULATION We seek to examine how tides may affect acoustic telemetry data. The following section first describes the acoustic array configuration and analysis of detection data as a function of hourly detections. The potential for signal collision is assessed, and the variability of the hourly detection data is described. A. Configuration of Receivers and Tags Eight Vemco VR2W receivers and 14 Vemco V13 tags were deployed in August 2014 in a static array at Gray’s Reef National Marine Sanctuary (GRNMS), located 40 nm SE of Savannah, GA. The area is designated for controlled scientific study on more than 200 species of fish by the US National Oceanic and Atmospheric Administration (NOAA). The placement of receivers and tags in the horizontal plane is shown in Figure 1; water depth is approximately 21m throughout the receiver array. The array was designed with receivers 400 meters apart, based on results from [4], which found that detection rate at 200 meters distance falls to a minimum during late summer 8% in August compared to 97% in February. An 600 kHz upward-looking acoustic Doppler current profiler (ADCP) [10] was moored approximately 1.1km away to remove the potential for interference between the ADCP and the acoustic array (Vemco, pers. comm.). GRNMS is located on the inner shelf of the South Atlantic Bight, which is characterized by strong tides; up to 8090% of the cross-shelf and 20-40% of the alongshelf current variance can be attributed to the barotropic tide [11]. At Gray’s Reef, the M2 tide accounts for much of this variance, with current magnitudes on the order of 30-40 cm/s [9], [12]. These strong tides act as a source for mixing through the bottom boundary layer, which occupies most or all of the water column [13]. During the 53-day deployment, summer stratification was weakened with the onset of “mariner’s fall”, the transition between summer conditions and strong northeasterly mean winds of September and October [14]. Figure 1 shows the array of receivers and tags installed at Gray’s Reef, with the station number indicated. The depth of each receiver is approximately 21 meters. We define two directions that represent the direction of combination of receivers and tags: alongshore direction and cross-shore direction. For instance, the pair of one tag in station 1 and one receiver in station 2 is aligned with the direction of cross shore, 27.3 degrees clockwise of east. The pair of one tag in station 1 and one receiver in station 4 is aligned with alongshore direction. The pairs of receivers laid on the northeastward direction have 27.3 inclination angle with respect to positive north direction. Receiver 3 is removed from this statistical analysis because of receiver malfunction. The number of tags are differently distributed according to station number and depth. Each station has from one to
Fig. 1. The two dimensional placement of receivers and tags: The origin of the figure is the center of the array, located 3.09-km ENE of the National Data Buoy Center (NDBC) buoy at Gray’s Reef (31.400N, 80.868W). The circle about each receiver reflects a nominal 200-m radius of detection during summer as observed by [4].
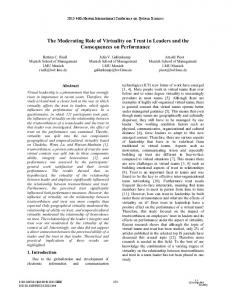
B. Hourly Detections Many studies [16], [17] have focused on detection probability, which is the ratio of the number of detections to the number of pings. Detection probability is a measure of the efficiency of detection with the relations of input and output for an acoustic channel that can be modeled by an acoustic sound propagation [17]. Estimating input by ping over each 45s interval with this configuration is not accurate and can lead to significant error of detection probability. Hourly detections computed by the number of detections over a longer interval (1 hr) is a more representative metric for detection efficiency. With one ping randomly each 45s, we expect a mean value of 80 pings per hour, and detection “rate” in any one hour interval is thus compared to the mean value of 80 hourly detections. Figure 2 shows the mean hourly detections at the receivers by tag. However, the maximum observed detections is less than 50 per hour, with only two receivers with hourly detections greater than 40. The proportion of measured hourly detections to the expected value of 80 serves as a proxy for detection probability. 432
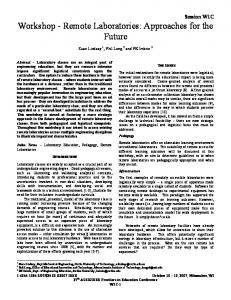
4M, receiver 4 and tag 1B, receiver 6 and tag 3S, receiver 6 and tag 3M, receiver 7 and tag 5M, receiver 8 and tag 2M. The direction of each of these pairs is aligned with alongshore direction in Figure 1, suggesting that the pairs parallel to alongshore direction have more detections than cross-shore direction. Standard deviation of hourly detections follows the same pattern. Most pairs aligned with alongshore direction have the second highest standard deviation of hourly detections. Further, the standard deviation of the pairs is fairly large, and is comparable to the mean value. This result motivates closer examination of the source of detection variability.
However, since the ratio is seldom larger than 50%, we look to signal collision as a potential cause for some of this loss. We find the receivers with the highest signal collision among eight receivers by comparing the mean hourly detections. We first focus on the diagonal, which shows the number of detections at tags that are co-located with the receivers. The distance between the receiver and the tag at the same station is minimum 6 meters and maximum 19 meters, shorter than any distance between the receiver at one station and the tag at the other station. Because detection probability is assumed to be highest over the shortest distance [1], we expect co-located tags and receivers to have the largest number of hourly detections.
Fig. 3. Mean hourly detections (on the left) and standard deviation of hourly detections (on the right)
III. T IDAL A NALYSIS We formulate our analysis of detections with respect to tidal currents, and will present comparison of detection range with respect to cross- and alongshore tidal variability. In particular, M2 , N2 , S2 , K2 , O1 , K1 , P1 , and Q1 are eight tidal constituents that explain 90% of the variance in measured depth-averaged flow. If the signal-to-noise ratio (SNR) of a tidal constituent is greater than and equals 1, the tidal constituent is significant in hourly detections. We choose eight combinations of receivers and tags in the configuration. Because acoustic sound propagation varies according to the range of receivers that detect tags, we pick tags 1M, 2M, 3M, 4M, and 5M installed at two-dimensional distance 400 meters and depth 8.5 meters from receivers 1, 4, 6, 7 and 8 to control for vertical range. The t tide Matlab toolbox [18] extracts harmonic fits to astronomical tidal frequencies given a scalar or vector time series. 35 tidal components are identified from the 53-day record of hourly detections. We choose these eight largest constituents of tidal current variability, summarized in Table 1, for joint analysis of signal detection. In addition to amplitude and phase, the t tide toolbox calculates SNR by the square of the ratio of amplitude to amplitude error at the 95% confidence level. SNR values for the eight major tidal constituents are given in Table I. Receiver/tag pairs are given in the notation defined in Section II. All eight major tidal constituents are represented with SNR>1 for the following pairs: receiver 4 and tag 1M, and receiver 1 and tag 4M. However, receiver 6 and tag 5M, receiver 4 and tag 5M, receiver 1 and tag 2M, receiver 7 and tag 5M, and receiver 8 and tag 2M have two or three constituents with SNR below 1. Receiver 6 and tag 3M contains seven of the eight but is not significant for O1 . We
Fig. 2. Mean hourly detections: The horizontal and vertical axes in the figure shows the index number of receivers and tags, respectively. The color bar represents mean values of hourly detections.
However, receiver 2 recorded fewer than 20 hourly detections of tag 2M. In contrast, receiver 8 has more hourly detections of tag 2M despite its distance of over 400m from the tag. In addition, the comparison of mean hourly detections of tag 5M shows that receiver 7, which is 400 meters away from tag 5M has more detections than receiver 5, which is 12 meters away from tag 5M. It is worth noting that the vertical position of the receiver and tags are different, and stratification may prevent clear transmission in the vertical. However, we assume that conditions are spatially invariant, and this loss is constant over the array. Because these receivers are centrally located within the array, we suspect that signal collision may contribute lower than expected hourly detections compared to other co-located receiver/tag pairs. Receivers 2 and 5 are located in the densest part of the array, with ten and seven tags within 400 meters distance, respectively. Signal collision probability of 70% is predicted by the metrics in [7]. We therefore remove these receivers from the subsequent analysis. C. Detection Variability We next examine variability of hourly detections over time. Figure 3 shows mean and standard deviation of hourly detections about the pairs of five receivers and 14 tags. When we ignore co-located receiver/tag pairs, the largest number of mean hourly detections is found between receiver 1 and tag 433
TABLE I S IGNAL TO NOISE RATIO OF TIDAL CONSTITUENTS †
and receiver, may be reduced or increased when the current is in the direction of the receiver or opposes it. Figure 5 Tidal R6,5M R6,3M R4,5M R4,1M R1,2M R1,4M R7,5M R8,2M shows shore direction and the direction of acoustic signal M2 5.2 23 1.5 34 1.2 16 0.15 0.71 path at maximum hourly detections. N2 S2 K2 O1 K1 P1 Q1
4.5 0.74 6.2 14 10 8.8 0.81
4.1 1.4 5.7 0.62 23 9.9 3.4
0.24 1.7 0.87 0.35 7.7 6.6 4.2
3.7 4.9 14 1.74 1 9.2 2
0.91 10 17 1.4 0.78 5.3 0.049
1.8 1.6 12 2 1.4 2.4 3.1
1.7 2.5 2 3.2 24 24 0.4
0.26 34 59 1.4 17 8.5 1.6
† Values of SNR >1 are given in bold
focus on the M2 tidal constituent, which explains approximately 80% of the measured current variance at GRNMS. All combinations but R7,5M and R8,2M are significant for the M2 tidal constituent. Thus, we remove the last two columns of the table to choose six pairs to analyze the relationship between flow direction and hourly detections. Fig. 5.
Direction of acoustic signal path at maximum hourly detections
The ADCP data are processed to eliminate invalid data in the upper water column, depth-averaged, and decomposed into along- and cross-shore components. Assuming that flow does not vary significantly over the array and the 1.1km distance to the ADCP, we compare the time series of hourly detections between the receiver/tag pair to the along- or cross-shore component of flow from tag to receiver. A time series of maxima and minima taken over each successive tidal period is compiled from detection data, and the direction of flow at the maxima and minima can be examined to see if there is a consistent relationship between detection probability and tidal phase.
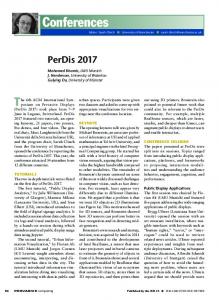
Fig. 4. SNR on the configuration: The direction of each arrow represents the direction of the tag toward the receiver. The length of each arrow represent the magnitude of SNR. Alongshore pairs have much stronger SNR than cross-shore pairs
Figure 4 shows that the highest SNR at the M2 frequency is found between transmitter/receiver pairs that are oriented alongshore. SNR is greater than 15 between R4,1M, R6,3M, and R1,4M but much lower between the cross-shore pairs. In addition, the variability in section II.C shows receiver-tag pairs aligned with alongshore direction tend to have higher mean and standard deviation of hourly detections than crossshore direction, overall, not just at specific tidal frequency. The dominant tidal frequency M2 is strong in high hourly detections, suggesting that the fluctuation of hourly detections is significantly related to tidal flows. These spatial patterns of tidal variability suggests that the shape of detection range is not uniform, but rather changes significantly in space and time.
Fig. 6. Maximum (left) and minimum (right) hourly detections, taken over each successive M2 tidal cycle, for three receiver-tag pairs oriented alongshore.
Figure 6 shows maximum and minimum hourly detections for each successive 12.42-hour interval. In the left panel of Figure 6, maximum hourly detections at all three receiver/tag pairs are consistent, with a relative jump in detections around August 24th, and a slow increase over the deployment period that may reflect cooling and loss of stratification in the transition into early fall. There is no obvious spring/neap cycle in the detection data. In contrast, the right panel shows that minimum hourly detections are more variable among the receiver/tag pairs and overall. For example, there are no detections of tag 4M at receiver 1 for much of mid-to late September, while minimum detection levels of tag 3M
IV. F LOW DIRECTION In this section, we identify the relationship between hourly detections and flow direction. In the previous section, we show that time series of hourly detections of pairs oriented in the alongshore direction contain significant tidal variability at the M2 frequency. To investigate the relationship between direction of tidal currents and detection probability further, we consider the time series of hourly detections and the current aligned with the receiver/tag pair. The acoustic signal path length, or the distance sound must travel between the tag 434
at receiver 6 are much higher, and only 50% lower than the maximum levels, a trend that is not seen in other time series.
and increased detection probability is not related to the acoustic path but rather the phase of the tide. M2 tidal ellipse orientation is cross-shore at Gray’s Reef, so offshore or onshore flow is associated with the largest tidal current magnitude. When tidal flow is stronger, the height of the bottom boundary layer can extend higher into the water column [19], [20], which can lead to a tidal asymmetry in mixing and stratification. Since acoustic propagation is improved under well-mixed conditions, this mechanism may explain why maximum hourly detections are associated with cross-shore flow along the M2 semi-major axis. The relative shallow depth at Gray’s Reef (21-m) makes it likely that the frictional boundary layer extends through most or all of the water column, and that tidal variation in mixing can affect stratification in the mid- or upper layers. The reverse relationship does not appear to hold. In other words, alongshore flow along the M2 semi-minor axis is not associated with reduced detections. The tag/receiver pairs in Figures 7, 8, and 9 are all oriented alongshore, so the potential effect of acoustic path is not likely.
Fig. 7. Phase of flow with respect to the direction of receiver 6 from tag 3M at maximum hourly detections (left) and at minimum hourly detections (right). Angle is given in degrees CW of the reference angle (negative alongshore, NNE); phases of 90 and 270 degrees correspond to offshore/positive and onshore/negative cross-shore flow, respectively.
V. C ONCLUSION In this paper, we examine the relationship between tidal flow and detections measured in an acoustic array of colocated tags and receivers on the inner shelf at Gray’s Reef National Marine Sanctuary. We find the receivers with the highest signal collision by comparing mean hourly detections at neighboring receivers, and conclude that signal collision is occurs more frequently than predicted. From the selected receivers with relatively less signal collision, we show that mean hourly detections of receivers varies with direction of the pair of the receiver and the tag. Receiver/tag pairs oriented alongshore record a greater number of detections than pairs along the cross-shore axis, and tides are found to explain a significant portion of the variability in detection probability. The M2 tide is found to represent approximately 80% of the variance of flow, and is found to be significant in time series of hourly detection data. Time series of maximum and minimum hourly detection rates taken over successive M2 tidal periods over the 53day deployment suggest that while maxima of hourly detections are fairly consistent among the three receiver/tag pairs studied, the minima are much more variable. This pattern is repeated in phase analysis of the hourly detection data with respect to depth-averaged flow. Maximum detections over the M2 tide are strongly associated with strongest flow oriented cross-shore, and suggests that changes in mixing on tidal time scales affects acoustic propagation. These results suggest that detection ranges of equipment commonly used in acoustic telemetry are not uniform either in space or in time. It is not clear why cross-shore pairs are more likely to receive tag transmissions than alongshore pairs placed at similar distance, but signal collision at the densest part of the array prevents direct comparison. As found in previous work [4], detection rate varies at tidal and non-tidal time scales. The M2 tide explains the majority of the current variance and is explored here, but there are clear indications
Fig. 8. Phase of flow with respect to the direction of receiver 4 from tag 1M at maximum hourly detections (left) and at minimum hourly detections (right). Angle is given in degrees CW of the reference angle (negative alongshore, NNE); phases of 90 and 270 degrees correspond to offshore/positive and onshore/negative cross-shore flow, respectively.
Fig. 9. Phase of flow with respect to the direction of receiver 1 from tag 4M at maximum hourly detections (left) and at minimum hourly detections (right). Angle is given in degrees CW of the reference angle (positive alongshore, SSW); phases of 90 and 270 correspond to onshore/negative and offshore/positive cross-shore flow, respectively.
Figures 7, 8, 9 show the distribution of flow at the time of maximum and minimum detection for alongshore pairs selected from SNR analysis in Section III. Phase of flow is given with respect to the reference angle, in the direction of acoustic path from the tag to the receiver, and is positive clockwise. The distributions in the left panels are bimodal, with strong maxima at 90 or 270 degrees; these angles represent the cross-shore direction. In contrast, the right panels showing phase angle with time of minimum detections are more evenly distributed over the full range of angles. This result suggests that the relationship between flow direction 435
of synoptic and seasonal changes through the deployment from late summer to early fall, and variance at K1 and P1 may indicate diurnal variability. Future work will examine these broader temporal patterns, and incorporate wind, wave, and density data from a nearby buoy and a section of glider data so that stronger statements can be made about the interaction of tides, stratification, mixing, and their effect on acoustic propagation over the deployment. The identified patterns of detection and tidal flow can help improve the accuracy of detection range of receivers. Detection range may be more accurately estimated by incorporating a flow model and developed channel model of underwater acoustic communication. Tidal flow can be predicted with well-established tidal flow models [21] or full 3-D ocean circulation models that will help understand how important tidal flow is relative to total flow. This fuller analysis will enable interpretation of in situ hourly detections given variability of range, which may allow better understanding of animal behavior. For future work, we will incorporate developed acoustic channel model and tidal flow model for accurately estimating the detection range of receivers. These types of enhanced estimates of detection range can assist in interpretation of data from acoustic telemetry, and improve design and function of acoustic arrays for a range of applications.
[8] A. C. Redfield, “The analysis of tidal phenomena in narrow embayments.” Papers in Physical Oceanography and Meteorology, 1950. [9] H. E. Seim and C. R. Edwards, “Comparison of buoy-mounted and bottom-moored ADCP performance at gray’s reef,” J. Ocean. Atmos. Tech., vol. 24, pp. 270–284, 2007. [10] W. R. Geyer and R. Signell, “Measurements of tidal flow around a headland with a shipboard acoustic Doppler current profiler,” Journal of Geophysical Research, vol. 95, no. 3, pp. 3189–3197, 1990. [11] T. Lee and D. Brooks, “Initial observations of current, temperature, and coastal sea level response to atmospheric and Gulf Stream forcing,” GRL, vol. 6, pp. 321–324, 1979. [12] B. Blanton, F. Werner, H. Seim, R. Luettich, D. Lynch, K. Smith, G. Vougaris, F. Bingham, and F. Way, “Barotropic tides in the South Atlantic Bight,” JGR, vol. 109, pp. C12 024, doi:10.1029/2004JC002 455, 2004. [13] C. Edwards and H. Seim, “Complex EOF analysis as a method to separate barotropic and baroclinic,” JTech, vol. 25, pp. 808–821, 2008. [14] A. Weber and J. Blanton, “Monthly mean wind fields for the South Atlantic Bight,” JPO, vol. 10, pp. 1256–1263, 1980. [15] J. Finn, J. Brownscombe, C. Haak, S. Cooke, R. Cormier, T. Gagne, and A. Danylchuk, “Applying network methods to acoustic telemetry data: Modeling the movements of tropical marine fishes,” Ecological Modelling, vol. 293, pp. 139–149, 2014. [16] M. C. Melnychuk and C. J. Walters, “Estimating detection probabilities of tagged fish migrating past fixed receiver stations using only local information,” Canadian Journal of Fisheries and Aquatic Sciences, vol. 67, no. 4, pp. 641–658, 2010. [17] K. Ø. Gjelland and R. D. Hedger, “Environmental influence on transmitter detection probability in biotelemetry: developing a general model of acoustic transmission,” Methods in Ecology and Evolution, vol. 4, pp. 665–674, 2013. [18] R. Pawlowicz, B. Beardsley, and S. Lentz, “Classical tidal harmonic analysis including error estimates in matlab using T TIDE,” Computers and Geosciences, vol. 28, no. 8, pp. 929–937, 2002. [19] R. Soulsby, “Tidal-current boundary layers,” in The Sea: Ocean engineering science, B. Mehaute and D. Hanes, Eds., vol. 9. WileyInterscience, 1990, pp. 523–566. [20] G. Weatherly, S. Blumsack, and A. Bird, “On the effect of diurnal tidal currents in determining the thickeness of the turbulent Ekman bottom boundary layer,” JPO, vol. 10, pp. 297–300, 1980. [21] J. R. A .Luettich, J. J. Westerink, and N. W. Scheffner, “ADCIRC: An advanced three-dimensional circulation model for shelves, coasts, and estuaries,” US Army Cops of Engineers Washington, DC 20314–1000, Tech. Rep. DRP–92–6, 1992.
VI. ACKNOWLEDGMENTS The authors wish to thank Gray’s Reef National Marine Sanctuary Superintendent Sarah Fangman and staff for for ship and dive support of field operations. This research is supported by ONR grants N00014-14-1-0635, N00014-161-2667; NSF grants IIS-1319874, CMMI-1436284, CNS0931576, OCE-1032285, OCE-1559475; and NOAA award NA16NOS0120028. R EFERENCES [1] S. T. Kessel, S. J. Cooke, M. R. Heupel, N. E. Hussey, C. A. Simpfendorfer, S. Vagle, and A. T. Fisk, “A review of detection range testing in aquatic passive acoustic telemetry studies,” Reviews in Fish Biology and Fisheries, vol. 24, no. 1, pp. 199–218, 2014. [2] S. E. M. Munroe, C. A. Simpfendorfer, and M. R. Heupel, “Variation in blacktip shark movement patterns in a tropical coastal bay,” Environmental Biology of Fishes, vol. 99, no. 4, pp. 377–389, 2016. [3] S. C. Riley, T. R. Binder, N. J. Wattrus, M. D. Faust, J. Janssen, J. Menzies, J. E. Marsden, M. P. Ebener, C. R. Bronte, J. X. He, T. R. Tucker, M. J. Hansen, H. T. Thompson, A. M. Muir, and C. C. Krueger, “Lake trout in northern Lake Huron spawn on submerged drumlins,” Journal of Great Lakes Research, vol. 40, pp. 415–420, 2014. [4] N. H. Mathies, M. B. Ogburn, G. McFall, and S. Fangman, “Environmental interference factors affecting detection range in acoustic telemetry studies using fixed receiver arrays,” Marine Ecology Progress Series, vol. 495, pp. 27–38, 2014. [5] R. Sakabe and J. M. Lyle, “The influence of tidal cycles and freshwater inflow on the distribution and movement of an estuarine resident fish Acanthopagrus butcheri,” Journal of Fish Biology, vol. 77, pp. 643– 660, 2010. [6] L. Paull, S. Saeedi, M. Seto, and H. Li, “AUV navigation and localization: A review,” IEEE Journal of Ocean Engineering, vol. 39, no. 1, pp. 131–149, 2014. [7] T. R. Binder, C. M. Holbrook, T. A. Hayden, and C. C. Krueger, “Spatial and temporal variation in positioning probability of acoustic telemetry arrays: fine-scale variability and complex interactions,” Animal Biotelemetry, vol. 4, no. 4, pp. 1–15, 2016.
436