266
SHORT REPORT
Time course of wallerian degeneration after ischaemic stroke revealed by diffusion tensor imaging G Thomalla, V Glauche, C Weiller, J Ro¨ther ............................................................................................................................... See Editorial Commentary, page 159
J Neurol Neurosurg Psychiatry 2005;76:266–268. doi: 10.1136/jnnp.2004.046375
Wallerian degeneration (WD) after ischaemic stroke is a well known phenomenon following a stereotypical time course. Whereas conventional magnetic resonance imaging fails to detect signal intensity changes until four weeks after stroke, diffusion tensor imaging (DTI) reveals changes related to WD only after days. DTI was used to monitor the time course of Wallerian degeneration of the pyramidal tract from the early subacute to the late chronic stage of ischaemic stroke in two patients. A progressive decrease of fractional anisotropy was found along the pyramidal tract in the cerebral peduncle below the primary lesion resulting from progressive changes in the principal diffusivities, as well as a slight increase in the orientationally averaged diffusivity in the chronic phase. These signal changes reflect the progressive disintegration of fibre structures resulting from WD.
W
allerian degeneration (WD) of descending fibre tracts after ischaemic stroke is a well known phenomenon reflecting severe fibre tract damage. WD represents a uniform answer to injury within the central and peripheral nervous systems, and disintegration of axonal structures within the first days after injury is followed by infiltration of macrophages, degradation of myelin after several weeks, and finally, fibrosis and atrophy of the affected fibre tracts.1 2 After ischaemic stroke it usually takes two to four weeks before WD can be detected by conventional magnetic resonance imaging (MRI), where the main pathological finding is a hyperintensity on T2-weighted images along the affected tracts in the chronic stage, weeks to months after stroke.3 Recently, diffusion tensor imaging (DTI) has opened up new possibilities of imaging fibre tracts in the brain by estimation of the whole diffusion tensor—which provides information on the predominant direction and degree of water diffusion and thus allows conclusions to be drawn about the microstructural properties of tissue.4 The degree of anisotropy of diffusion reflects the integrity and the degree of organisation of the fibre tracts within the brain.5 DTI has been used to study WD in the chronic stage of stroke and it has been shown that fractional anisotropy (FA) was reduced along the pyramidal tract on the affected side below the primary lesion months to years after stroke.6 7 In a previous study, we used DTI to study early WD of the pyramidal tract after acute ischaemic stroke. We found decreases in FA and characteristic changes in the principal diffusivities (eigenvalues), reflecting early WD in the cerebral peduncle of the affected side as early as 2–16 days after ischaemic stroke; at the same time T2-weighted images and maps of the orientationally averaged diffusivity did not reveal obvious changes.8 No longitudinal DTI studies of WD have been published. Here we report the findings from diffusion tensor images
www.jnnp.com
obtained for two of our patients at three different time points during the time course from the early subacute to the chronic stage of stroke.
METHODS Magnetic resonance images were acquired on a 1.5 Tesla MR system (Magnetom Vision, Siemens, Erlangen/Germany). A high resolution T1-weighted image data set (voxel size 16161 mm) was acquired. For DTI we used a single shot STEAM sequence9 with matrix size 56664, field of view 1926192 mm, slice thickness 3 mm without interslice gap, and voxel size 36363 mm. Diffusion sensitising gradients (b = 750 s/mm2) were applied along six directions, and one image without diffusion weighting (b = 0 s/mm2) was obtained. The diffusion tensor (D) for each voxel was calculated, and maps of eigenvalues, averaged diffusivity (Dav), and FA were generated4 using SPM99 in Matlab 5.3 (The MathWorks, Natick, MA). Three dimensional regions of interest (ROIs) were manually defined for each side covering the medial anterior cerebral peduncle between the hypothalamus and the pons. Eigenvalues (l1, l2, l3), FA, and Dav were calculated within the ROI, and ratios between values of the affected and unaffected side were determined (rl1, rl2, rl3, rFA, rDav). Details of the MRI protocol and postprocessing have been reported elsewhere.8
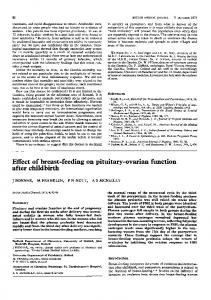
RESULTS Two patients with striatocapsular infarction were examined at three time points after stroke (case 1: 12, 104, and 288 days after stroke; and case 2: 5, 35, and 92 days after stroke). DTI revealed a clear pattern of progressive structural changes, which corresponded well with histological findings on the temporal evolution of WD and with DTI findings of WD in the chronic stage after stroke as described above. In both patients the rFA decreased continuously (from 0.84 to 0.75 and from 0.83 to 0.62) and the rDav increased slightly (from 0.98 to 1.11 and from 0.96 to 1.02). Ratios for the second (rl2) and third (rl3) eigenvalues markedly increased over time in both patients (rl2: from 1.07 to 1.29 and from 1.02 to 1.10; rl3: from 1.05 to 1.27 and from 1.06 to 1.28). An example of progressive FA decrease along the pyramidal tract below the primary lesion over time is shown in fig 1. Corresponding structural changes are clearly visible on the coregistered high resolution T1-weighted image in the late chronic stage, where a hypointensity resulting from degeneration of descending tracts in the mediolateral cerebral peduncle is easily identified.
DISCUSSION We longitudinally studied the course of WD in two patients by DTI and found a pattern of progressive structural degeneration which corresponds well to findings from Abbreviations: Dav, averaged diffusivity; DTI, diffusion tensor imaging; FA, fractional anisotropy; WD, wallerian degeneration
DTI reveals time course of wallerian degeneration after stroke
267
Figure 1 Time course of wallerian degeneration (WD). A slight decrease in fractional anisotropy (FA) was found along the affected pyramidal tract below the lesion 12 days after stroke on coronal as well as on transverse sections at the level of the cerebral peduncle. The decrease in FA became more pronounced after 104 and 288 days (small white arrows). On the T1-weighted (T1-w) images the area of the primary lesion shows the typical progression from a slight hypointensity in subacute infarction to a well defined structural defect in the chronic stage (large black arrows). Although after 12 days no pathological signal changes along the pyramidal tract were found, after 104 days, and even more definitely after 288 days, a clear hypointensity became visible along the descending pyramidal tract (small black arrows) representing typical signal alterations found in the chronic stage of WD. Transverse sections through the cerebral peduncle reveal limiting of WD to lateral parts of the pyramidal tract on both T1-w and FA images at days 104 and 288.
experimental studies of WD. From these studies we know that anisotropy of diffusion in white matter mainly results from oriented membranes, such as axonal structures and myelin.5 Disintegration of axonal structures and myelin, as occurs in WD, results in loss of anisotropy, which is detected by DTI.5 Signal changes resulting from WD after ischaemic stroke have been detected by DTI in the early subacute stage8 as well as in chronic stroke.6 7 Structural changes in WD evolve over time with progressive destruction of fibre structures followed by gliosis.1 2 We found progressive loss of anisotropy resulting from reduced first eigenvalue and increased second and third eigenvalues. We interpret these changes as a reflection of the progressive structural alterations resulting from WD. Moreover, although in the early subacute stage no clear changes of the orientationally averaged diffusivity can be detected,8 in the chronic stage, with progression of structural degradation due to WD, an increase in the Dav becomes obvious. The findings of the present report have to be interpreted with caution as they are based on only two cases. In previous DTI studies, a 15% decrease in FA was found in the cerebral peduncle two to six months after stroke in one study,6 and a 32% decrease in FA was found in the cerebral peduncle below the lesion in patients more than one year after stroke in another study.7 Although these findings are from different populations in different studies, they also appear to indicate a pattern of more pronounced loss of FA at later time points after stroke. In any case, the extent of WD after stroke may vary over a wide range in different patients, depending on the extent of the primary lesion and its location in relation to the affected fibre tracts. In our two patients the decrease in FA advanced from 16% to 25% in case 1 and from 17% to 48% in case 2, during a time course covering more than nine months and three months, respectively.
WD of the pyramidal tract after ischaemic stroke is known to reflect severe pyramidal tract damage associated with persisting impairment of motor functions.10 11 In patients with ischaemic stroke and motor impairment, the degree of WD of the pyramidal tract has been shown to be correlated to motor scales at different time points.8 In both our patients the DTI findings of a typical pattern of progressive WD were associated with persisting moderate to severe hemiparesis. DTI allows evaluation of the time course of WD from the early subacute to the chronic stage. The findings on imaging reflect the different stages of WD that are well known from experimental and histological studies. Thus, DTI offers a way to detect and monitor the time course of severe degeneration of the pyramidal tract and may be a helpful tool in forecasting and monitoring recovery in patients with ischaemic stroke. .....................
Authors’ affiliations
G Thomalla, V Glauche, C Weiller, J Ro¨ther, Neuroimage Nord, Klinik und Poliklinik fu¨r Neurologie, Universita ¨ tsklinikum Hamburg-Eppendorf, Hamburg, Germany Competing interests: none declared Correspondence to: G Thomalla, Klinik und Poliklinik fu¨r Neurologie, Universita ¨ tsklinikum Hamburg-Eppendorf, Martinistraße 52, D-20246 Hamburg, Germany;
[email protected] Received 26 May 2004 In revised form 4 July 2004 Accepted 8 July 2004
REFERENCES 1 Johnson AC, McNabb AR, Rossiter RJ. Chemistry of wallerian degeneration. A review of recent studies. Arch Neurol Psychiat 1950;64:105–21. 2 Lampert PW, Cressman MR. Fine-structural changes of myelin sheaths after axonal degeneration in the spinal cord of rats. Am J Pathol 1966;49:1139–55.
www.jnnp.com
268
3 Kuhn MJ, Mikulis DJ, Ayoub DM, et al. Wallerian degeneration after cerebral infarction: evaluation with sequential MR imaging. Radiology 1989;172:179–82. 4 Basser PJ, Pierpaoli C. Microstructural and physiological features of tissues elucidated by quantitative-diffusion-tensor MRI. J Magn Reson B 1996;111:209–19. 5 Beaulieu C. The basis of anisotropic water diffusion in the nervous system—a technical review. NMR Biomed 2002;15:435–55. 6 Werring DJ, Toosy AT, Clark CA, et al. Diffusion tensor imaging can detect and quantify corticospinal tract degeneration after stroke. J Neurol Neurosurg Psychiatry 2000;69:269–72. 7 Pierpaoli C, Barnett A, Pajevic S, et al. Water diffusion changes in Wallerian degeneration and their dependence on white matter architecture. Neuroimage 2001;13:1174–85.
Thomalla, Glauche, Weiller, et al
8 Thomalla G, Glauche V, Koch MA, et al. Diffusion tensor imaging detects early Wallerian degeneration of the pyramidal tract after ischemic stroke. NeuroImage 2004;(in press). 9 Nolte UG, Finsterbusch J, Frahm J. Rapid isotropic diffusion mapping without susceptibility artifacts: whole brain studies using diffusion-weighted single-shot STEAM MR imaging. Magn Reson Med 2000;44:731–6. 10 Binkofski F, Seitz RJ, Arnold S, et al. Thalamic metabolism and corticospinal tract integrity determine motor recovery in stroke. Ann Neurol 1996;39:460–70. 11 Watanabe T, Honda Y, Fujii Y, et al. Three-dimensional anisotropy contrast magnetic resonance axonography to predict the prognosis for motor function in patients suffering from stroke. J Neurosurg 2001;94:955–60.
NEUROLOGICAL PICTURE . . . . . . . . . . . . . . . . . . . . . . . . . . . . . . . . . . . . . . . . . . . . . . . . . . . . . . . . . . . . . . . . . . . . . . . . . . . . . doi: 10.1136/jnnp.2003.034371
Checkerboard fields in multiple sclerosis
A
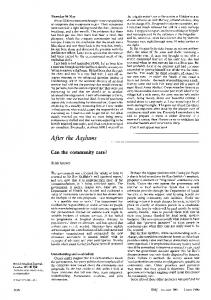
43 year old previously healthy woman presented with headache and blurred vision. Visual acuity was 20/30 in both eyes, with normal colour vision, pupil, and funduscopic examinations. Computerised threshold perimetry (fig 1) revealed a left superior and right inferior homonymous quadrantanopia. Magnetic resonance imaging (MRI) of the brain demonstrated high signal abnormality in the right temporal and left parieto-occipital lobes (fig 2). A diagnosis of multiple sclerosis (MS) was established when the patient developed recurrent neurologic dysfunction. Crossed quadrant hemianopias are rare field defects that are usually secondary to ischaemia and are typically attributed to bilateral injury to the calcarine fissure. Such defects are uncommon since bilateral quadrantopias secondary to vascular disease are usually either both superior or inferior, owing to watershed ischaemia or embolic disease. From 1891 to 1994 only nine cases with crossed quadrant field defects were reported worldwide and no-one suffered from MS.1 In 1995, the first report of crossed quadrant hemianopia occurring in a patient with clinically definite MS was documented to be secondary to lesions in the trigone areas bilaterally.2 We are not aware of any further reports of checkerboard field defects since 1995. In our patient, crossedquadrant field defects resulted from bilateral lesions in the optic radiations. The demyelinating lesion in the right temporal lobe produced the left superior quadrantanopia, while the lesion in the left parietal area produced the right inferior quadrantanopia. Furthermore, our patient demonstrates that a crossed quadrant field defect may rarely occur as an initial manifestation of MS. Symptomatic homonymous field defects in MS are uncommon, and may be related to the large retrochiasmal
Figure 2 Axial sections of brain MRI. Fluid attenuation inversion recovery [FLAIR] images demonstrate high signal abnormality (arrows) in the right temporal region and left parieto-occipital area, which account for the corresponding field defects.
lesions required to produce them and the tendency for rapid recovery in the vast majority of cases. Another factor that may limit the occurrence of homonymous field defects in MS is the tendency for lesions to occur along venules and nonfibre tracts.3 The chances of a checkerboard field defect appearing in MS are reduced by: (1) the rarity of the homonymous defects in this condition; (2) the necessity for bilateral field defects; (3) the occurrence of quadrantanopic defects rather hemianopic ones; and (4) the need to have one lesion above and one lesion below the representation of the horizontal meridian. M A Tamhankar, C E Markowitz, S L Galetta Division of Neuro-Ophthalmology, Departments of Neurology and Ophthalmology, University of Pennsylvania School of Medicine, Philadelphia, Pennsylvania, USA
Correspondence to: Steven L Galetta, Department of Neurology, 3 West Gates, 3400 Spruce Street, Philadelphia, PA 19104;
[email protected]. upenn.edu
References
Figure 1 Humphrey visual fields [30-2] demonstrate a left superior and right inferior quadrantanopia consistent with a crossed quadrant pattern of field defects.
www.jnnp.com
1 Cross SA, Smith JL. Crossed-quadrant homonymous hemianopia. The ‘checkerboard’ field defect. J Clin Neurol Ophthalmol 1982;2:149–158. 2 Cesareo M, Pozzilli C, Ristori G, et al. Crossed quadrant homonymous hemianopia in a case of multiple sclerosis. Clin Neurol Neurosurg 1995;97:324–27. 3 Plant GT, Kermode AG, Turano G, et al. Symptomatic retrochiasmal lesions in multiple sclerosis: Clinical features, visual evoked potentials, and magnetic resonance imaging. Neurology 1992;42:68–76.