energies Article
Time Effect of Water Injection on the Mechanical Properties of Coal and Its Application in Rockburst Prevention in Mining Xiaofei Liu 1,2, *, Guang Xu 3 , Chong Zhang 1,2 , Biao Kong 2 , Jifa Qian 1 , Dong Zhu 2 and Mingyao Wei 4 1 2 3 4
*
Key Laboratory of Gas and Fire Control for Coal Mines (China University of Mining and Technology), Ministry of Education, Xuzhou 221116, China;
[email protected] (C.Z.);
[email protected] (J.Q.) School of Safety Engineering, China University of Mining and Technology, Xuzhou 221116, China;
[email protected] (B.K.);
[email protected] (D.Z.) Department of Mining Engineering and Metallurgical Engineering, Western Australian School of Mines, Curtin University, Kalgoorlie, WA 6430, Australia;
[email protected] Institute of Rock and Soil Mechanic, Chinese Academy of Sciences, Wuhan 430071, China;
[email protected] Correspondence:
[email protected]; Tel.: +86-516-8388-4695
Received: 4 September 2017; Accepted: 31 October 2017; Published: 6 November 2017
Abstract: Coal seam water injection is widely used to prevent rockbursts in coal mines, and the duration of water injection is an important parameter related to the effectiveness of rockburst prevention, making it of practical importance to optimize the effective water injection duration. This paper presents the test results of the mechanical properties and pore structure of samples with different soaking time, obtained from a working face where rockburst occurred. Soaking time changes the mechanical properties of samples, and this time effect differs with the coal size (from centimeter to nanometer size). Results of numerical simulation and on-site tests in the Changgouyu coal mine demonstrated that water injection can effectively soften coal bodies and release or transfer stresses, and the time effect of water injection on rock prevention and control is apparent. Keywords: coal seam water injection; rockburst; soaking test; porosity; numerical simulation; on-site test; time effect
1. Introduction Coal mine rockbursts in a coal mine are nonlinear dynamic processes. They start with the deformation of coal and rocks caused by mining. Such deformations steadily accumulate energy, and eventually the energy is released suddenly [1,2]. With the increase of mining depth and production, dynamical disasters in coal mines are becoming more serious and frequent, and their intensity is growing, which seriously threatens mining safety [3,4]. Mining optimization design [5,6], regional hazard prevention [7,8], supporting intensity increases or support pattern improvements [9,10] can be used to prevent and control rockbursts in coal mines. The regional hazard prevention method is widely used to prevent rockbursts to eliminate high stress concentrations and weaken the elastic energy accumulation through modifying the properties of coal and rocks. Such methods include coal seam blasting [11], coal seam water injection [12], drill hole pressure relief [13] and directional hydraulic water fracturing [14]. Coal seam water injection can change the bursting liability of coal or rock and reduce or eliminate rockburst disasters in the mining field. It is characterized by a simple operation process, small investment and other favorable features [15]. At present, it is widely used to prevent and control rockburst disasters in China [16,17]. The bursting liability of coal seams is closely related Energies 2017, 10, 1783; doi:10.3390/en10111783
www.mdpi.com/journal/energies
Energies Energies 2017, 2017, 10, 10, 1783 1783
22 of of 26 26
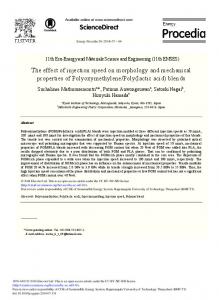
their water content [18], and the structure and mechanical properties of coal will be changed by the to their water content [18], and the structure and mechanical properties of coal will be changed physical-chemical function of water. As the water content of coal increases, the uniaxial compressive by the physical-chemical function of water. As the water content of coal increases, the uniaxial strength, peak stress in the stress-strain curve and E of coal decrease and the Poisson’s ratio increases compressive strength, peak stress in the stress-strain curve and E of coal decrease and the Poisson’s [19,20]. The bursting liability of coal weakens with the increase of soak time [21]. The coal seam water ratio increases [19,20]. The bursting liability of coal weakens with the increase of soak time [21]. injection method is widely applied on site, but it is not necessarily effective in all situations. The The coal seam water injection method is widely applied on site, but it is not necessarily effective in properties of coal and rock [22] and the parameters of water injection, including the hole spacing, all situations. The properties of coal and rock [22] and the parameters of water injection, including water flooding pressure and other factors, can affect its effectiveness. In fact, there is a time effect for the hole spacing, water flooding pressure and other factors, can affect its effectiveness. In fact, there coal seam water injection. The structure and mechanical properties of coal show obviously is a time effect for coal seam water injection. The structure and mechanical properties of coal show differences after different soak times. As soak time increases, those differences become more obviously differences after different soak times. As soak time increases, those differences become apparent. Therefore, the time effect of coal seam water injection is of significant importance in its more apparent. Therefore, the time effect of coal seam water injection is of significant importance parameter design and effectiveness evaluation. The above researches focused on the mechanic in its parameter design and effectiveness evaluation. The above researches focused on the mechanic mechanism of water injection into coal on a macro scale (from centimeter to meter size), but there is mechanism of water injection into coal on a macro scale (from centimeter to meter size), but there little research related to this matter on the micro scale. The scanning electron microscope (SEM) is little research related to this matter on the micro scale. The scanning electron microscope (SEM) technology [23] and the porosity testing technology are helpful to analyze the mechanics mechanism technology [23] and the porosity testing technology are helpful to analyze the mechanics mechanism on the micro scale of water injection into coal. on the micro scale of water injection into coal. In order to explore the time effect mechanism of water on different sizes of coal (from meter to In order to explore the time effect mechanism of water on different sizes of coal (from meter to nanometer size), our study conducted experiments and analyzed the changing law of coal nanometer size), our study conducted experiments and analyzed the changing law of coal compressive compressive strength, Protodyakonov coefficient, porosity and microstructure of coal samples. By strength, Protodyakonov coefficient, porosity and microstructure of coal samples. By using FLAC-3D, using FLAC-3D, the effect of water injection duration on the effectiveness of rockburst elimination the effect of water injection duration on the effectiveness of rockburst elimination was studied. Based was studied. Based on on-site conditions, an optimized scheme with appropriate parameters was on on-site conditions, an optimized scheme with appropriate parameters was proposed to implement proposed to implement the coal seam water injection method. the coal seam water injection method. 2. Experimental Preparation 2. Experimental Preparation 2.1. Coal Coal Samples Samples Preparation Preparation 2.1. The coal coalsamples sampleswere were taken from 9 working face the Changgouyu coalinmine in The taken from thethe No.No. 9 working face of theof Changgouyu coal mine Beijing, Beijing,was which was a mine. bursting mine. the To anisotropy avoid the and anisotropy and heterogeneity and ensure which a bursting To avoid heterogeneity and ensure experimental experimental reliability and comparability, three large and complete coal blocks from theofsame reliability and comparability, three large and complete coal blocks from the same position the position of the working face were chosen. A vertical drilling machine was used to get Φ50 mmfrom coal working face were chosen. A vertical drilling machine was used to get Φ50 mm coal core logs core logs these coal blocks, they100 were cutlong intopieces 100 mm test. After that, these these coalfrom blocks, and they were and cut into mm forlong test.pieces After for that, these coal samples coal samples (Φ50 mm × 100 mm) were polished and placed into a drying oven for storage. The (Φ50 mm × 100 mm) were polished and placed into a drying oven for storage. The sample preparation sample preparation procedure is shown in Figure 1. procedure is shown in Figure 1.
Figure Figure 1. 1. Samples Samples preparation preparation procedure. procedure.
The samples samples were were placed placed into into aa water water container container and and the the initial initialheight heightof ofwater waterwas wasset setto to1/4 1/4 of of The the sample sample height. height. The The height height of of water water was was increased increased1/4 1/4 of after each each 22 h, h, thus thus the of the the coal coal sample sample height height after the coal samples were totally immersed in water after 6 h. Samples were taken out from water at the the coal samples were totally immersed in water after 6 h. Samples were taken out from water at the fifth day, day,tenth tenthday dayand andfifteenth fifteenthday dayfor fortesting. testing. fifth
Energies 2017, 10, 1783
3 of 26
2.2. Experimental Devices and Procedures The mechanical parameters of the coal samples under different soak time were tested. The tested parameters include uniaxial compressive strength, Protodyakonov coefficient, porosity, pore volume, pore surface area and micro structure: (1) The water content and absorption, the uniaxial compressive strength and Protodyakonov coefficient were tested according to the China GB/T23561 national standard. The size of samples in the uniaxial compressive strength test is Φ50 mm × 100 mm. The grain size of samples in the Protodyakonov coefficient test is less than 20 mm. (2) The pore parameters of coal were measured by the 9310 mercury pressure microporous structure tester manufactured by Micromeritics (Micromeritics Instrument Corporation, Norcross, GA, USA). The porosity, pore volume and pore surface area of the samples were tested after soaking for 5 days, 10 days and 15 days. (3) The microstructure and morphology of coal were observed by an S-3000N scanning electron microscope (Hitachi, Ltd., Tokyo, Japan). The sample size was 10 mm × 10 mm × 10 mm. Before testing, the conductivity of samples was treated by the ion sputtering method and the thickness of the gold plating layer was controlled at 5~10 nm. 3. Experimental Results Analysis 3.1. Compressive Strength After soaking, the uniaxial compressive strength of the coal decreases with the increase of soaking duration. The overall decrease trend can be fitted to a cubic polynomial equation (Figure 2a). When the soaking time was 5 days, its decrease was largest, from 25.44 MPa to 13.63 MPa. With time increase, the decrease range was smaller after another five days, from 13.63 MPa to 12.42 MPa. After the third five days, the decrease range became bigger, from 12.42 MPa to 8.13 MPa. Therefore, the first five days of soaking are the most effective in changing the compressive strength of coal sample, and its relative reduction per day reaches to 2.36 MPa. The natural water content of the coal sample is 0.26%, and the average water content exceeded 1.29% after soaking. With such a higher water absorption value, the application of water injection is feasible. 3.2. Protodyakonov Coefficient The original test data is shown in Table 1. Table 1. Test results of Protodyakonov coefficient. Coal Sample
Serial Number
Number of Hits n
Height of Coal Dust l (mm)
Protodyakonov Coefficient f
Average Value
Original sample
1 2 3
3 3 3
46.5 45.5 43.5
1.2903 1.3187 1.3793
1.33
Soaking 5 days
1 2 3
3 3 3
49.0 47.5 45.5
1.2245 1.2632 1.3187
1.26
Soaking 10 days
1 2 3
3 3 3
67.5 68.0 69.5
0.8877 0.8824 0.8633
0.87
Soaking 15 days
1 2 3
3 3 3
78.5 79.5 77.5
0.7643 0.7547 0.7742
0.76
Energies 2017, 10, 1783
4 of 26
Energies 2017, 10, 1783
4 of 26
The Protodyakonov coefficient of coal sample is calculated according to Equation (1): ff =
20n 20n ll
(1) (1)
where: where: f is Protodyakonov coefficient, n is the number of hits during a test, and l is the height of coal dust from coal sample after after hits hits in in aa test. test. As soak duration increases, the Protodyakonov coefficient gradually decreases and there is a linear relationship between them (Figure 2b). 2b). After soaking for five days, there is point of change for the Protodyakonov coefficient, where it rapidly rapidly decreases. decreases. After soaking for 10 days, the decrease rate becomes low. low. Therefore Therefore the the soaking soaking duration duration between between five five days days and and 10 days is the most effective timing in reducing the Protodyakonov Protodyakonov coefficient. coefficient.
(a)
(b)
Figure 2.2.The Thechange change mechanical parameters of with coal soaking with soaking duration: (a) compressive Figure of of mechanical parameters of coal duration: (a) compressive strength strength and (b) Protodyakonov coefficient. and (b) Protodyakonov coefficient.
3.3. Pore Structure 3.3. Pore Structure 3.3.1. Relationship between Porosity Porosity and and Soaking Soaking Duration Duration 3.3.1. Relationship between It can can be be seen seen in in Table Table 22 that that for for different different soaking soaking durations, durations, there there is is obvious obvious changes changes of of true true It specific gravity, apparent specific gravity and porosity. The longer the soaking duration is, the bigger specific gravity, apparent specific gravity and porosity. The longer the soaking duration is, the bigger porosity is. is. When When the the soaking soaking duration duration is is between between five five days days and and 10 10 days, the rate porosity days, the rate of of porosity porosity increase increase is the maximum, and its relative increment per day reaches to 0.316. After 10 days, the increase rate is the maximum, and its relative increment per day reaches to 0.316. After 10 days, the increase rate becomes low. becomes low. Table 2. Test results results of of specific specific gravity gravity and and porosity porosity of of coal coal samples. samples.
Coal Sample
True Specific True Specific Gravity Gravity (g/cm3 ) (g/cm3)
Original sample Original sample Soaking 5 days Soaking days Soaking 10 10 days Soaking days Soaking 15 days Soaking 15 days
1.6475 1.6475 1.5762 1.5762 1.6134 1.6134 1.5961 1.5961
Coal Sample
Apparent Apparent Specific Porosity Porosity Specific Gravity (%) (%) 3) Gravity (g/cm 3 (g/cm ) 1.6739 1.6739 1.6425 1.6425 1.7058 1.7058 1.7027 1.7027
2.64 2.64 4.21 4.21 5.79 5.79 6.68 6.68
Increment of Porosity Reduction of Compressive Reduction of Compressive Increment of Porosity (%) (%) Strength Strength(MPa) (MPa) Relative Relative Relative Relative Total Total Total Total Increment Reduction Per Increment Per Reduction Per Increment Reduction Increment Reduction Per Day Day Day Day ----1.57 0.314 11.81 2.36 1.57 0.314 11.81 2.36 3.15 0.316 3.15 0.63 3.15 0.316 3.15 0.63 4.04 0.178 4.29 0.86 4.04 0.178 4.29 0.86
3.3.2. Relationship between 3.3.2. Relationship between Pore Pore Volume Volume and and Soaking Soaking Duration Duration Table inin thethe coal industry in China, which is on Table 33shows showsthe thecommon commonmethod methodofofpore poreclassification classification coal industry in China, which is the basis of the diameter ranges of pore in the coal body. The Chinese names of different types of pore on the basis of the diameter ranges of pore in the coal body. The Chinese names of different types of are as microspore, minor minor mesopore, mesopore and macrospore in this paper, theyand are poretranslated are translated as microspore, mesopore, mesopore and macrospore in thisand paper, completely different different with the with diameter classification by the International Union ofUnion Pure and Applied they are completely the diameter classification by the International of Pure and
Applied Chemistry. They are commonly called diffusion pore, slight permeation pore and strong permeation pore [24].
Energies 2017, 10, 1783
Energies 2017, 10, 1783 Energies 2017, 10, 1783 are Chemistry. They
5 of 26
5 of 26
5 of 26 commonly called diffusion pore, slight permeation pore and strong permeation
pore [24]. Table 4 showscoal coal samples’pore pore volumeand and itspercentage percentage of alltypes types of porefor for different Table Table44shows shows coalsamples’ samples’ porevolume volume andits its percentageofofall all typesofofpore pore fordifferent different soaking durations. The total pore volume, all types of pore volume and their percentage increase with soaking soakingdurations. durations.The Thetotal totalpore porevolume, volume,all alltypes typesofofpore porevolume volumeand andtheir theirpercentage percentageincrease increasewith with soaking time.As As shownininFigure Figure 3, the5th 5th dayisisa achanging changing pointafter after whichtime time coalpore pore volume soaking soakingtime. time. Asshown shown in Figure3,3,the the 5thday day is a changingpoint point afterwhich which timecoal coal porevolume volume increases rapidly. When soaking duration is between 5 days and 10 days, the volume increase of total increases rapidly. When soaking duration is between 5 days and 10 days, the volume increase of increases rapidly. When soaking duration is between 5 days and 10 days, the volume increase oftotal total pore, micropore, minor mesopore, macrospore and visible pore are the maximum. This indicates the pore, pore,micropore, micropore,minor minormesopore, mesopore,macrospore macrosporeand andvisible visiblepore poreare arethe themaximum. maximum.This Thisindicates indicatesthe the internal structureofofcoal coal changesdramatically dramatically duringthis this period. internal internalstructure structure of coalchanges changes dramaticallyduring during thisperiod. period.
Figure 3. Curves of all types of pore volume of coal samples before and after soaking. Figure 3. Curves of all types of pore volume of coal samples before and after soaking. Figure 3. Curves of all types of pore volume of coal samples before and after soaking.
3.3.3.Relationship Relationshipbetween betweenPore PoreSurface SurfaceArea Areaand andSoaking SoakingDuration Duration 3.3.3. 3.3.3. Relationship between Pore Surface Area and Soaking Duration Thepore poresurface surfacearea areaand anditsitspercentage percentageduring duringdifferent differentsoaking soakingtime timeare areshown shownininTable Table5.5.ItIt The Theseen porethat surface area and its percentage during different soaking time areand shown in Table 5. can be micropore and minor mesopore have large pore surface area, mesopore and can be seen that micropore and minor mesopore have large pore surface area, and mesopore and Itmacrospore can be seenare thatrelatively microporesmall. and minor mesopore have large pore surface area, and mesopore and Therefore,the thetotal totalpore poresurface surfacearea areaisismainly mainlycomposed composedofof macrospore are relatively small. Therefore, macrospore are relatively small. Therefore, thetime totalincreases, pore surface area is mainly composed of micropore micropore and minor mesopore. As soaking the surface area of all types coalpores pores micropore and minor mesopore. As soaking time increases, the surface area of all types ofofcoal and minor and mesopore. As soaking time increases, the surface area significant. of all types When of coalthe pores increases, increases, the increase of micropore surface area is the most soaking time increases, and the increase of micropore surface area is the most significant. When the soaking time and the increase of micropore surface area is the most significant. When the soaking time is 10 days, days,the theincrease increaseofoftotal totalpores poressurface surfacearea areareaches reachesa amaximum maximum(as (asshown shownininFigure Figure4).4).The The isis1010days, the increase of totalarea pores surface area reaches a maximum (as shown in Figure 4). The larger pore larger pore surface is, the more easily the samples are broken under the same loading conditions. larger pore surface area is, the more easily the samples are broken under the same loading conditions. surface area is, the more easily thearea samples are broken under the strength same loading conditions. Due to Duetotosoaking, soaking, coal poresurface surface changed thatmakes makes coal internalstructure structure Due coal pore area isischanged that the strength ofofcoal internal soaking, reduce. coal pore surface area is changed that makes the strength of coal internal structure reduce. reduce.
Figure 4. 4. Curves Curves of of the the change change of pore pore surface surface area areawith withsoaking soakingtime. time. Figure Figure 4. Curves of the change ofofpore surface area with soaking time.
Energies 2017, 10, 1783
6 of 26
Table 3. The common method of pore classification of coal in China. Type of Pore Size
Microspore
Minor Mesopore (Diffusion Pore)
Mesopore (Slight Permeation Pore)
Macrospore (Strong Permeation Pore)
1000
Diameter (nm)
Table 4. The distribution of pore volume of coal samples. Microspore
Minor Mesopore
Mesopore
Macrospore
Visible Pore
Volume (mL/g)
Percentage (%)
Volume (mL/g)
Percentage (%)
Volume (mL/g)
Percentage (%)
Volume (mL/g)
Percentage (%)
Volume (mL/g)
Percentage (%)
Adsorption Volume (mL/g)
Permeation Volume (mL/g)
Total Volume (mL/g)
Original sample
0.0013
20.97
0.0010
16.13
0.0015
24.19
0.0024
38.71
0.0000
0.00
0.0013
0.0049
0.0062
Soaking 5 days
0.0016
13.23
0.0040
33.06
0.0027
22.31
0.0038
31.40
0.0000
0.00
0.0016
0.0105
0.0121
Soaking 10 days
0.0047
15.31
0.0089
28.99
0.0069
22.48
0.0072
23.45
0.0003
0.98
0.0047
0.0026
0.0307
Soaking 15 days
0.0049
14.63
0.0102
30.45
0.0081
24.18
0.0097
28.96
0.0006
1.79
0.0049
0.0286
0.0335
Coal Sample
Table 5. The distribution of pore surface area of coal samples. Coal Sample
Microspore
Minor Mesopore
Mesopore
Macrospore
Visible Pore
Total Surface Area (m2 /g)
Surface Area (m2 /g)
Percentage (%)
Surface Area (m2 /g)
Percentage (%)
Surface Area (m2 /g)
Percentage (%)
Surface Area (m2 /g)
Percentage (%)
Surface Area (m2 /g)
Percentage (%)
Original Sample
0.984
82.27
0.188
15.72
0.019
1.59
0.005
0.42
0.0000
0.00
1.196
Soaking 5 Days
1.215
64.12
0.315
16.62
0.207
10.92
0.155
8.18
0.0003
0.16
1.895
Soaking 10 Days
2.125
70.43
0.437
14.48
0.276
9.15
0.174
5.77
0.0005
0.17
3.017
Soaking 15 Days
2.314
65.33
0.527
15.27
0.341
9.88
0.237
6.69
0.0006
0.17
3.452
Energies 2017, 10, 1783
7 of 26
Energies 2017, 10, x FOR PEER REVIEW
7 of 26
3.4. Microstructure Energies 2017, 10, x FOR PEER REVIEW
7 of 26
3.4. Microstructure Based on the SEM results, the microstructure and morphology of coal samples before and after 3.4. Microstructure Based ontime the SEM the microstructure different soaking wereresults, as observed in Figures and 5–9.morphology of coal samples before and after different soaking as observed in Figures and 5–9. morphology of coal samples before and after Based on thetime SEMwere results, the microstructure different soaking time were as observed in Figures 5–9.
(a)
(b)
(a)
(b)
(c)
(d)
(c) (d) Figure 5. SEM image for the overall structure change: (a) before soaking; (b) soaking for 5 days; Figure 5. SEM image for the overall structure change: (a) before soaking; (b) soaking for 5 days; (c) soaking for 10 days for andthe (d) overall soakingstructure for 15 days. Figure 5. SEM image change: (a) before soaking; (b) soaking for 5 days;
(c) soaking for 10 days and (d) soaking for 15 days.
(c) soaking for 10 days and (d) soaking for 15 days.
(a)
(b)
(a)
(b)
Figure 6. Cont.
Energies 2017, 10, 1783
8 of 26
Energies 2017, 10, x
8 of 26
Energies 2017, 10, x
8 of 26
(c)
(d)
(c) (d) Figure 6. SEM image of the internal flake structure: (a) before soaking; (b) soaking for 5 days; Figure 6. SEM image of the internal flake structure: (a) before soaking; (b) soaking for 5 days; (c) soaking (c) soaking for 10image days and (d) internal soaking for 15 structure: days. Figure 6. SEM of the flake (a) before soaking; (b) soaking for 5 days; for 10 days and (d) soaking for 15 days. (c) soaking for 10 days and (d) soaking for 15 days.
(a)
(b)
(a)
(b)
(c)
(d)
Figure 7. SEM image (c) of the internal pore structure: (a) before soaking;(d) (b) soaking for 5 days; (c) soaking for 10image days and (d) internal soaking for 15structure: days. Figure 7. SEM of the pore (a) before soaking; (b) soaking for 5 days; Figure SEM image theand internal pore structure: (a) before soaking; (b) soaking for 5 days; (c) soaking (c)7.soaking for 10 of days (d) soaking for 15 days.
for 10 days and (d) soaking for 15 days.
Energies 2017, 10, 1783
9 of 26
Energies 2017, 10, x
9 of 26
Energies 2017, 10, x
9 of 26
(a)
(b)
(a)
(b)
(c)
(d)
(c) (d) Figure 8. SEM image of the internal cracks structure: (a) before soaking; (b) soaking for 5 days; Figure 8. SEM image of the internal cracks structure: (a) before soaking; (b) soaking for 5 days; (c) soaking for 10 days of andthe (d)internal soakingcracks for 15 days. Figure 8. SEM image structure: (a) before soaking; (b) soaking for 5 days;
(c) soaking for 10 days and (d) soaking for 15 days.
(c) soaking for 10 days and (d) soaking for 15 days.
(a)
(b)
(a) (b) Figure 9. SEM image of the fold structure: (a) before soaking and (b) soaking for 15 days. Figure 9. SEM image of the fold structure: (a) before soaking and (b) soaking for 15 days.
Figure 9. SEM image of the fold structure: (a) before soaking and (b) soaking for 15 days. From the SEM images, a large number of pores, cracks, and flake structures can be seen inside the coal samples. Before soaking, there is no of obvious those shown in Figures From the SEM images, a large number pores,change cracks, on and flakestructures structuresascan be seen inside From the SEM images, a large number of obvious pores, cracks, flakestructures structuresascan be seen inside the the coal samples. Before soaking, there is no changeand on those shown in Figures
coal samples. Before soaking, there is no obvious change on those structures as shown in Figures 5a, 6a, 7a and 8a. From Figure 5, it can be seen that the internal structures of samples are smooth and there
Energies 2017, 10, 1783
10 of 26
are no obvious protuberances. As soaking duration increases, the surface becomes raw and bubblelike structures and cracks start to appear. Figure 6 shows the flake structure of coal samples. From Figure 6a, it can be seen that the surface of the coal sample is smooth and there is no apparent development of pore and flake structures. The flakes are closely interlaced at the coal surface. As soaking duration increases, flake structures gradually develop and separate from the coal body (as shown in Figure 6b–d). When the soaking time is 15 days, a large number of pores appear in the flake structures, which cause the microstructure surface area to increase. Figure 7 shows the pore structure of the samples. As can be seen from Figure 7a, only few small pores are scattered on the coal surface. When the soaking duration is five days, filamentous structures and cracks are produced. It can be seen in Figure 7c,d that there are a large number of pores and the surface area increases. Pores are surrounded by fold structures that increase the microstructure surface area. Figure 8 shows the development of the crack structure. Before soaking, cracks are rigid and their ports are smooth with no adhesive material around. With soaking time increase, there is protruding structure at their ports and a large number of flake structures develop. After soaking for 15 days, glaze structure occurs at crack ports which make the upper and lower of crack surfaces adhere together. This increases crack surface area. Figure 9 shows the fold structure of coal samples after soaking. When the soaking time is between 10 days and 15 days, folds occur at the surface of organic components in the coal and this causes the microstructure surface area to increase. In summary, the surface area and total volume of the internal microstructure of coal samples can be greatly increased by soaking. These findings agree with the measurements in Section 3.3. The findings indicate water injection can change the coal microstructure, which makes it favorable for stress release and rockburst disaster prevention and control. 4. Application in Rockburst Prevention For further studying the time effect of coal seam water injection, this study conducted numerical simulations by using real geological condition data from a mine, and performed on-site tests for validation purposes. 4.1. Numerical Simulation 4.1.1. Model and Parameters The FLAC-3D software is a professional tool used to simulate the stress and deformation of rock materials under loading conditions [25], and can be used to simulate the water injection process for reducing stress concentration and the danger of rockbursts. The simulated area is based on the conditions of the No. 9 working face in the Changgouyu coal mine where rockbursts have occurred. The model has 156,000 units (Figure 10) and its dimensions are 120 m × 200 m × 140 m. The model boundary is fixed, with the horizontal displacement and the boundary at the bottom is fixed with the vertical displacement. A uniform loading of 12.0 MPa is applied on the top, which is equivalent to the vertical stress of about 500 m rock mass. The initial displacement and its rate are set to be zero, and the original main stress is installed according to the actual ground stress. The Mohr-Coulomb strain softening failure criterion is adopted in the model. The internal friction angle and cohesion softening parameters used for modelling the immediate and main roof are shown in Table 6. Coal bedding is simulated by using the interface unit. The normal stiffness and shear stiffness are both 1.0 × 10⁴ MPa. The physical mechanics parameters of the coal seam and the immediate roof are set according to test results. The parameters of the floor, roof and other strata are listed in Table 7. The upper +150 m level is firstly mined, and the gob area is treated as backfilling with soft rocks with parameters listed in Table 6.
Energies 2017, 10, 1783
11 of 26
Energies 2017, 10, x
11 of 26
Table 6. The softening parameters of backfilling rocks. Table 6. The softening parameters of backfilling rocks. Categories Categories
Strain Strain (ε)(ε) Cohesion C/MPa Cohesion C/MPa Internal Friction Angle Internal Friction Angle
0.00 0.00 1.8 1.8×× 10 1066 30 30
Immediate Roof Roof Main Roof Immediate Main Roof 0.01 0.02 0.50 0.00 0.01 0.020.02 0.500.50 0.02 0.50 0.00 0.01 4 4 2.0 6 6 1.01.0 0.9 1066 0.5 0.5 ××10 1066 1.0 1.0××1010 2.0× × × 6106 1.01.0 ×5 1051.0 1.0 0.9 × × 10 1010 × 10 × 10 × 10×4 104 25 20 15 33 28 25 25 20 15 33 28 25 22 22
(a)
(b) Figure 10. Schematic diagram of the model: (a) model mesh and (b) overall model structure. Figure 10. Schematic diagram of the model: (a) model mesh and (b) overall model structure.
Energies 2017, 10, 1783
12 of 26
Energies 2017, 10, x
Rock Bedding Overlying strata Rock Bedding Main roof Directstrata roof Overlying Coalroof seam Main DirectFloor roof Underlying Coal seam strata Floor Underlying strata
12 of 26
Table 7. Rock mechanic parameters. Rock mechanic parameters. Bulk Modulus Table Shear7.Modulus Density Friction (Gpa) (Gpa) (kg·m−3 ) Angle (◦ ) Bulk Modulus 2.6 (Gpa)
Shear Modulus 2.4 (Gpa)
2.6 3.2 2.4 1.8 2.0 3.0
2.4 2.4 1.8 1.4 1.6 2.6
3.2 2.4 1.8 2.0 3.0
2.4 1.8 1.4 1.6 2.6
4.1.2. Water Injection Parameters Optimization
Density 2500 (kg· m−3)
2700 25002600 27001400 26002600 14002500 2600 2500
Friction Angle30 (°) 33 30 30 33 28 30 28 28 33 28 33
Cohesion (Mpa)
Tensile Strength (Mpa)
Cohesion 2 (Mpa)
Tensile Strength 2.6 (Mpa)
1.5 2.0
2.4 2.6 1.8 3.0 2.0 2.4 2.6 1.8 2.0 2.6
3.5 2 1.8 3.5 1.3 1.8 1.5 1.3 2.0
3.0
4.1.2. Water Injectionparameters Parameters play Optimization Water injection an important role in the effectiveness of preventing and controlling in coal seams. These parameters borehole length and diameter, Waterrockbursts injection parameters play an important role ininclude the effectiveness of preventing and borehole interval, borehole number, and water injection time. Firstly, the water injection effect under controlling rockbursts in coal seams. These parameters include borehole length and diameter, different conditions of borehole diameter, length, interval numbers is simulated in this study. borehole interval, borehole number, and water injection time.and Firstly, the water injection effect under different conditions borehole diameter, are length, interval and numbers is simulated inand thisrockburst study. After reasonable valuesoffor these parameters determined, the effect of stress reduction After reasonable values for these parameters determined, thesimulated. effect of stress reduction results and prevention under varied water injection times (5, are 10, 15 and 30 h) are The simulation rockburst prevention under varied water injection times (5, 10, 15 and 30 h) are simulated. The are shown in Figures 11–15. simulation results results are shown in Figurescombinations 11–15. The numerical for different of borehole lengths and borehole diameters are The numerical results for different combinations of borehole lengths and borehole diameters arethe given in Figures 11 and 12. It shows that the water affected area becomes more extensive and given in Figures 11 and 12. It shows that the water affected area becomes more extensive and the release and transfer of stress concentration are easier with the increase of borehole length and borehole release When and transfer stress concentration are60easier the increase of borehole diameter. using aofborehole with length of m andwith diameter of 60 mm, the stresslength of coaland seam borehole diameter. When using a borehole with length of 60 m and diameter of 60 mm, the stress of is obviously transferred away from the stress concentration area and the risk of rockburst becomes coal seam is obviously transferred away from the stress concentration area and the risk of rockburst lower. Based on numerical results and actual mining conditions of the Changgouyu mine, our study becomes lower. Based on numerical results and actual mining conditions of the Changgouyu mine, can identify that the best borehole length and diameter are 60 m and 60 mm, respectively. our study can identify that the best borehole length and diameter are 60 m and 60 mm, respectively. With the 60 m length and 60 mm diameter borehole, the simulation of stress distribution under With the 60 m length and 60 mm diameter borehole, the simulation of stress distribution under different borehole intervals suggeststhat thatwater waterinjection injectionwith with interval different borehole intervalsare aregiven givenin inFigure Figure 13. 13. It It suggests 2020 mm interval hashas no no obvious influence on stress distribution. However, water injection effectiveness is slightly better obvious influence on stress distribution. However, water injection effectiveness is slightly when the borehole intervals are 10 m and 15 m. Due to the higher cost associated with small borehole better when the borehole intervals are 10 m and 15 m. Due to the higher cost associated with small intervals, is reasonable to choose 15 m as the interval. interval. boreholeit intervals, it is reasonable to choose 15best m asborehole the best borehole
(a)
Figure 11. Cont.
Energies 2017, 10, 1783 Energies 2017, 10, x
13 of 26 13 of 26
(b)
(c) Figure 11. Simulation of water affected area under three different conditions: (a) Borehole length Figure 11. Simulation of water affected area under three different conditions: (a) Borehole length 40 m, 40 m, diameter 50 mm; (b) Borehole length 50 m, diameter 55 mm; (c) Borehole length 60 m, diameter diameter 50 mm; (b) Borehole length 50 m, diameter 55 mm; (c) Borehole length 60 m, diameter 60 mm. 60 mm.
Energies 2017, 10, 1783
14 of 26
Energies 2017, 10, x
14 of 26
(a)
(b) Figure 12. Cont.
Energies 2017, 2017, 10, 10, 1783 x Energies 2017, 10, x
15 of 26 15 of 26
(c) (c) Figure 12. Simulation of stress distribution under three different conditions: (a) Borehole length 40 m, Figure 12. 12. Simulation of under three different conditions: (a) length 40 Figure Simulation of stress stress distribution distribution three55 different (a) Borehole Borehole 40 m, m, diameter 50 mm; (b) Borehole length 50 m,under diameter mm; (c)conditions: Borehole length 60 m, length diameter 60 diameter 50 mm; (b) Borehole length 50 m, diameter 55 mm; (c) Borehole length 60 m, diameter 60 diameter 50 mm; (b) Borehole length 50 m, diameter 55 mm; (c) Borehole length 60 m, diameter 60 mm. mm. mm.
(a) (a) Figure 13. Cont.
Energies 2017, 10, 1783 Energies 2017, 10, x
16 of 26 16 of 26
(b)
(c) Figure 13. Simulation of stress distribution under three different borehole interval conditions: (a) 10 Figure 13. Simulation of stress distribution under three different borehole interval conditions: (a) 10 m; m; (b) 15 (c) m; 20 (c) m. 20 m. (b) 15 m;
With the above determined borehole parameters, the effect of different borehole number (1, 2 or With the above determined borehole parameters, the effect of different borehole number (1, 2 or 3 holes injected simultaneously) are simulated and the results are shown in Figures 14 and 15. The 3 holes injected simultaneously) are simulated and the results are shown in Figures 14 and 15. The effect effect with three boreholes injecting water simultaneously is far better than that of a single borehole, with three boreholes injecting water simultaneously is far better than that of a single borehole, and the and the effect of two boreholes is also slightly better than that of a single borehole. It is apparent that effect of two boreholes is also slightly better than that of a single borehole. It is apparent that more more water injection boreholes result in more effective rockburst prevention. However, the water injection boreholes result in more effective rockburst prevention. However, the construction construction conditions and the cost should also be considered when determining this parameter. conditions and the cost should also be considered when determining this parameter.
Energies 2017, 10, 1783
17 of 26
Energies 2017, 10, x
17 of 26
(a)
(b) Figure 14. Cont.
Energies 2017, 10, 1783 Energies 2017, 10, x Energies 2017, 10, x
18 of 26 18 of 26 18 of 26
(c) (c) Figure 14. Simulation of the water-affected area different number of boreholes: (a) one, (b) two Figure forfor different number of boreholes: (a) one, (b) two Figure 14. 14. Simulation Simulationof ofthe thewater-affected water-affectedarea area for different number of boreholes: (a) one, (b) and two and (c) three. (c) three. and (c) three.
(a) (a) Figure 15. Cont.
Energies 2017, 10, 1783 Energies 2017, 10, x
19 of 26 19 of 26
(b)
(c) Figure 15. Simulation of stress distribution under different number of boreholes: (a) one; (b) two and Figure 15. Simulation of stress distribution under different number of boreholes: (a) one; (b) two and (c) three. (c) three.
4.1.3. Simulation of the Time Effect of Water Injection on Reducing Vertical Stress 4.1.3. Simulation of the Time Effect of Water Injection on Reducing Vertical Stress Three water injection boreholes, along the coal seam tendency, are drilled in the coal body of the Three water injection boreholes, along the coal seam tendency, are drilled in the coal body of roadway of No. 9 working face. The depth and diameter of each borehole is 60 m and 60 mm. the roadway of No. 9 working face. The depth and diameter of each borehole is 60 m and 60 mm. The space between two adjacent holes is 10 m, with the first one 15 m from the cutting of working face. Water is injected to the three injection boreholes at the same time, and the changes of vertical
Energies 2017, 10, 1783
20 of 26
The space between two adjacent holes is 10 m, with the first one 15 m from the cutting of working Energies 2017, 10, x of 26 face. Water is injected to the three injection boreholes at the same time, and the changes of20vertical stress in coal seam are shown in Figure 16. As a result of water injection, coal body is softened and stress in coal seam are shown in Figure 16. As a result of water injection, coal body is softened and the stress concentration changes significantly. With the duration of water injection increase, the stress the stress concentration changes significantly. With the duration of water injection increase, the stress concentration isisgradually concentration graduallyreleased releasedor ortransferred. transferred.
(a)
(b)
Figure 16. Cont.
Energies 2017, 10, 1783 Energies 2017, 10, x
21 of 26 21 of 26
(c)
(d) Figure 16. Vertical stress in coal seam after different water injection time: (a) 5 h; (b) 10 h; (c) 15 h and Figure 16. Vertical stress in coal seam after different water injection time: (a) 5 h; (b) 10 h; (c) 15 h and (d) 30 h. (d) 30 h.
The vertical stress of working face on strike before and after water injection are shown in The vertical stress of working strike before and after wateron injection arearea shown in Figure Figure 17. Before water injection,face the on stress concentration is located the front of the plastic 17. Before stress concentration is located the of The the plastic zone of the zone water of the injection, upper andthe lower roadway and expands about on 3–10 mfront to thearea sides. maximum stress upper and lower roadway and expands about 3–10 m to the sides. The maximum stress is close to the is close to the mining face and the stress of the lower roadway is greater than that of the upper one. mining face and the stress of the lower roadway is greater than that of the upper one. When the time of
Energies 2017, 10, x Energies 2017, 10, 1783
22 of 26 22 of 26
When the time of water injection reaches 30 h, the maximum stress and stress in the plastic zone obviously decreases concentration the water hole is generally water injection reachesand 30 h,the thestress maximum stress andsurrounding stress in the plastic zoneinjection obviously decreases and disappeared. This illustrates that water injection can effectively soften the coal body and release or the stress concentration surrounding the water injection hole is generally disappeared. This illustrates partially thecan stresses. This can effectively stress concentration at the working face and that watertransfer injection effectively soften the coalreduce body and release or partially transfer the stresses. the danger of rockbursts. This can effectively reduce stress concentration at the working face and the danger of rockbursts.
Figure Figure17. 17. Vertical Verticalstress stressbefore beforeand andafter afterwater waterinjection. injection.
4.2.The TheOn-Site On-SiteTest Test 4.2. Themeasures measuresof ofpreventing preventingand andcontrolling controllingrockbursts rockburstsby byusing usingwater waterinjection injectionwere wereused usedon on The anothersimilar similarworking workingface facein inthe theChanggouyu Changgouyucoal coalmine. mine. Water Waterinjection injectionof oflong longborehole boreholelength length another wasapplied appliedin inboth bothupper upperand andlower lowerroadway roadwayalong alongthe thecoal coalseam seamtendency. tendency.Water Waterwas wasinjected injectedto to was thethree threeboreholes boreholesatatthe thesame sametime, time,and and circular water injection was used 10 days. details the circular water injection was used perper 10 days. TheThe details of of other water injection parameters were shown in Table other water injection parameters were shown in Table 8. 8. Table Table8.8.Parameters Parametersof ofwater waterinjection injectionof oflong longborehole boreholelength lengthon-site. on-site. Drilling
Pressurized Pressurized Drilling Direction Direction of Method of Holes Method Dynamic Dynamic pressure
pressure
Holes
Down
Down
Water
Effective Flow Per
Borehole Water Pressure Effective Flow Per Meter Per Borehole Borehole Borehole SealingSealing Pressure HourMeter Per Length (m) (m)Interval (m) (m) Depth (m) in Holes (L·Hour h−1 ) in Length Interval Depth (m) (MPa)
(MPa)
60
15
60
5–10
15
9–13
5–10
Holes (L·h−1)
40–50
9–13
40–50
The water injection effectiveness was tested by the electromagnetic radiation (abbreviated EMR) The water injection effectiveness was tested by the electromagnetic radiation (abbreviated EMR) technology. EMR is related to the stress of the coal and rock mass, and it reflects the stress concentration technology. EMR is related to the stress of the coal and rock mass, and it reflects the stress on the front of the working face. The higher the stress is, the more intense the deformation and fractures concentration on the front of the working face. The higher the stress is, the more intense the of a coal body and the stronger the EMR signals. EMR signals reflect the degrees of concentrated stress deformation and fractures of a coal body and the stronger the EMR signals. EMR signals reflect the of a coal body and danger of a rockburst. The electromagnetic radiation technology can be used to test degrees of concentrated stress of a coal body and danger of a rockburst. The electromagnetic radiation the effectiveness of stress concentration relieving caused by water injection. technology can be used to test the effectiveness of stress concentration relieving caused by water A KBD5 type portable EMR monitor (Fu’an Technology Co., Ltd, Xuzhou, China) was used in injection. the study. The distance between two adjacent EMR testing points in the coal wall or roadway is 10 m A KBD5 type portable EMR monitor (Fu’an Technology Co., Ltd, Xuzhou, China) was used in and the testing time at each testing point is 2 min [26,27]. EMR intensity (abbreviated E), measured as the study. The distance between two adjacent EMR testing points in the coal wall or roadway is 10 m mV, is selected as the EMR testing index for the stress distribution. EMR methods for predicting rock and the testing time at each testing point is 2 min [26,27]. EMR intensity (abbreviated E), measured burst are dynamic and a critical value is used in this method. In general, based on the EMR forecasting as mV, is selected as the EMR testing index for the stress distribution. EMR methods for predicting criterion, the E value which is 1.5 times the normal E value is selected as the initial critical E value in the rock burst are dynamic and a critical value is used in this method. In general, based on the EMR monitoring area. After a period of testing and according to the E value before the incidence of a rock forecasting criterion, the E value which is 1.5 times the normal E value is selected as the initial critical burst, the initial critical E value is modified by fuzzy mathematics. After further validation, a critical E E value in the monitoring area. After a period of testing and according to the E value before the value can be confirmed. The critical E value of this working face in the Changgouyu coalmine was incidence of a rock burst, the initial critical E value is modified by fuzzy mathematics. After further
Energies 2017, 10, x
Energies 2017, 10, 1783
23 of 26
23 of 26
validation, a critical E value can be confirmed. The critical E value of this working face in the Changgouyu coalmine was determined as 12 mV. During the test process, if the E value of the determined as 12 mV. During the test process, if the E value of the monitoring area exceeds 15 mV and monitoring area exceeds 15 mV and it appears as a special time trend (the trend is explained in it appears as a special time trend (the trend is explained in reference [28] in details) over several shifts reference [28] in details) over several shifts or days, then a rockburst will likely occur in this or days, then a rockburst will likely occur in this monitoring area. monitoring area. Figure 18 shows that the EMR signals were relatively stable Figure 18 shows that the EMR signals were relatively stablefrom from1 1April April2011 2011to to 55 April April 2011, 2011, and the strength was less than 10 mV. The E value gradually increased on April 6th and it reached 15 mV and the strength was less than 10 mV. The E value gradually increased on April 6th and it reached 15 mV onthat 7 April wasthe above the critical indicated stress theworking working face on 7 April wasthat above critical value.value. This This indicated thatthat thethe stress atatthe faceand and the lower roadway had increased, and stress the stress concentrationand and the the danger strong rockrock pressure lowerthe roadway had increased, and the concentration dangerofof strong pressure wereincreased. also increased. Therefore, measures shouldbe betaken taken to to reduce were also Therefore, measures should reducesuch suchrisks. risks.
Figure 18. The change of EMR signals at the working face and lower roadway. Figure 18. The change of EMR signals at the working face and lower roadway.
8 April following threedays, days,beyond beyond the injection of long borehole FromFrom 8 April andand thethe following three thecircular circularwater water injection of long borehole length, the emergent water injection of short borehole length started at the working face and lower length, the emergent water injection of short borehole length started at the working face and lower roadway. The depth ofborehole the borehole only 10 m, numberofofboreholes boreholeswas was added added by by 8, roadway. The depth of the waswas only 10 m, butbut thethe number 8, 11 and and 5 in the three days, and the injection durations is was min, 30 min, and 30 min per day. 5 in the three days, and the injection durations is was min, 30 min, and 30 min per day. After water injection for three days, the EMR intensity at the working face and lower roadway After water injection for three days, the EMR intensity at the working face and lower roadway decreased, its value was lower than 10 mV and it became stable again. This illustrated that the water decreased, its value was lower 10 mV soften and it the became again. This or illustrated thatstress. the water injection is effective. It canthan effectively coal stable body and release transfer the injection is effective. It can effectively soften the coal body and release or transfer the stress. The danger The danger of strong rock stress disappeared. of strong rock stress disappeared. There was a strong rockburst on 23 May in another coal seam, which caused apparent damage to onewas of the roadways and the working Aftercoal that,seam, waterwhich injection alsoapparent was useddamage as a to There a strong rockburst on 23 May inface. another caused action. threeface. weakAfter rockbursts happened after also that, was the damage was one ofpreventative the roadways andAlthough the working that, water injection used ascaused a preventative This shows obvious effect of coal seamafter water injection on the caused preventing controlling action.small. Although three the weak rockbursts happened that, the damage wasand small. This shows of rock effect stress on-site. the obvious of coal seam water injection on the preventing and controlling of rock stress on-site. 5. Discussion 5. Discussion Coal is a porous medium with a large number of cracks and pores inside. Water flows inside
Coal is a porous medium with a large number of cracks and pores inside. Water flows inside coal coal in the form of permeation, capillary movement and diffusion. After soaking, water slowly flows in thealong form cracks of permeation, capillary diffusion. slowly flows and capillaries. As movement soaking timeand increases, the After water soaking, pressure water at crack surfaces andalong cracksmineral and capillaries. As soaking time increases, the water pressure at crack surfaces and swelling cause changes to the mechanical properties of coal, including an increasemineral of swelling cause and changes to the mechanical coal, including an increase of plasticity, and a plasticity, a decline of hardness and properties compressiveofstrength. one hand, has an expansion decline ofOn hardness andwater compressive strength. effect on the primary cracks of coal. As depicted in Figure the effect the pore structure, number of the cracks width. The On one 8, hand, water changes has an expansion effect on the primary cracks of coal.and As their depicted in Figure 8, microstructure surface area increases due to the development of mesostructure. On the other hand, the effect changes the pore structure, the number of the cracks and their width. The microstructure after soaking, waterdue inside samples causes coalof body swelling, which expands original surface area increases to the development mesostructure. Onnot theonly other hand,the after soaking, water inside samples causes coal body swelling, which not only expands the original crack but also produces new cracks (as shown in Figure 7). As soaking time increases, at the end of the cracks protruding structures develop with a large number of flake structures, and the number and length of cracks increases obviously. Soaking causes a microstructure change, which is determined by soaking
Energies 2017, 10, 1783
24 of 26
time. The surface area and total volume of the internal microstructure of coal samples can be greatly increased by soaking, so it is possible to use water injection to change the the mechanical properties of coal. After soaking, the mechanical properties of coal have changed. Uniaxial compressive strength, Protodyakonov coefficient and porosity are obviously changed after different soaking times. This demonstrates a time effect. Through studying experimental data, the slope between the relative variation of mechanical parameters of different coal size and soaking time is obtained, as shown in Table 9. The time effect is different for different coal sizes. The obvious effective soaking time in centimeter and millimeter sized coal is the first five days after soaking, but for micron size coal, this is from five to 10 days after soaking. Table 9. Relationship between mechanical parameters of different size coal and soaking time.
Coal Size
Corresponding Mechanical Parameter
Centimeter Millimeter Microns
Soaking Duration 0–5 Days
5–10 Days
10–15 Days
Reduction of Compressive strength per day (MPa) Reduction of Protodyakonov coefficient per day (MPa)
2.36 0.014
0.63 0.078
0.86 0.022
Increment of Porosity per day (%) Increment of Total pore volume per day (mL/g) Increment of Total pore surface area per day (m2 /g)
0.314 0.0012 0.1398
0.316 0.0037 0.2244
0.178 0.006 0.087
The variation of physical-mechanical parameters of coal in different soaking time is obvious. When the soaking time is 5 days, the decrease of uniaxial compressive strength is the maximum. Although, uniaxial compressive strength continually decreases as soaking time increases, the decrease rate becomes slower at the later stage. There is a change point of pore volume and Protodyakonov coefficient when soaking for five days and 10 days. During this time the decrease rate of the Protodyakonov coefficient and increase of porosity and pore surface area reach the maximum. Based on the analysis, it can be found that the mechanical properties of coal show a time effect during soaking. There is a changing point where mechanical properties of coal are changed dramatically. Therefore, studying the optimal time of coal soaking in the laboratory has an important guiding significance for the on-site application of coal seam water injection. Bursting liability theory holds that under the same geological and mining conditions, rockbursts in coal seams yield large differences, and their occurrence is determined by the inherent mechanical properties of coal. These inherent properties are regarded as the bursting liability of coal. The so-called bursting liability indices, duration of dynamic fracture (DT), elastic strain energy index (WET ), bursting energy index (KE ), and uniaxial compressive strength (RC ) were proposed to evaluate the bursting liability of coal [29]. Wu et al. [15] concluded that when the moisture content increases by 3%, the uniaxial compressive strength of coal samples reduces by 32%, and there is an exponential relationship between the reduction of coal strength and the immersion time. Pan et al. [21] pointed out that extending the soaking time can reduce the overall degree of burst tendency of coal samples with strong tendency. Uniaxial compressive strength falls rapidly after seven days of soaking, and the degree of the other three indexes begins to increase after 20 days soaking. Mao et al. [18] determined the relationship between the burst liability and water content and porosity in coal seam by experimental studies, and found that the burst liability depends inversely on the water content, and is most sensitive to the original water content. Studies by Liu [16] and Sun [17] applied water injection measures to rockburst prevention in different coal mines. The above studies focused on the mechanic mechanism of water injection on coal on a macro scale (from centimeter to meter size), and the micro scale mechanics mechanism had not been studied. We analyzed the time effect mechanism of water on different sizes of coal (from meter to nano-meter size). Uniaxial compressive strength, Protodyakonov coefficient and the porosity are measured after the samples have completely soaked in water for a period of time. During soaking, a small amount of hydrophilic mineral absorbs water and swells that cause a decrease of coal strength.
Energies 2017, 10, 1783
25 of 26
Water is a solvent that can dissolve soluble minerals, and the degree of dissolution is related to soaking time. Because of this, the strength of coal increases, which leads to the burst liability of coal samples changing with soaking time. In the numerical simulation and on-site application, pressurized water is used which is favorable for infiltrating the coal seams, reducing the effective time of water injection and improving efficiency. Our research had provided a method to study the time effect of water injection on the mechanical properties of coal of different sizes and its application in rockburst prevention. The proposed water injection measure and parameters are only applicable to the Changgouyu coal mine, where the natural water content of its coal is 0.26%, and the average water content exceeds 1.29% after absorption, so the permeability of this coal seam is relatively poor. Further studies are needed for different coal seams with different coal properties 6. Conclusions (1) The mechanical properties of coal samples under soaking for different durations are tested in the laboratory. The time effect differs with the coal size. When the soaking time was five days, the rate of decrease of uniaxial compressive strength was the maximum. In addition, there was a changing point in the Protodyakonov coefficient, porosity and pore volume and surface area. After soaking for 10 days, the surface area increase of micropore, small pore, mesopore, big pore and visible pores and total surface area of pores reached the maximum. (2) As soaking time increases, changes to the pores, cracks, bubbles and flake structures inside the coal body take place and develop gradually. When the soaking time is between 10 days and 15 days, the development of the microstructure inside the coal body is sufficient and it shows that the internal skeleton and the mechanical properties of coal are changed. (3) The numerical simulation results show that the coal body is softened and the stress concentration changes significantly as a result of water injection. As the duration of water injection increases, the stress concentration is gradually released or transferred. When the injection time reaches 30 h, the stress concentration in the water injection area disappears, and the stress in the whole plastic zone also decreases significantly. On-site test results in the Changgouyu coal mine demonstrated that water injection can effectively soften coal bodies and release or transfer stresses, and showed the apparent time effect of water injection on rock prevention and control. Acknowledgments: This work was supported by the Fundamental Research Funds for the Central Universities (2017CXNL02), and A Project Funded by the Priority Academic Program Development of Jiangsu Higher Education Institutions (PAPD). This work also was funded by China Scholarship Council. The authors are grateful to all the people who help us in this paper. Author Contributions: For this paper, Xiaofei Liu put forward the study ideas, conducted the on-site tests, and wrote this paper; Guang Xu discussed experimental ideas with Xiaofei Liu and completed a part of the data analysis; the laboratory tests was completed by Dong Zhu and Chong Zhang; the numerical simulation and analysis was completed by Mingyao Wei; the data analysis were by Chong Zhang, Biao Kong and Jifa Qian. Conflicts of Interest: The authors declare no conflicts of interest.
References 1. 2. 3. 4. 5. 6.
Jiang, Y. Investigation on the Mechanism of Coal Bumps and Relating Experiments; Press Science: Beijing, China, 2009. Chen, X.; Li, W.; Yan, X. Analysis on rock burst danger when fully mechanized caving coal face passed fault with deep mining. Saf. Sci. 2012, 50, 645–652. [CrossRef] Jiang, Y.D.; Pan, Y.S.; Jiang, F.X.; Dou, L.M.; Ju, Y. State of the art review on mechanism and prevention of coal bumps in China. J. China Coal Soc. 2014, 39, 205–213. Cai, M. Principles of rock support in burst-prone ground. Tunn. Undergr. Space Technol. 2013, 36, 46–56. [CrossRef] Qian, M.; Shi, P. Mine Pressure and Ground Control; China University of Mining and Technology Press: Xuzhou, China, 2003; pp. 65–97. Sainoki, A.; Mitri, H.S. Dynamic behavior of mining-induced fault slip. Int. J. Rock Mech. Min. Sci. 2014, 66, 19–29.
Energies 2017, 10, 1783
7. 8. 9. 10.
11. 12. 13. 14. 15. 16. 17. 18. 19. 20. 21.
22. 23. 24.
25. 26. 27. 28. 29.
26 of 26
Patynska, R.; Kabiesz, J. Scale of seismic and rock burst hazard in the Silesian companies in Poland. Int. J. Rock Mech. Min. Sci. 2009, 19, 604–608. [CrossRef] Pan, J.; Mao, D.; Lan, H.; Lan, H.; Wang, S.; Qi, Q. Study status and prospects of mine pressure bumping control technology in China. Coal Sci. Technol. 2013, 41, 21–25. Turner, M.H.; Player, J.R. Seismicity at big bell mine. In Proceedings Massmin 2000; The Australasian Institute of Mining and Metalurgy: Melbourne, Australia, 2000; pp. 791–797. Simser, B.; Andrieus, P.; Gaudreau, D. Rockburst support at Noranda’s Brunswick mine, Bathurst, New Brunswick. In Proceedings of the 5th North American Rock Mechanics Symposium, Toronto, ON, Canada, 7–10 July 2002; Hammah, R., Bawden, W., Curran, J., Telesnicki, M., Eds.; Volume 1, pp. 805–813. Qi, Q.; Lei, Y.; Li, H.; Ji, Z.; Liu, J.; Pan, J.; Wang, Y. Theory and application of prevention of rock burst by break-tip blast in deep hole. Chin. J. Rock Mech. Eng. 2007, 26, 3522–3527. Zhang, M.; Song, W.; Pan, Y. Study on Water Pouring into Coal Seam to Prevent Rock-burst. J. Saf. Sci. Technol. 2003, 13, 69–72. Lan, Y. The Study on Drillhole Pressure Relief Preventing Rockburst in Coal Mine; Liaoning Technology University: Fuxin, China, 2004. Huang, B.; Cheng, Q.; Liu, C.; Wei, M.; Fu, J. Hydraulic Fracturing Theory of Coal-Rock Mass and Its Technical Framework. J. Min. Saf. Eng. 2011, 28, 167–173. Wu, Y.; Wang, S.; Zhang, W. Discussion on mechanism of rockburst prevention by water infusion. J. China Coal Soc. 1989, 2, 69–80. Liu, S.; Li, G.; Pan, J.; Ding, S. Technology of Rock-burst Prevention by Water-injection in 1000 m Buried Coal-seam. Coal Min. Technol. 2011, 16, 76–78. Sun, H.; Xu, L.; Zhu, F.; Mao, X.; Miao, X. The prevention and control of water injection method for soft rock mine rockburst accident. Coal Sci. Technol. 1999, 27, 48–50. Mao, X.; Chen, Z.; Xu, S.; Li, T. Experimental study on the relation between the burst tendency and water content in coal seam. Chin. J. Rock Mech. Eng. 2001, 20, 49–52. Feng, Z.; Zhao, Y. Correlativity of rock inhomogeneity and rock burst trend. Chin. J. Rock Mech. Eng. 2003, 22, 1863–1865. Shi, B.; Mu, C. Experiment Study on Water Injection and Moist Role for Outburst Prevention of Outburst Sea. Coal Sci. Technol. 2013, 41, 147–150. Pan, J.F.; Ning, Y.; Lan, H.; Peng, Y.-W.; Xia, Y.-X.; Wei, X.-Z.; Wang, S.-W. Water injection methods in coal bed based on experiments of water immersion time effect of Qianqiu coal samples with burst trend. J. China Coal Soc. 2012, 37, 19–25. Kang, T. The Study of permeability and classication on infusion in coal seam. Chin. J. Rock Mech. Eng. 1995, 14, 260–268. Yetkin, M.E.; Kahraman, B.; Özfırat, M.K.; S¸ engün, B.; S¸ im¸sir, F. Determination of travertine samples porosity using image analysis method. Indian J. Eng. 2017, 37, 227–235. Zou, M.; Wei, C.; Zhang, M.; Shen, J.; Chen, Y.; Qi, Y. Classifying coal pores and estimating reservoir parameters by nuclear magnetic resonance and mercury intrusion porosimetry. Energy Fuels 2013, 27, 3699–3708. [CrossRef] Mallı, T.; Yetkin, M.E.; Özfırat, M.K.; Kahraman, B. Numerical analysis of underground space and pillar design in metalliferous mine. J. Afr. Earth Sci. 2017, 134, 365–372. [CrossRef] Wang, E.; He, X.; Liu, X.; Li, Z.; Wang, C.; Xiao, D. A non-contact mine pressure evaluation method by electromagnetic radiation. J. Appl. Geophys. 2011, 75, 338–344. [CrossRef] He, X.; Chen, W.; Nie, B.; Mitri, H. Electromagnetic emission theory and its application dynamic phenomena in coal-rock. Int. J. Rock Mech. Min. Sci. 2011, 48, 1352–1358. [CrossRef] Wang, E.; Liu, X.; Zhao, E.; Liu, Z. Study of electromagnetic characteristics of stress distribution and sudden changes in the mining of gob-surrounded coal face. J. China Univ. Min. Technol. 2008, 18, 1–5. [CrossRef] Liu, X.; Wang, X.; Wang, E.; Kong, X.; Zhang, C.; Liu, S.; Zhao, E. Effects of gas pressure on bursting liability of coal under uniaxial conditions. J. Nat. Gas Sci. Eng. 2017, 39, 90–100. [CrossRef] © 2017 by the authors. Licensee MDPI, Basel, Switzerland. This article is an open access article distributed under the terms and conditions of the Creative Commons Attribution (CC BY) license (http://creativecommons.org/licenses/by/4.0/).