Journal of Applied Spectroscopy, Vol. 78, No. 3, July, 2011 (Russian Original Vol. 78, No. 3, May–June, 2011)
TIME-RESOLVED MULTISPECTRAL LUMINESCENCE METHOD FOR ANALYSIS OF MINERALS V. M. Lisitsyn, E. F. Polisadova,* D. T. Valiev, and O. V. Pavlov
UDC 535.243;535.37;543.42
We have developed a procedure for time-resolved luminescence analysis with excitation of samples by a nanosecond electron beam and recording the luminescence decay kinetics in four spectral bands. Using as an example analysis of different types of the mineral charoite, we have shown that the time variation of the ratio of radiation fluxes in selected spectral ranges spanning the UV, visible, and IR regions can be used for analytical purposes to identify or differentiate materials, and is an additional source of information about the sample. Keywords: luminescence analysis, multispectral method, time resolution, luminescence decay kinetics, electronbeam excitation, multichannel recording, rapid analysis, charoite. Introduction. There are a number of luminescence analysis techniques, distinguished by the methods for excitation and detection of luminescence. The most informative techniques use pulsed excitation sources (pulsed lamps, lasers, pulsed electron accelerators), letting us study both the spectral and the kinetic characteristics of luminescence of a sample, which together make it possible to reliably identify an object and to determine the nature of the luminescence centers. Use of pulsed high-current nanosecond electron beams for excitation provides additional options. First of all, the high power of the beam and the short exposure time make it possible to significantly increase the luminescence flash intensity and the signal-to-noise ratio, leading to increased sensitivity. Secondly, an electron beam is absorbed by practically any material, regardless of its optical properties (nonselective absorption), making it possible to initiate luminescence of centers with any excitation spectrum within the interior volume of the sample. However, the technology for such analysis is rather labor-intensive: the spectrum of the sample at a given instant of time is "recovered" from all the kinetic curves Iλ(t) recorded in a specified spectral range with step Δλ [1]. In order to study the dynamics of relaxation of the spectral properties of the sample over a broad temporal range with nanosecond resolution, we need to make a large number of measurements. The labor-intensiveness of the measurement process is an obstacle to broad application of highly informative techniques for time-resolved luminescence analysis. The multiple exposure to pulsed radiation fluxes needed for measurement of the spectrum can result in distortion of the information about the object under investigation. We know that exposure of a material to radiation can induce formation and accumulation of radiation defects and also a change in the properties of the sample during the measurements [2]. Obviously we need to develop a scheme that can enable detection of a change in the spectral composition of the emission over time after excitation by a single pulse. However, realization of such a scheme is practically impossible at present. Using a multiple-slit monochromator (polychromator) in combination with a photoelectron multiplier with good time resolution would result in a too complicated device that is difficult to control, inapplicable in many cases. Using multichannel radiation detectors [3] of the CCD linear array type, generally operating within "time windows", makes it possible to measure only the "exposure" of the optical signal from the sample, without providing the real pattern for the change in the spectral composition over time. One way to optimize the time-resolved luminescence analysis technique is to use the multispectral method [4], making it possible to record the luminescence flash and its relaxation over a broad temporal range while retaining information about the change in the spectra over time. ∗
To whom correspondence should be addressed.
Tomsk National Research Polytechnical University, 30 prosp. Lenina, Tomsk 634050; e-mail:
[email protected]. Translated from Zhurnal Prikladnoi Spektroskopii, Vol. 78, No. 3, pp. 448–453, May–June, 2011. Original article submitted December 1, 2010. 0021-9037/11/7803-0421 ©2011 Springer Science+Business Media, Inc.
421
Fig. 1. Block diagram of the experimental apparatus for multispectral luminescence analysis. The multispectral luminescence analysis technique involves the following. We know that after exposure to a short electron pulse, luminescence is excited in the sample with generally time-varying spectral composition. This is due to the fact that in any material capable of luminescence, an ensemble of luminescence centers exists with different spectral and temporal (lifetime in the excited state) characteristics, and there are energy transfer processes from center to center and interaction between centers. For example, practically all the energy of the exciting electron beam is absorbed by atoms of the matrix. Then the excitation energy of the matrix is transferred to the centers (defects), the relaxation of which is accompanied by luminescence characteristic for the corresponding centers. Obviously over time we should observe a change in the spectra, since each center has is own characteristic luminescence time. The multispectral method measures the change in the intensity of the luminescence over time in the selected spectral ranges. The spectral sensitivity of the optically detecting channels is selected based on the following considerations: 1) the spectral range of the emission to be measured should be completely covered by the overall sensitivity of all the detecting channels; 2) the spectral ranges for sensitivity of all the selected channels should be covered in such a way that at any wavelength, the emission is reliably detected by at least two measurement channels. When these conditions are satisfied, a change in the wavelength of the monochromatic radiation to be detected (or a change in the spectrum of nonmonochromatic radiation) will unambiguously result in a change in the ratio of the signals for the response of the optical channels. Consequently, a change in the spectral composition can be identified by the multispectral method. The approach described is similar to how color vision works. The luminescence region for most materials falls within the range 200–1000 nm. Radiation detectors exist for this range that can detect signals with nanosecond time resolution. In [4], it is shown that it is optimal to use four bands (and four detecting channels respectively). This is sufficient for good discrimination between emissions in different spectra. In this case, it seems feasible to record with nanosecond time resolution, employing widely used fourchannel digital oscilloscopes and on-the-fly data processing. It is also important in the multispectral method that the measurements be made within broad spectral ranges in each band. Therefore the sensitivity requirements for the measurement circuits in the multispectral method are much lower than those for direct spectral measurements. Experimental Procedure. Figure 1 gives a block diagram of the experimental apparatus for multispectral luminescence analysis. The analyte sample 3, placed in measurement cell 4, is exposed to an electron flux with average energy 250 keV and pulse duration ~10 ns at half height, generated by a small high-current electron accelerator 1 with power supply 2. The light flux from the sample is collected by short-focus lens 5 and forms a spot with uniform distribution of illumination at the input end of fiber optic cable 6, at a distance 10–15 cm from the sample. The light flux is transferred to radiation detectors 8 along quartz optical fiber 6 through light filters 7. The lens in the layout fulfills two functions: collection of the luminescence flux and spatial separation of the optical elements from the radiation flux used for excitation of secondary bremsstrahlung fluxes. As the radiation detectors, we used Hamamatsu H5773-04 photodetector modules. The range of its sensitivity spectrum is divided into four overlapping spectral bands: N1 = 250–400 nm, N2 = 350–600 nm, N3 = 500–750 nm, 422
Fig. 2. Sensitivity spectra of the spectral bands selected by correcting light filters: N = the photocathode of the Hamamatsu H5773-04 photodetector module, N1 = UVS2, N2 = SZS22, N3 = combination of light filters SZS25 and OS17, N4 = KS14.
N4 = 630–850 nm. To select the bands, we used correcting light filters: for the N1 band, UFS2; for the N2 band, SZS22; for the N3 band, a combination of filters SZS25 and OS17; for the N4 band, KS14. Figure 2 shows the sensitivity spectra of the measurement channels. The signals from the radiation detectors were fed to the four-channel oscilloscope 9 with 350 MHz bandwidth (LeCROY-WR 6030A). The sensitivities of the channels were normalized, and the oscilloscope was triggered by the leading edge of the signal. The kinetic curves for decay of the luminescence flash in each band was recorded in the specified temporal range and was stored in the data base of PC 10. For better convergence, the results were averaged over several measurements. The temporal range in which techniques for measuring the luminescence decay kinetics have been rather well –8 –3 worked out is 10 to 10 seconds. Since within this time the signal amplitude can vary by several orders of magnitude, in a single measurement cycle (excitation — recording of the kinetics), we can record with high resolution (quality) one kinetic curve within two orders of magnitude relative to time. In order to span the entire indicated interval, in which luminescence decay also mainly occurs, we need to record in two or three steps, individually selecting the time resolution and sensitivity of the measurement channels and later "stitching together" the kinetic curves. Then from the measurement results for the kinetic curves for relaxation of luminescence in four spectral bands, we calculated the kinetics of the change in the relative band emission coefficients (RBE coefficients). The RBE coefficient is a quantity dependent on time and characterizing the relative fraction of the radiation flux in the corresponding spectral band at a specified instant of time: n
Ki (t) = i (t) Φi
⁄ ∑i i=1
Φi
(t)
(1)
where Ki(t) is the relative band emission coefficient for the i-th band at the instant of time t; iΦi(t) is the signal magn
nitude in the i-th band at that instant of time; ∑ iΦi(t) is the sum of the signals over all the bands. Obviously the sum i=1 n
∑ Ki = 1 for any instant of time. i=1
The ratio of the RBE coefficients in the four bands determines the "nominal color" of the emission, which can vary during luminescence decay. By color we mean the ratio of the responses of the visual receptors of the eye. In our case, the "nominal color" is a characteristic of the ratio of the response of the four channels, which in principle 423
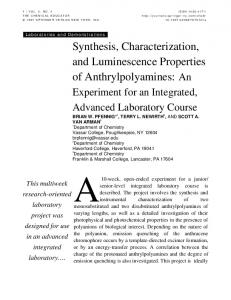
Fig. 3. Time variation of the relative band emission coefficients (RBE coefficients) for three charoite samples: a) violet charoite block; b) violet fibrous charoite; c) asbestiform charoite (finely fibrous with whitish tinge).
is similar to the visual response but differs from it due to the difference in the number of detector channels and their spectral sensitivity. The measurement results for the kinetics were processed by means of specialized software developed in the LabVIEW graphical programming environment. The program allows us to average the measurement results, to visualize the luminescence decay kinetics in the bands, to calculate the RBE coefficients, to sample the RBE coefficients with a specified time step, and to store the information in the database. The set of RBE coefficients in the form of a numerical data file is an "identity card" for the sample which we can use to identify an object. Results and Discussion. We studied relaxation of luminescence in samples of three different types of the natural mineral charoite: violet charoite block, asbestiform charoite (finely fibrous with whitish tinge), and violet fibrous charoite. The results of the investigation are shown in Fig. 3, as the RBE coefficients in four spectral bands vs. the time relative to the time of excitation. The time dependences of luminescence relaxation were measured in the –8 –6 –6 –3 ranges 10 to 10 seconds and 10 to 10 seconds, then the kinetic curves were "stitched together" by computer processing and the time dependences of the RBE coefficients were calculated. As follows from Fig. 3, from 10 ns to 1 μs luminescence in the N1 and N2 bands, spanning the UV and blue–green regions of the spectrum, is dominant in the luminescence of charoites. The nature of the change in the RBE coefficients in bands N3 and N4 (yellow and red regions of the spectrum) in this time range is similar to that observed for samples 1 and 2; for sample 3, the ratio of the coefficients changes in the N3 and N4 bands. For t > 1 μs, the ratio of the RBE coefficients in the spectral bands begins to appreciably change: luminescence in the yellow and red regions of the spectrum becomes dominant, and the ratio of the fluxes in these bands and the course of the kinetics are individual for each charoite sample; in this case, the fraction of the flux in the N1 and N2 bands (blue and green regions of the spectrum) is close to zero. 424
Fig. 4. Pulsed cathodoluminescence spectra of violet charoite block (1), asbestiform charoite (2), violet fibrous charoite (3), measured at the initial instant of time after excitation by an electron pulse (a) and after 5 ms (b). Figure 4 shows the luminescence spectra, measured by pulsed time-resolved cathodoluminescence spectrometry [1], for three samples at different instants of time relative to the time of excitation. The spectra measured at the initial instant of time have a maximum in the UV region (Fig. 4a) and are somewhat different in shape: here the luminescence decays within a nanosecond interval (the duration is comparable with the duration of the exciting pulse). Luminescence in the 580–600 nm region (Fig. 4b) with decay time of tens of milliseconds is also typical for charoite; the position of the maximum and the shape of the spectrum vary from sample to sample. On the whole, we may note that the spectral characteristics of the different types of charoites are similar. The intensity ratio of the spectra due to nanosecond and millisecond components in the decay kinetics is indefinite. The multispectral measurements allow us to make such estimates with some tolerance and to trace the time interval when the ratio of the fluxes changes. Thus –6 –5 in the interval 10 to 10 seconds, for charoite the luminescence in the yellow and red regions (N3 and N4 bands) is dominant. A characteristic orange-red emission band (580–610 nm) with millisecond decay time falls within this spectral range. Luminescence of nanosecond duration, falling within the UV and visible regions (N1 and N2 bands), is practically quenched. Thus the multispectral method of luminescence analysis makes it possible to distinguish between objects rather well from the kinetic characteristics of the relative band emission coefficients, to identify and differentiate samples. It is important that information about the dynamics of the RBE coefficients, and consequently information about the sample, be represented in the form of a data file (in digital form). Representation in the form of a data file simplifies processing and storing the results, and makes it possible to use computer software to analyze the results. Conclusion. The proposed method of multispectral luminescence analysis with multichannel recording and excitation of the samples by a nanosecond electron beam makes it possible to develop a highly informative and highly sensitive technique for rapid analysis of materials. We show that changes in the relative band emission coefficients collectively reflect the spectral and kinetic characteristics of the luminescence. Assessment of the relative radiation fluxes in the bands and the time variation of such fluxes represent an effective way to create databases on the luminescent characteristics of materials. Using a band-based recording scheme allows us to obtain information about the emissive characteristics of an object simultaneously over broad spectral and temporal ranges; to significantly enhance the sensitivity (since luminescence is detected in a broad region for each spectral band); and to reduce the radiation load on the sample owing to the use of a multichannel recording system. The analytical possibilities of such an analysis method are rather considerable: the technique makes it possible to estimate the intensity ratios for spectral components with decay times differing by an order of magnitude. The technique described will be popular in areas where a large number of samples must be tested without detailed deciphering of spectra and high discrimination is required. The technique can be used for designing automatic systems for analysis of the spectral and kinetic characteristics of luminescence.
425
REFERENCES 1. 2. 3. 4.
426
V. I. Korepanov, V. M. Lisitsyn, and V. I. Oleshko, Izv. Vuzov. Fizika, 43, No. 3, 22–30 (2000). V. M. Lisitsyn, V. I. Korepanov, and V. Yu. Yakovlev, Izv. Vuzov. Fizika, 11, 5–29 (1996). S. G. Mikhailov, V. V. Osipov, and V. I. Solomonov, Zh. Tekh. Fiz., 63, No. 2, 52–63 (1993). V. M. Lisitsyn, L. A. Lisitsyna, V. I. Oleshko, E. F. Polisadova, and A. N. Yakovlev, Izv. Mezhdunar. AN Vyssh. Shkoly, 2, No. 28, 134–144 (2004).