MBoC | ARTICLE
Tissue-nonspecific alkaline phosphatase promotes axonal growth of hippocampal neurons M. Díez-Zaeraa, J. I. Díaz-Hernándeza, E. Hernández-Álvareza, H. Zimmermannb, M. Díaz-Hernándeza,*, and M. T. Miras-Portugala,* a
Department of Biochemistry and Molecular Biology IV, Facultad de Veterinaria, Universidad Complutense de Madrid, Madrid 28040, Spain; bInstitute of Cell Biology and Neuroscience, Biocenter, J. W. Goethe-University, Frankfurt 60438, Germany
ABSTRACT Axonal growth is essential for establishing neuronal circuits during brain development and for regenerative processes in the adult brain. Unfortunately, the extracellular signals controlling axonal growth are poorly understood. Here we report that a reduction in extracellular ATP levels by tissue-nonspecific alkaline phosphatase (TNAP) is essential for the development of neuritic processes by cultured hippocampal neurons. Selective blockade of TNAP activity with levamisole or specific TNAP knockdown with short hairpin RNA interference inhibited the growth and branching of principal axons, whereas addition of alkaline phosphatase (ALP) promoted axonal growth. Neither activation nor inhibition of adenosine receptors affected the axonal growth, excluding the contribution of extracellular adenosine as a potential hydrolysis product of extracellular ATP to the TNAP-mediated effects. TNAP was colocalized at axonal growth cones with ionotropic ATP receptors (P2X7 receptor), whose activation inhibited axonal growth. Additional analyses suggested a close functional interrelation of TNAP and P2X7 receptors whereby TNAP prevents P2X7 receptor activation by hydrolyzing ATP in the immediate environment of the receptor. Furthermore inhibition of P2X7 receptor reduced TNAP expression, whereas addition of ALP enhanced P2X7 receptor expression. Our results demonstrate that TNAP, regulating both ligand availability and protein expression of P2X7 receptor, is essential for axonal development.
Monitoring Editor Kozo Kaibuchi Nagoya University Received: Sep 1, 2010 Revised: Dec 21, 2010 Accepted: Jan 19, 2011
INTRODUCTION Axonal outgrowth is central to the processes of brain development when neurons establish precise connectivity patterns as well as to the processes of regeneration and brain repair in the adult CNS.
This article was published online ahead of print in MBoC in Press (http://www .molbiolcell.org/cgi/doi/10.1091/mbc.E10-09-0740) on February 2, 2011. *These authors contributed equally to this work. Address correspondence to: Miguel Díaz-Hernández (
[email protected]). Abbreviations used: ADA, adenosine deaminase; ALP, alkaline phosphatase; ANOVA, analysis of variance; BBG, brilliant blue G; BCIP, 5-bromo-4-chloro-3-indolyl phosphate; CaMKII, calcium/calmodulin-dependent kinase II; CPA, N6cyclopentyladenosine; DIV, day in vitro; E, embryonic day; EGFP, enhanced green fluorescent protein; GAPDH, glyceraldehyde-3-phosphate dehydrogenase; GFP, green fluorescent protein; GSK-3, glycogen synthase kinase 3; HEK, human embryonic kidney; MAP2, microtubule-associated protein 2; NTB, nitroblue tetrazolium; RT, reverse transcription; SEM, standard error of the mean; shRNA, shorthairpin RNA; TNAP, tissue-nonspecific alkaline phosphatase. © 2011 Díez-Zaera et al. This article is distributed by The American Society for Cell Biology under license from the author(s). Two months after publication it is available to the public under an Attribution–Noncommercial–Share Alike 3.0 Unported Creative Commons License (http://creativecommons.org/licenses/by-nc-sa/3.0). “ASCB®,“ “The American Society for Cell Biology®,” and “Molecular Biology of the Cell®” are registered trademarks of The American Society of Cell Biology.
1014 | M. Díez-Zaera et al.
Axonal growth and guidance represent highly coordinated processes controlled by a variety of extracellular and intracellular signaling cues. Opposing permissive (e.g., growth factors) and repulsive signals (e.g., semaphorins, ephrins, netrins, and myelin-secreted inhibitory glycoproteins) have been identified. These signals can be short ranged and locally derived or secreted, diffusible, and long ranged (Gomez and Zheng, 2006; Hou et al., 2008; O’Donnell et al., 2009). Recently, our group has demonstrated that extracellular ATP negatively controls axonal growth and branching in cultured hippocampal neurons (Diaz-Hernandez et al., 2008) and inhibits neuritogenesis in Neuro 2a neuroblastoma cells (Gomez-Villafuertes et al., 2009). Similarly ATP was found to reduce neurite extension from motoneuron-containing neural tube explants of rat embryos at embryonic day (E) 12 (Cheung et al., 2005). In contrast, extracellular adenosine induced neurite elongation in human neuroblastoma cells (Abbracchio et al., 1989). Acting as a fast signal substance in the CNS, ATP exerts its function via P2X receptors, a family of ATP-gated cation channels (Burnstock, 2007). Activation of presynaptic P2X receptors promotes an increase in intracellular Ca2+ levels, and the subsequent activation Molecular Biology of the Cell
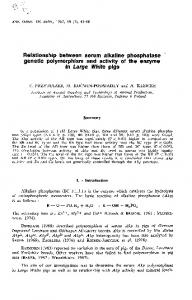
RESULTS TNAP regulates extracellular ATP levels in cultured hippocampal neurons Hippocampal neurons initially plated in culture revealed no discernible neurites. Within the next 72 h, neurons started to grow extensive microtubule-associated protein 2 (MAP2)–positive neurites (Figure 1, A1 and A2). One of these became the axon and could be identified with anti–Tau-1 antibodies (Figure 1, A3). Interestingly, the culture supernatant contained significant levels of ATP (2.28 ± 0.38 μM) that considerably declined with increasing postplating time. The fastest loss occurred during the first 24 h (Figure 1B), reaching a value of 0.33 ± 0.14 μM of ATP after 72 h. As shown by quantitative immunoblotting, the decrease in extracellular ATP levels was paralleled by an increase in neuronal expression of the ectonucleotidase TNAP (Figure 1C). In accordance with that, TNAP activity increased by a factor of 7.58 ± 0.8 during the first 72 h (Supplemental Figure S1). We therefore investigated whether the extracellular ATP levels could be causally linked to TNAP activity. Addition of ALP (4 U/ml) to the culture media induced a rapid and persistent loss of extracellular ATP (Figure 1D). Moreover, specific inhibition of endogenous TNAP activity with levamisole (500 μM) (Kozlenkov et al., 2004; Langer et al., 2007) significantly elevated extracellular ATP concentrations at each time point (Figure 1D), suggesting that endogenous TNAP can control extracellular ATP levels.
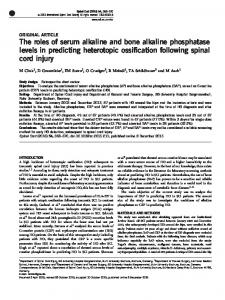
TNAP promotes axonal but not dendritic elongation Double immunolabeling of neurons for TNAP and βIII-tubulin or Factin staining (Alexa Fluor 594 phalloidin) revealed a strong somatic and axonal and a weaker dendritic localization of TNAP (Figure 2A). TNAP immunostaining was most intense at the most distal axon reVolume 22 April 1, 2011
1
24 h
B
Tau 1 Map 2 2
72 h
Tau 1 Map 2 3
C
Tau 1 Map 2
4
2
1
0
24
48
72
Time (h)
24
48
72
Time (h)
24
48
72
Time (h)
1.0 0.9 0.8 0.7 0.6
TNAP α-Tubulin
D 5
3
1.1
TNAP/α -Tubulin
48 h
Extracellular ATP levels (µM)
A
Extracellular ATP levels ( µ M)
of protein kinases such as calcium/calmodulin-dependent kinase II (CaMKII), p38 mitogen-activated protein kinase, or glycogen synthase kinase 3 (GSK-3) (Armstrong et al., 2002; Gomez-Villafuertes et al., 2009), and stimulates vesicular neurotransmitter release (Gomez-Villafuertes et al., 2001; Diaz-Hernandez et al., 2002b; Gualix et al., 2003). The availability and half-life of extracellular ATP is governed by ectonucleotidases that sequentially hydrolyze the nucleotide to adenosine (Robson et al., 2006; Zimmermann, 2006). Adenosine functions as a major negative neuromodulator in the CNS. It activates presynaptic metabotropic receptors to promote inhibition of neurotransmitter release and to reduce neuronal excitability (Fredholm et al., 2005). Ectonucleotidases belong to several protein families that differ regarding their functional and molecular properties (Zimmermann, 2006). The alkaline phosphatase (ALP) family releases Pi from a variety of organic compounds and is capable of degrading nucleoside 5′-tri-, -di-, and -monophosphates, eventually producing adenosine from extracellular ATP. The mammalian isoforms share an alkaline pH optimum and are anchored to the membrane via a glycosylphosphatidylinositol anchor (Millan, 2006). Tissue-nonspecific ALP (TNAP) is expressed in a multitude of tissues including liver, bone, kidney, and brain. In the adult mammalian CNS, TNAP represents the only isoform of ALPs and is associated with the blood vessel endothelium and with neuropil, including synaptic contacts (Langer et al., 2008). By controlling extracellular levels of ATP and adenosine ectonucleotidases could play a pivotal role in the control of neurite development. In the present work we analyzed the role of TNAP and its interaction with a specific ATP receptor (P2X7 receptor) in axonal growth using cultured hippocampal neurons as a well established model system (Dotti et al., 1988).
*
**
** ****
3
*
2
*
1 0
AP Levamisole
- + - - +
Time (h)
24
-
+
-
48
+
- + - - + 72
Figure 1: Increased TNAP expression in differentiating cultured hippocampal neurons reduces extracellular ATP levels. (A) Representative images of hippocampal neurons, stained with anti–Tau-1 (green) and anti-MAP2 (red) antibodies to illustrate their morphology during the first 72 h of culture. (A1) Emerging neurites (at 24 h). (A2) One of the neurites takes the lead (at 48 h). (A3) Axon as identified by anti–Tau-1 immunofluorescence and dendrites further grow and branch (at 72 h). Scale bar, 50 μm. (B) Extracellular ATP levels in the medium of hippocampal neurons cultured for 1, 2, and 3 d in vitro (DIV). Values represent mean ± SEM of six experiments in triplicate. (C) Western blots of TNAP in cultured hippocampal neurons at 1, 2, and 3 DIV. α-Tubulin served as a loading control. Representative immunoblots probed for TNAP are shown at the bottom of the graph. Values represent mean ± SEM (n = 3). (D) Effects of ALP (4 U/ml) and levamisole (500 μM) on extracellular ATP levels in the medium of hippocampal neurons cultured for 1, 2, and 3 DIV. Values represent mean ± SEM of five experiments in triplicate. *p < 0.05, **p < 0.01, and ****p < 0.0001 vs. control (unpaired t test).
gions. Furthermore TNAP immunoreactivity typically revealed a dotted pattern both in the principal axonal growth cone and in most of the actin-rich branching points of the primary axon (Figure 2, A and B). TNAP catalytic activity was identified in the identical locations by enzyme histochemical staining using the 5-bromo-4-chloro-3-indolyl phosphate/nitroblue tetrazolium (BCIP/NBT) reaction. It was present in the entire neuron and was strongest in the soma and at the axonal growth cone (Figure 2C). We therefore investigated whether TNAP activity is related to axonal or dendritic growth, in both hippocampal and cortical neurons. Neurons were stained with anti–Tau-1 and anti-MAP2 antibodies to evaluate the specific effects of TNAP on axons and dendrites, respectively (Figure 3A and Supplemental Figure S2A). When grown TNAP induces axonal elongation | 1015
A
TNAP ? -III-tubulin
B
TNAP Phalloidin
C
TNAP
esis and triggered neuronal death. In accordance with the inhibitory effect of levamisole, addition of ALP to the culture media induced a considerable increase in total axonal length (Figure 3, A and B; Supplemental Figure S2, A and B). This concerned a significant elongation of both the principal axon and secondary axon branches. But in hippocampal neurons, the number of secondary ramifications was unaltered (Figure 3, A and B). The ALP-induced axonal elongation was concentration dependent with a half-maximal effective concentration value of 1.62 ± 0.34 U/ml, and maximal axonal growth was obtained at 4 U/ml (Figure 3D). As for levamisole, exogenous ALP (4 U/ml) had no significant effect on dendrite length (Figure 3B). We further analyzed the effect of TNAP over expression and knockdown on axonal growth by cell transfection using plasmids encoding green fluorescent protein (GFP), TNAP, and TNAP-targeting short-hairpin RNA (shRNA). The efficiency of the commercial shRNA TNAP for TNAP knockdown was verified using a human cell line (human embryonic kidney [HEK] 293T) transfected to overexpress the mouse TNAP enzyme (Supplemental Figure S3). The specificity of commercial shRNA TNAP used was confirmed by checking that it was able to prevent the protein expression of murine wildtype TNAP full-length cDNA, but not the protein resistant to the shRNA sequence generated by a site-directed mutated TNAP cDNA (TNAPmut) (Supplemental Figure S3). Subsequently hippocampal and cortical neurons were transfected with the TNAP-, TNAPmut-, and shRNA TNAP–containing vector at 1 d in vitro (DIV) and fixed at 3 DIV to examine the length and ramifications of their axons. As compared with transfection with GFP alone, TNAP knockdown induced shortening of the principal axon and of the axonal branches (Figure 4, A–C) while the expression of TNAP and TNAPmut induced axonal elongation and branches either in hippocampal neurons (Figure 4B) or cortical neurons (Supplemental Figure S2, C and D). In addition, the concomitant transfection of neurons with TNAP and shRNA TNAP abrogated the negative effect of TNAP knockdown on axonal growth. However, when neurons were cotransfected with TNAPmut and shRNA TNAP, the axons grew in a similar range to that observed on neurons transfected with TNAP or TNAPmut (Figure 4, A and B). These data suggest that endogenous neuronal TNAP activity is essential for proper axon extension.
Adenosine does not affect the first steps of axonal growth
Figure 2: Localization of TNAP in cultured hippocampal neurons. (A and B) Cultured hippocampal neurons double stained with antibodies against TNAP (green) and βIII-tubulin (red) (A), and TNAP (green) and actin (red) (B). Images represent mergers of both channels. (C) TNAP catalytic activity in neurons. Inserts represent 2× magnifications of the boxed regions. Scale bars, A and C, 50 μm; B, 25 μm.
in the presence of levamisole (500 μM), neurons developed significantly shorter axons (Figure 3, A and B; Supplemental Figure S2, A and B). The inhibitory effect of levamisole on total axonal length was concentration dependent with a half-maximal inhibitory concentration value of 523.1 ± 162.8 μM (Figure 3C). In contrast, levamisole (500 μM) had no effect on dendrite length (Figure 3B). In addition, at a concentration of 5 mM levamisole entirely abolished neuritogen1016 | M. Díez-Zaera et al.
As an ectonucleotidase, TNAP hydrolyzes extracellular ATP or ADP, thus limiting their effects on P2 receptors, and simultaneously produces extracellular adenosine that acts via adenosine-specific receptors (Zimmermann, 2006). We thus investigated the possibility that the effects of TNAP on axonal growth are mediated by extracellular adenosine. Treatment of neurons with 10 nM adenosine to activate A1 and A2 adenosine receptors or with the selective A1 receptor agonist, N6-cyclopentyladenosine (CPA), induced no significant changes in axonal growth (Figure 5). Similar results were obtained when neurons were treated with 10 μM adenosine to activate A3 receptors (Figure 5). To fully discard a participation of adenosine in TNAP-mediated axonal growth, we added to the culture medium adenosine deaminase (ADA, 0.2 U/ml), an enzyme that converts adenosine to its inactive metabolite, inosine (Cristalli et al., 2001). ADA itself had no significant effect on the length of principal and secondary axons (Figure 5, D and G). Moreover, when coapplied with ALP, ADA could not reverse the axonal growth induced by ALP (Figure 5, F and G).
Coordinated action of TNAP and P2X7R on axonal growth
We therefore investigated the possibility that TNAP exerts its effects by eliminating extracellular ATP. This notion was supported Molecular Biology of the Cell
Tau-1 Map 2 Dapi
*** 200
100
0
AP Levamisole
*
- + - - +
250 200
***
150 100
*
50 0
3
Levamisole
Tau-1 Map 2 Dapi 350
**
300 200 100 0
Total number of axonal ramifications
300
Principal axonal length (%)
B
Total axonal length (%)
Tau-1 Map 2 Dapi
2
AP
- + - - +
- + - - +
4 3 2 1 0
- + - - +
Total dendritic length (%)
1
Control
Total length of axonal ramifications (%)
A
150 100 50 0
- + - - +
D
C
300
Axonal Lenght (%)
Axonal Lenght (%)
100 75 50 25 0
-4
-3
200 150 100
IC50 523,13 ± 162,82 µM -5
250
EC50 1,62 ± 0,34 U/ml
0 -2
Log [ Levamisole] M
0
8
16
Alkaline Phosphatase (U/ml)
Figure 3: Effect of TNAP on axonal growth. (A) Representative images of hippocampal neurons (immunostained for Tau-1 [green] and MAP2 [red] to differentiate between axons and dendrites) cultured for 3 DIV in the absence (1) or presence of ALP (4 U/ml, 2) and of levamisole (500 μM, 3). 4′,6-Diamino-2-phenylindole–stained nuclei are in blue. Scale bar, 50 μm. (B) Quantification of axonal length and the number of ramifications from experiments shown in (A). The total axonal length (corresponding to the principal axon plus ramifications), length of the principal axon, length of the axonal ramifications, number of axonal ramifications, and dendritic length were analyzed. The 100% values in control neurons for total axonal length, principal axon length, and length of ramifications correspond to 214.5 ± 13.4 μm, 158.6 ± 10.9 μm, and 43.1 ± 7.1 μm, respectively. The number of axonal ramifications in control neurons was 1.8 ± 0.3. The total length of the dendritic processes includes its ramifications. The 100% value of the total dendritic length in control neurons corresponds to 31.1 ± 2.6 μm. Values represent the mean ± SEM (n = 4) with at least 20 neurons analyzed in each experiment. *p < 0.05, **p < 0.01, and ***p < 0.001 vs. control (one-way analysis of variance [ANOVA]). (C and D) Concentration-response curves for the effect of levamisole (C) and ALP (D) on axonal growth of hippocampal neurons maintained for 3 DIV. Values represent mean ± SEM (n = 3) with at least 30 neurons analyzed in each experiment.
by our recent work describing ATP acting via P2X7 receptors as a negative modulator of axonal growth and branching (DiazHernandez et al., 2008). Double immunostaining with antibodies against TNAP and P2X7 revealed that the two proteins were colocalized in microdomains of the growth cones (Figure 6, A–C). Furthermore axonal growth induced by inhibition of P2X7 receptors with 1 μM brilliant blue G (BBG) (Michel et al., 2007) (Figure 6, F, J, and K) or 1 μM A438079 (Honore et al., 2006; McGaraughty et al., 2007) (Figure 6, J and K) was reverted when TNAP activity was inhibited by levamisole (Figure 6, G, J, and K), suggesting Volume 22 April 1, 2011
that increased extracellular ATP levels reduced the effect of the inhibitors. Similarly, when neurons were cultured in the presence of BBG or A438079, levamisole no longer inhibited axonal growth (Figure 6, D, G, J, and K). Coapplication of ALP (4 U/ml) and BBG (1 μM) was no more effective on axonal growth than application of either ALP or BBG alone (Figure 6, D, F, and H–K). Because our previous work had shown that overexpression of P2X7 receptors reduces axonal length and branching (Diaz-Hernandez et al., 2008) (Figure 7, A and B), we investigated whether this effect could be reverted by TNAP. Neurons TNAP induces axonal elongation | 1017
TNAP IRES
GFP Total axonal length (%)
400
***
300 200 100
**
0
TNAP IRES TNAP mut sh RNA TNAP Total length of axonal ramifications (%)
***
***
-
600
+
-
+
-
- + - - + +
***
400
***
200
0
TNAP IRES TNAP mut sh RNA TNAP
-
+
-
C
+
-
- + - - + +
300
+ +
***
*** ***
200
100
0
+ +
***
4
TNAP mut
GFP
GFP
GFP
B
3
2 shRNA TNAP
Principal axonal length (%)
1
Total number of axonal ramifications
A Control GFP
**
-
+
-
+
-
+
-
- + - - + +
+ +
4
3
2
0
-
+
-
- + - - + +
+ +
In an additional series of experiments, we tested the possibility that axonal growth and branching induced by knockdown of P2X7 receptors (Diaz-Hernandez et al., 2008) could be counterbalanced by silencing TNAP expression. Indeed, parallel neuronal knockdown of P2X7 receptors and TNAP permitted normal neuronal axon development and reversed the axonal growth impairment induced by shRNA TNAP (Figure 7, D–F and H). A higher neuronal axon development was observed when the hippocampal neurons were cotransfected with P2X7 and TNAP (Figure 7G). These data suggested that TNAP-induced stimulation of axonal growth is mediated by enzymatic degradation of ATP, the growth-inhibiting P2X7 receptor agonist. We therefore searched for possible interrelations in the expression of the two proteins. We quantified the levels of TNAP mRNA in the presence of the P2X7 receptor antagonist BBG and the levels of P2X7R mRNA in the presence of exogenously added ALP (3 d each). Treatment of hippocampal neurons with BBG induced a significant decrease in TNAP mRNA levels (35.4 ± 9.3%), and treatment with exogenous ALP increased the levels of P2X7 mRNA (93.3 ± 40.8%) (Figure 7, I and J).
DISCUSSION
In this study we provide evidence that the ectonucleotidase TNAP in concert with the ionotropic P2X7 ATP receptor governs the axonal growth in neurons. ATP is a short-lived and short-ranged extracellular signaling molecule whose lifetime is controlled by cell surface–located ectonucleotidases. TNAP is colocalized at axonal growth cones with the P2X7 receptor. By eliminating extracellular ATP, TNAP prevents the activash RNA TNAP Merge ? III tubulin tion of P2X7 receptors, which are inhibitory Figure 4: Expression of TNAP control axonal growth. (A) Hippocampal neurons transfected at to axonal growth. This novel purinergic sig1 DIV with pEGFP (1), TNAP IRES (2), shRNA TNAP (3), or TNAPmut (4) and fixed at 3 DIV. Scale naling mechanism involving TNAP and the bar, 50 μm. (B) Effect of overexpression of wild-type or mutant TNAP and silencing of TNAP on P2X7 receptor could be critically involved in axon length and the number of ramifications in hippocampal neurons. The total axonal length the control of axonal growth during devel(corresponding to the principal axon plus ramifications), length of the principal axon, and length opment but also during axonal regeneration and number of the axonal ramifications were analyzed. The 100% values in control neurons for in the adult brain. total axonal length of EGFP-transfected neurons, principal axon length of EGFP-transfected P2X7 receptors are ATP-gated, nonseneurons, and length of ramifications correspond to 310.8 ± 28.0 μm, 242.4 ± 28.7 μm, and lective ion channels permeable to Na+, K+, 126.9 ± 24.2 μm, respectively. The number of axonal ramifications in EGFP neurons was 2.6 ± and Ca2+. This confers to them the ability 0.9. Values represent mean ± SEM (n = 5) with at least 20 neurons analyzed in each experiment. to act as direct conduits for Ca2+ influx in *p < 0.05, **p < 0.01, ***p < 0.001 (one-way ANOVA). (C) Representative images of electroporated neurons with shRNA TNAP and its neighboring nontransfected neurons the absence of membrane depolarization (immunostained with βIII-tubulin [red]). Scale bar, 50 μm. (Khakh and North, 2006). Intracellular Ca2+ dynamics play a central role in the control overexpressing P2X7-GFP and treated with exogenous ALP develof neuronal motility including axonal growth and guidance oped axons of similar length as neurons transfected with a plasmid (Gomez and Zheng, 2006). In a previous study we demonstrated expressing GFP alone (Figure 7G). Similar results were obtained that axonal growth of cultured hippocampal neurons is inhibited when neurons transfected with the P2X7-IRES-GFP plasmid, which by extracellular ATP via the P2X7 receptor. This was correlated independently encodes the P2X7 receptor and GFP, were treated with the CaMKII-dependent regulation of actin-associated prowith ALP (Figure 7, B, C, and G). teins (Diaz-Hernandez et al., 2008). Similar to our findings in the 1018 | M. Díez-Zaera et al.
Molecular Biology of the Cell
ALP and TNAP overexpression are able by themselves to promote axonal growth as both remove the basal extracellular ATP. Second, electroporation data showed that effects induced by TNAP are restricted to neurons that express this protein, without affecting neighboring cells. Finally, the ATP levels reached at the growth cone are high enough to activate the P2X7 receptor, which is the P2 receptor with lower affinity for ATP. We further show that the ATP hydrolysis product adenosine is not involved ? -III-tubulin ? -III-tubulin ? -III-tubulin in the control of neural axonal outgrowth. CPA F ADA E AP + ADA D The data presented reveal that TNAP and the P2X7 receptor exhibit a dotted distribution on the axonal growth cones and that both proteins are also very closely functionally interrelated. Knockdown of the P2X7 receptor increases axon length and has the opposite effect as TNAP knockdown— whereby knockdown of both proteins counterbalances the effect. Similarly, overexpression of the P2X7 receptor reduces axonal length, and it was reverted by overexpres? -III-tubulin ? -III-tubulin ? -III-tubulin sion of TNAP or addition of ALP. However, while addition of exogenous ALP only comG NS pensates to return to control levels, the NS 250 300 overexpression of TNAP was able to signifi*** cantly increase axonal length. This discrep200 * *** *** ancy can be explained by considering that 200 150 overexpression of TNAP specifically hydro100 lyzes ATP at the environment of the P2X7 100 receptor on the axonal growth cone. On the 50 other hand, the fact that ALP treatment of 0 hippocampal neurons increased P2X7 mRNA 0 levels and P2X7 antagonism decreased - + - - - - + AP - + - - - - + TNAP mRNA levels indicates a coordinated - - + - - - Ado 10 nM - - + - - - regulation of these two proteins at the tran- - - + - - Ado 10 µM - - - + - - scriptional level. At present little is known - - - - + - CPA - - - - + - regarding the transcriptional regulation of - - - - - + + ADA - - - - - + + the P2X7 receptor and TNAP. TNAP expression is enhanced by retinoic acid (Zhou Figure 5: Lack of effects of adenosine on ALP-induced axonal growth. (A–F) Hippocampal neurons were cultured for 3 DIV in the absence (A) or presence of adenosine (Ado, 10 μM) et al., 1994). In previous studies we demon(C) or the A1 adenosine receptor agonist CPA (50 nM) (E) and in the presence of exogenous ALP strated that inhibiting the P2X7 receptor in(4 U/ml) (B). Neurons were also treated with ADA (0.2 U/ml) in the absence (D) or presence (F) of duces phosphorylation of GSK-3 and thus exogenous ALP (4 U/ml). They were fixed and immunostained for βIII-tubulin (green) for analysis inhibits its catalytic activity (Diaz-Hernandez of axonal length. Scale bar, 50 μm. (G) Analysis of axonal length corresponding to the et al., 2008; Gomez-Villafuertes et al., 2009). experiments shown in A–F. The 100% values in control neurons for total axonal length, principal GSK-3 activity in turn can regulate transcripaxon length, and length of ramifications correspond to 198.9 ± 9.8 μm, 148.2 ± 7.7 μm, and 31.3 ± tion factors (Grimes and Jope, 2001; Ortega 4.4 μm, respectively. Values represent mean ± SEM (n = 3) with at least 25 neurons analyzed in et al., 2010), potentially modulating TNAP each experiment. *p < 0.05 and ***p < 0.001 vs. control; NS, nonsignificant (one-way ANOVA). mRNA levels. Moreover, enhanced P2X7 receptor activation and increased intracellular Ca2+ concentrations could mediate the direct interaction of Ca2+neuronal culture supernatant, extracellular ATP is present in the sensitive proteins with regulatory elements within the DNA sebrain extracellular space. It may be released via exocytosis or quence. through membrane channels, or it may be derived from damaged TNAP is expressed in a variety of mammalian tissues, but little is cells (Abbracchio et al., 2009). Although ATP levels measured in known concerning its functional role. The best investigated function our experimental conditions are in micromolar range, it is necesconcerns its involvement in bone mineralization and remodeling sary to take into account that this value is the result of cellular (Kaunitz and Yamaguchi, 2008). Mice deficient in the TNAP gene release that dilutes a long time in the culture media, and therereveal defective bone mineralization and mimic a severe form of fore higher concentration of the nucleotide at the cellular envihuman hypophosphatasia. But TNAP knockout mice also suffer from ronment can be deduced. This conclusion is supported by several epileptiform seizures and die from apnea before weaning. They experimental evidences; first, both addition of catalytically active Total axonal length (%)
Control
Volume 22 April 1, 2011
B
AP
C
Ado 10 µM
Principal axonal length (%)
A
TNAP induces axonal elongation | 1019
roepithelial stem cells of the neural tube (Narisawa et al., 1994). During later development of the CNS, TNAP activity becomes down-regulated, but it remains highly expressed in the ventricular neurogenic regions up to adult stage (Langer et al., 2007). The functional role of TNAP during neural development has not been investigated, NS Levamisole J Control E D but it is possible that—by controlling the exNS NS tracellular availability of purinergic signaling 200 *** *** *** molecules—it plays a role in immature neu150 ron mobility and migration. In a variety of ** nonmammalian species, ALPs have been 100 implicated in cell guidance and migration (Thibaudeau et al., 1993). * 50 The purinergic mechanisms described ? -III-tubulin ? -III-tubulin here may in addition have implications for BBG G F Levamisole + BBG 0 regenerative processes in the adult brain and for neuronal plasticity. In the injured CNS severed axons can start axonal outgrowth at the site of lesion, but the growth K cones soon adopt a dystrophic morphology NS 250 NS typical of growth cone inhibition (Schnorrer NS and Dickson, 2004; Liu et al., 2006). Under *** 200 ? -III-tubulin ? -III-tubulin some pathological conditions like traumatic *** *** BBG + AP AP I H injury, hypoxia, or ischemia, ATP is released 150 * from damaged cells, resulting in elevated 100 extracellular concentrations (Phillis et al., * 1993; Juranyi et al., 1999) that would be in50 hibitory to axonal growth. Elevated ATP levels were shown to cause even neuronal cell 0 death in a variety of models that reproduce these pathological conditions in vitro (Ama? -III-tubulin ? -III-tubulin dio et al., 2002) or in vivo (Ryu et al., 2002). Figure 6: Involvement of TNAP and P2X7 in axonal growth. (A–C) Double immunofluorescence This can involve activation of P2X7 receptors analysis of hippocampal neurons fixed at 3 DIV and stained with antibodies against TNAP (Delarasse et al., 2009). (green) and P2X7 (red). (B and C) Images of the axonal growth cones at higher magnification. Moreover, similar mechanisms may apThe axonal growth cone depicted in B belongs to the neuron shown in A (box). Scale bars, A, ply to axonal sprouting and to presynaptic 50 μm; B and C, 20 μm. (D–I) Effect of P2X7 receptor antagonism and inhibition of TNAP on cultured hippocampal neurons; representative images of cultured hippocampal neurons cultured structural and functional plasticity. Axonal sprouting occurs as a restorative process for 3 DIV in the absence (D) or presence (E) of levamisole (500 μM), BBG (1 μM) (F), levamisole emerging from neurons other than the le(500 μM) and BBG (1 μM) (G), ALP (4 U/ml) (H), and BBG (1 μM) and ALP (4 U/ml) (I) and sioned ones and can result in functional immunostained for βIII-tubulin (green). (J and K) Analysis of axonal length corresponding to the experiments shown in D–I (Leva, levamisole). The 100% values in control neurons for total axonal synaptic reinnervation (Frotscher et al., length and principal axon length correspond to 198.9 ± 9.8 μm and 148.2 ± 7.7 μm, respectively. 1997). It is interesting to note that TNAP Values represent mean ± SEM (n = 3) with at least 25 neurons analyzed in each experiment. has also been identified in association with *p < 0.05, **p < 0.01, and ***p < 0.001 vs. control; NS, nonsignificant (one-way ANOVA). the neuropil of the adult rodent and primate brain, where it was located around display neural defects revealing aberrant development of the lumsynaptic contacts (Fonta et al., 2005; Langer et al., 2008). Synaptic bar nerve roots and disturbances in intestinal physiology (Narisawa TNAP expression coincided with the time course of high-rate synet al., 1997). Our demonstration of an association of TNAP with deaptogenesis, implicating a function in synaptic maturation and veloping axons of cultured hippocampal neurons matches previous later in mature synaptic activity (Fonta et al., 2005). While synaptic findings of an axonal localization of TNAP during neural developTNAP may be involved in the control of purinergic-mediated neument in situ, where the enzyme may similarly be involved in the rotransmission or cotransmission (Diaz-Hernandez et al., 2000, control of axon elongation. TNAP activity was detected in associa2002a; North and Verkhratsky, 2006), one may speculate that TNAP tion with nerve fibers emerging from the myelencephalon and spiand ATP could also play an antagonistic role in the structural nal cord of the developing mouse brain (Narisawa et al., 1994), and remodeling of synapses induced by neural activity (Bourne and an electron microscopic analysis of the developing marmoset brain Harris, 2008). revealed an association of ALP activity with the axonal surface (Fonta Taken together our results suggest that purinergic signaling et al., 2005). mechanisms involving TNAP and the P2X7 receptor critically Furthermore TNAP is associated with the brain neurogenic recontrol axonal extension and axonal branching in hippocampal gions during early mouse embryonic development. From E8.5 onneurons, whereby TNAP controls the local availability of growthward, it is highly expressed at the plasma membrane of the neuinhibiting extracellular ATP. These mechanisms may be of TNAP P2X7
B
TNAP P2X7
C
TNAP P2X7
L e Co va ntr m ol iso BB le Le G v A Le a+B 43 va B + G A BB 4 3 G AP + AP
Principal axonal length (%)
L e Co va ntr m ol iso BB le Le v AG Le a+ 43 va BB + G A 4 BB 3 G AP +A P
Total axonal length (%)
A
1020 | M. Díez-Zaera et al.
Molecular Biology of the Cell
A
Control GFP
P2X7 IRES
GFP
GFP
C
P2X7 IRES + AP
D
sh RNA P2X7
F
sh RNA TNAP
GFP
GFP
E
sh RNA TNAP + sh RNA P2X7
GFP
H
250 200
Total axonal length (%)
**
150
**
*
50
7G FP 7G FP + P2 AP X 7I P2 P2 RE X X S 7I 7I RE RE S+ S+ A TN P A P IR ES X
P2
15
*
5
RNA 40 30
*
20 10
BB G
P
0
0
Co nt ro l
Relative abundance of TNAP mRNA (%)
0
J
RNA
10
*
50
A
FP
P2 X
Co nt ro lG
I
100
Co nt ro lG sh FP RN A TN A sh P RN A P sh sh RN 2X7 RN A A P2 TN X7 A + P
0
*
150
Co nt ro l
100
200
Relative abundance of P2X7 mRNA
Total axonal length (%)
GFP
G
B
Figure 7: Modulation of axonal growth by expression of TNAP and P2X7. Hippocampal neurons were transfected at 1 DIV and fixed after 3 DIV. (A–F) GFP fluorescence images of representative neurons transfected with pEGFP (A), P2X7 IRES (B, C), shRNA TNAP (D), shRNA P2X7 (E), or P2X7 shRNA plus TNAP shRNA (F) in the presence (C) or absence of exogenous ALP. Scale bar, 50 μm. (G and H) Analysis of axonal length corresponding to the experiments shown in A–F and P2X7 IRES plus TNAP-IRES. The 100% value for total axonal length of EGFPtransfected neurons corresponds to 310.8 ± 28 μm. Values represent mean ± SEM (n = 5) with at least 12 neurons analyzed in each experiment. *p < 0.05 and **p < 0.01 vs. control (one-way ANOVA). (I and J) Quantification of the mRNA levels of TNAP and P2X7 by quantitative RT-PCR in hippocampal neurons cultured in the presence or absence of 1 μM BBG (I) and 4 U/ml ALP (J). Results were normalized to values obtained for β-actin mRNA and expressed as mean ± SEM (n = 3). *p < 0.05 (unpaired t test).
relevance for the developing nervous system but also for neuronal regeneration and possibly even synaptic plasticity in the adult brain. Volume 22 April 1, 2011
MATERIALS AND METHODS Reagents The following reagents were used in this study: levamisole (A4341; AppliChem, Darmstadt, Germany); BCIP/NBT ALP substrate (B5655), bovine intestinal ALP (P6772), adenosine (A9251), and BBG (B5133) (all from Sigma-Aldrich, St. Louis, MO); A-438079 hydrochloride (2972; Tocris Bioscience, Bristol, UK); CPA (691763; Boehringer Ingelheim, Ingelheim am Rhein, Germany); and ADA (10901221; Roche Diagnostics, Berlin, Germany).
Cell culture Primary cultures of hippocampal and cortical neurons were prepared as previously described (Banker and Goslin, 1988). Briefly, the hippocampus and the cortex were dissected and dissociated from E18 mouse embryos using the Papain Dissociation System (Worthington Biochemical, Lakewood, NJ). For axonal growth experiments and electroporation, neurons were plated at a density of 10,000 cells/cm2 on poly-l-lysine– coated coverslips (1 mg/ml; Sigma-Aldrich), and for measurement of ATP levels or cell transfection, neurons were plated at 100,000 cells/cm2 on coverslips or 35-mm plates coated with polylysine (10 μg/ml; Biochrom, Berlin, Germany) and laminin (3 μg/ml; Sigma-Aldrich). After plating, neurons were cultured for 3 d in Neurobasal medium (Life Technologies, Gaithersburg, MD) supplemented with 1% B-27, 0.5 mM glutamine, 1 mM pyruvate, 100 U/ml penicillin, and 100 mg/ml streptomycin. Levamisole, an inhibitor of TNAP (Kozlenkov et al., 2004), the P2X7 receptor antagonists BBG and A-438079 (McGaraughty et al., 2007), ADA (Cristalli et al., 2001), and adenosine at different concentrations or the selective A1 adenosine receptor agonist CPA were added to the cultured neurons 3 h after plating, at the concentrations indicated. HEK293T cells were maintained in DMEM (Life Technologies, Barcelona, Spain) supplemented with 10% (vol/vol) fetal calf serum (FCS). Cells were reseeded at 105 cells/cm2 1 d before transfection, after which FCS was reduced to 0.5% (vol/vol).
ATP measurement
Wells of 35 mm containing 106 cells and 2 ml culture media were used to measure extracellular ATP. The nucleotide concentration in the neuronal culture supernatant was determined using the ENLITEN ATP Assay System Bioluminescence Detection Kit for ATP Measurement (Promega, Madison, WI) according to the manufacturer’s protocol. Briefly, 20 μl cell culture medium from the upper layer of the well was mixed with 100 μl luciferin/luciferase reagent. TNAP induces axonal elongation | 1021
The emitted light was measured using a FLUOstar OPTIMA microplate reader.
Plasmid constructs and the design of shRNAs for the P2X7R
Plasmid construction and shRNA plasmid design were as described previously (Diaz-Hernandez et al., 2008). Murine TNAP cDNA (Accession BC065175) was purchased from Thermo Scientific (Huntsville, AL) in a nonexpression vector. For expression in eucaryotic cells, the TNAP sequence was obtained from the original vector using EcoRI and NotI and cloned into EcoRI–XmaI sites of pIRES2-GFP vector (Clontech, Mountain View, CA). Positive clones were sequenced to confirm the correct insertion nucleotide sequence. Mouse P2X7 cDNA was isolated using a commercial plasmid (Geneservice, Nottingham, UK) and cloned into the bicistronic plasmid pIRES2–enhanced GFP (EGFP) (Clontech) for expression in mammalian cells. To construct the P2X7-GFP plasmid, P2X7 was cloned into the pd2EGFP-N1 vector (Clontech), and the correctness of the ligation product was confirmed by sequencing. P2X7 receptor knockdown was achieved by RNA interference using a vector-based shRNA approach. The shRNA target sequence 5′-GTTTTGACATCCTGGTTTT-3′ for the P2X7 receptor was selected according to a previously reported rational design protocol. As a control (shRNA Luc), the firefly luciferase-targeted oligonucleotide 5′-CTGACGCGGAATACTTCGA-3′ was applied. The specificity of the sequence was confirmed by a BLAST analysis of the human, mouse, and rat P2X7 receptors. Synthetic forward and reverse 64-nucleotide oligonucleotides (Sigma Genosys, Dorset, UK) were designed, annealed, and inserted into the BglII/HindIII sites of the pSUPER.neo.GFP vector (OligoEngine, Seattle, WA) following the manufacturer’s instructions. These constructs express 19-base pair 9-nucleotide stem-loop shRNAs targeted against P2X7 receptor or luciferase (control shRNA) mRNAs. shRNA TNAP plasmids were purchased from SABiosciences (Frederick, MD). The concomitant expression of GFP by this vector allowed the identification of transfected cells by fluorescence.
Site-directed mutagenesis To assess whether murine TNAP shRNA was specific, wild-type (TNAP) or mutant (TNAPmut) forms of murine TNAP full-length cDNA were used. TNAPmut was obtained by PCR site-directed mutagenesis, using pIRES2-TNAP as a template, followed by DpnI digestion (QuikChange XL, Stratagene, La Jolla, CA). The selected PCR forward and reverse 61-nucleotide oligonucleotides carried silent third codon–base point mutations within the murine cDNA of corresponding TNAP shRNA target sequence 5′-TGGACTAGAACTAATAAGCAT-3′ (mutated nucleotides underlined).
Cell transfection HEK293T cell transfections were performed with the pSUPERneoGFP–derived plasmid constructs, pIRES2-TNAP-GFP, and shRNA TNAP using Lipofectamine 2000 (Invitrogen, San Francisco, CA) according to the manufacturer’s instructions. After 6 h, the medium was removed and the cells were further incubated for 24 h in the presence of culture medium. Neuronal transfection was performed with Lipofectamine 2000 or electroporation (Amaxa Biosystems, Gaithersburg, MD) as indicated. Lipofectamine transfection was carried out 24 h after plating using Lipofectamine 2000 (9 μl), 3 μg control shRNA Luc or shRNA P2X7R, shRNA TNAP, P2X7-GFP, and pIRES2-P2X7-EGFP vectors. The transfection mix was removed after 4 h, and the neurons were washed and maintained for 3 DIV after transfection. 1022 | M. Díez-Zaera et al.
Electroporation was performed with Nucleofector II Kit (Amaxa Biosystems) according to the manufacturer’s instructions. Briefly, dissociated hippocampal cells were incubated in 100 ml neuron nucleofection solution for primary mammalian neural cells, mixed with plasmids (1.5 μg), and electroporated using the fixed program (O-05) for optimal mouse neuronal transfection. Cells were then quickly centrifuged, resuspended, and plated.
Enzyme cytochemistry Activity of ALP on hippocampal neurons was detected as previously described (Langer et al., 2008) using BCIP/NBT (0.35 mM BCIP, 0.37 mM NBT, 5 mM MgCl2, 100 mM Tris buffer, pH 9.5, 45 min) as a precipitating substrate according to the manufacturer’s protocol (Sigma-Aldrich). In brief, prefixed cells were rinsed with 0.1 M TrisHCl buffer (pH 7.6) and incubated with substrate to obtain optimal staining intensity. After washing with Tris-HCl buffer, coverslips were embedded in antifading solution (glycerol gelatin; Sigma-Aldrich).
TNAP activity assay Cultured neurons were washed with phosphate-buffered saline (PBS), lysed, and homogenized in 10 mM Tris-HCl buffer (pH 8.0) supplemented with 0.25 M sucrose and Complete Protease Inhibitor Cocktail Tablets (Roche Diagnostics). Aliquots of the homogenates were assayed at 25ºC in the following reaction mix: 0.2 M diethanolamine buffer (Sigma-Aldrich) at pH 9.8, 1 mM MgCl2, and 5 mM ρ-nitrophenyl phosphate (Merck, Whitehouse Station, NJ) in the presence or in the absence of 5 mM levamisole. Reactions were stopped after 20 min with 0.1 M NaOH. Specific ALP activity was determined as the absorbance at 405 nm of the liberated ρ-nitrophenol minus the absorbance of the ρ-nitrophenol formed in the presence of levamisole (arbitrary units) and normalized to cellular protein content.
Antibodies and fluorescent reagents The following antibodies were applied: rabbit polyclonal anti-MAP2 (Sigma-Aldrich), mouse monoclonal anti–Tau-1 (Chemicon, Temecula, CA), rabbit polyclonal anti-TNAP (Abcam, Cambridge, UK), rabbit polyclonal anti-P2X7 (Alomone, Jerusalem, Israel, and Chemicon), and mouse monoclonal anti–βIII-tubulin (Promega). Phallotoxin Alexa Fluor 594–conjugated phalloidin, goat anti–mouse Alexa Fluor 594 conjugate, and goat anti–rabbit Alexa Fluor 488 conjugate were from Invitrogen.
Immunofluorescence analysis Immunofluorescence was performed on hippocampal neurons cultured for 3 DIV fixed with 4% paraformaldehyde. Nonspecific binding was blocked with 1% bovine serum albumin (BSA), 5% fetal bovine serum and 0.2% Triton X-100 in PBS. The cells were then incubated with primary antibodies; anti-TNAP (1/50); anti-P2X7 (1/100), anti–Tau-1 (1/500), anti MAP2 (1/200) and anti–βIII-tubulin (1/1000) for 1 h at room temperature. Coverslips were washed three times with 1% BSA in PBS and incubated with Alexa-Fluor-488 or Alexa-Fluor-594-conjugated secondary antibodies (1:400) and AlexaFluor-594-conjugated phalloidin (1/100). Coverslips were mounted using FluorSave (Calbiochem, Nottingham, UK) and images were acquired using a Nikon TE-200 fluorescence microscope coupled to a Kappa DX2 camera. Analysis of axon length and ramifications were carried out using the Image J software v.1.41o. Images were processed and presented using Adobe Photoshop and Illustrator CS3.
Immunoblotting Cultured neurons were washed with PBS, lysed, and homogenized in a radioimmunoprecipitation assay lysis buffer (50 mM Tris-HCl, pH Molecular Biology of the Cell
8.0, 150 mM sodium chloride, 1.0% Igepal CA-630 [NP-40], 0.5% sodium deoxycholate, and 0.1% SDS) (Sigma-Aldrich) supplemented with Complete Protease Inhibitor Cocktail Tablets (Roche Diagnostics). Proteins were separated on 10% SDS–PAGE gels and transferred to nitrocellulose membranes (PROTRAN Nitrocellulose Transfer Membrane BA 85; Whatman, Piscataway, NJ), saturated for 1 h at room temperature with 5% nonfat dried milk or 3% BSA in PBS, and incubated overnight at 4ºC with the following primary polyclonal antisera (and dilutions): TNAP (1:200), P2X7 (1:1000), and the monoclonal anti-tubulin antibody (1:5000). A secondary goat antimouse monoclonal antibody (1:5000) or goat anti–rabbit polyclonal antiserum (1:1000) coupled to horseradish peroxidase (Dako, Glostrup, Denmark) was used to detect the primary antibodies, which were visualized by enhanced chemiluminescence (Perkin Elmer, Waltham, MA).
Quantitative PCR experiments Total DNA was extracted from cultured neurons and HEK-transfected cells using an RNeasy Plus Mini Kit (Qiagen, Hilden, Germany), following the manufacturer’s instructions. RNA isolation and reverse transcription (RT) reactions were performed as described previously (Diaz-Hernandez et al., 2009). Quantitative realtime PCRs were performed using gene-specific primers and TaqMan MGB probes for the mouse P2X7 receptor, TNAP, glyceraldehyde-3-phosphate dehydrogenase (GAPDH), and β-actin (all from Applied Biosystems, Nutley, NJ). Fast thermal cycling was performed using a StepOnePlus Real-Time PCR System (Applied Biosystems) as follows: denaturation, one cycle of 95ºC for 20 s, followed by 40 cycles each of 95ºC for 1 s and 60ºC for 20 s. The results were normalized as indicated by parallel amplification of the endogenous controls β-actin or GAPDH.
Statistics All experiments were repeated at least three times, and the results are presented as mean ± standard error of the mean (SEM). Statistical differences were analyzed as indicated using GraphPad Prism 5 software and the unpaired t test or the one-way analysis of variance (ANOVA) test followed by the Newman–Keuls test correction.
ACKNOWLEDGMENTS This study was funded by grants from the Comunidad de Madrid (S-SAL-0253–2006), Spanish Ministry of Science and Education (BFU2008–02699), Fundación Marcelino Botín, Consolider Spanish Ion Channel Initiative (CSD2008-00005), Universidad Complutense de Madrid–Santander Central Hispano Bank (911585–670), and Deutsche Forschungsgemeinschaft (140/17-4 to H. Z.). M.D.-Z. is the recipient of a Formación de Profesorado Universitario grant from the Ministerio de Educación y Ciencia.
REFERENCES
Abbracchio MP, Burnstock G, Verkhratsky A, Zimmermann H (2009). Purinergic signaling in the nervous system: an overview. Trends Neurosci 32, 19–29. Abbracchio MP, Cattabeni F, Clementi F, Sher E (1989). Adenosine receptors linked to adenylate cyclase activity in human neuroblastoma cells: modulation during cell differentiation. Neuroscience 30, 819–825. Amadio S, D’Ambrosi N, Cavaliere F, Murra B, Sancesario G, Bernardi G, Burnstock G, Volonte C (2002). P2 receptor modulation and cytotoxic function in cultured CNS neurons. Neuropharmacology 42, 489–501. Armstrong JN, Brust TB, Lewis RG, MacVicar BA (2002). Activation of presynaptic P2X7-like receptors depresses mossy fiber-CA3 synaptic transmission through p38 mitogen-activated protein kinase. J Neurosci 22, 5938–5945. Volume 22 April 1, 2011
Banker G, Goslin K (1988). Developments in neuronal cell culture. Nature 336, 185–186. Bourne JN, Harris KM (2008). Balancing structure and function at hippocampal dendritic spines. Annu Rev Neurosci 31, 47–67. Burnstock G (2007). Physiology and pathophysiology of purinergic neurotransmission. Physiol Rev 87, 659–797. Cristalli G, Costanzi S, Lambertucci C, Lupidi G, Vittori S, Volpini R, Camaioni E (2001). Adenosine deaminase: functional implications and different classes of inhibitors. Med Res Rev 21, 105–128. Cheung KK, Chan WY, Burnstock G (2005). Expression of P2X purinoceptors during rat brain development and their inhibitory role on motor axon outgrowth in neural tube explant cultures. Neuroscience 133, 937–945. Delarasse C, Gonnord P, Galante M, Auger R, Daniel H, Motta I, Kanellopoulos JM (2009). Neural progenitor cell death is induced by extracellular ATP via ligation of P2X7 receptor. J Neurochem 109, 846–857. Diaz-Hernandez M, del Puerto A, Diaz-Hernandez JI, Diez-Zaera M, Lucas JJ, Garrido JJ, Miras-Portugal MT (2008). Inhibition of the ATP-gated P2X7 receptor promotes axonal growth and branching in cultured hippocampal neurons. J Cell Sci 121, 3717–3728. Diaz-Hernandez M, Diez-Zaera M, Sanchez-Nogueiro J, Gomez-Villafuertes R, Canals JM, Alberch J, Miras-Portugal MT, Lucas JJ (2009). Altered P2X7-receptor level and function in mouse models of Huntington’s disease and therapeutic efficacy of antagonist administration. FASEB J 23, 1893–1906. Diaz-Hernandez M, Pereira MF, Pintor J, Cunha RA, Ribeiro JA, Miras-Portugal MT (2002a). Modulation of the rat hippocampal dinucleotide receptor by adenosine receptor activation. J Pharmacol Exp Ther 301, 441–450. Diaz-Hernandez M, Pintor J, Castro E, Miras-Portugal MT (2002b). Colocalisation of functional nicotinic and ionotropic nucleotide receptors in isolated cholinergic synaptic terminals. Neuropharmacology 42, 20–33. Diaz-Hernandez M, Pintor J, Miras-Portugal MT (2000). Modulation of the dinucleotide receptor present in rat midbrain synaptosomes by adenosine and ATP. Br J Pharmacol 130, 434–440. Dotti CG, Sullivan CA, Banker GA (1988). The establishment of polarity by hippocampal neurons in culture. J Neurosci 8, 1454–1468. Fonta C, Negyessy L, Renaud L, Barone P (2005). Postnatal development of alkaline phosphatase activity correlates with the maturation of neurotransmission in the cerebral cortex. J Comp Neurol 486, 179–196. Fredholm BB, Chen JF, Cunha RA, Svenningsson P, Vaugeois JM (2005). Adenosine and brain function. Int Rev Neurobiol 63, 191–270. Frotscher M, Heimrich B, Deller T (1997). Sprouting in the hippocampus is layer-specific. Trends Neurosci 20, 218–223. Gomez-Villafuertes R, del Puerto A, Diaz-Hernandez M, Bustillo D, Diaz-Hernandez JI, Huerta PG, Artalejo AR, Garrido JJ, Miras-Portugal MT (2009). Ca2+/calmodulin-dependent kinase II signaling cascade mediates P2X7 receptor-dependent inhibition of neuritogenesis in neuroblastoma cells. FEBS J 276, 5307–5325. Gomez-Villafuertes R, Gualix J, Miras-Portugal MT (2001). Single GABAergic synaptic terminals from rat midbrain exhibit functional P2X and dinucleotide receptors, able to induce GABA secretion. J Neurochem 77, 84–93. Gomez TM, Zheng JQ (2006). The molecular basis for calcium-dependent axon pathfinding. Nat Rev Neurosci 7, 115–125. Grimes CA, Jope RS (2001). CREB DNA binding activity is inhibited by glycogen synthase kinase-3β and facilitated by lithium. J Neurochem 78, 1219–1232. Gualix J, Gomez-Villafuertes R, Diaz-Hernandez M, Miras-Portugal MT (2003). Presence of functional ATP and dinucleotide receptors in glutamatergic synaptic terminals from rat midbrain. J Neurochem 87, 160–171. Honore P et al. (2006). A-740003 [N-(1-{[(cyanoimino)(5-quinolinylamino) methyl]amino}-2,2-dimethylpropyl)-2-(3,4-dimethoxyphenyl)acetamide], a novel and selective P2X7 receptor antagonist, dose-dependently reduces neuropathic pain in the rat. J Pharmacol Exp Ther 319, 1376–1385. Hou ST, Jiang SX, Smith RA (2008). Permissive and repulsive cues and signaling pathways of axonal outgrowth and regeneration. Int Rev Cell Mol Biol 267, 125–181. Juranyi Z, Sperlagh B, Vizi ES (1999). Involvement of P2 purinoceptors and the nitric oxide pathway in [3H]purine outflow evoked by short-term hypoxia and hypoglycemia in rat hippocampal slices. Brain Res 823, 183–190. Kaunitz JD, Yamaguchi DT (2008). TNAP, TrAP, ecto-purinergic signaling, and bone remodeling. J Cell Biochem 105, 655–662. Khakh BS, North RA (2006). P2X receptors as cell-surface ATP sensors in health and disease. Nature 442, 527–532. TNAP induces axonal elongation | 1023
Kozlenkov A, Le Du MH, Cuniasse P, Ny T, Hoylaerts MF, Millan JL (2004). Residues determining the binding specificity of uncompetitive inhibitors to tissue-nonspecific alkaline phosphatase. J Bone Miner Res 19, 1862–1872. Langer D, Hammer K, Koszalka P, Schrader J, Robson S, Zimmermann H (2008). Distribution of ectonucleotidases in the rodent brain revisited. Cell Tissue Res 334, 199–217. Langer D, Ikehara Y, Takebayashi H, Hawkes R, Zimmermann H (2007). The ectonucleotidases alkaline phosphatase and nucleoside triphosphate diphosphohydrolase 2 are associated with subsets of progenitor cell populations in the mouse embryonic, postnatal and adult neurogenic zones. Neuroscience 150, 863–879. Liu BP, Cafferty WB, Budel SO, Strittmatter SM (2006). Extracellular regulators of axonal growth in the adult central nervous system. Philos Trans R Soc Lond B Biol Sci 361, 1593–1610. McGaraughty S et al. (2007). P2X7-related modulation of pathological nociception in rats. Neuroscience 146, 1817–1828. Michel AD, Chambers LJ, Clay WC, Condreay JP, Walter DS, Chessell IP (2007). Direct labelling of the human P2X7 receptor and identification of positive and negative cooperativity of binding. Br J Pharmacol 151, 103–114. Millan JL (2006). Alkaline phosphatases: structure, substrate specificity and functional relatedness to other members of a large superfamily of enzymes. Purinergic Signal 2, 335–341. Narisawa S, Frohlander N, Millan JL (1997). Inactivation of two mouse alkaline phosphatase genes and establishment of a model of infantile hypophosphatasia. Dev Dyn 208, 432–446. Narisawa S, Hasegawa H, Watanabe K, Millan JL (1994). Stage-specific expression of alkaline phosphatase during neural development in the mouse. Dev Dyn 201, 227–235.
1024 | M. Díez-Zaera et al.
North RA, Verkhratsky A (2006). Purinergic transmission in the central nervous system. Pflugers Arch 452, 479–485. O’Donnell M, Chance RK, Bashaw GJ (2009). Axon growth and guidance: receptor regulation and signal transduction. Annu Rev Neurosci 32, 383–412. Ortega F, Perez-Sen R, Morente V, Delicado EG, Miras-Portugal MT (2010). P2X7, NMDA and BDNF receptors converge on GSK3 phosphorylation and cooperate to promote survival in cerebellar granule neurons. Cell Mol Life Sci 67, 1723–1733. Phillis JW, O’Regan MH, Perkins LM (1993). Adenosine 5′-triphosphate release from the normoxic and hypoxic in vivo rat cerebral cortex. Neurosci Lett 151, 94–96. Robson SC, Sevigny J, Zimmermann H (2006). The E-NTPDase family of ectonucleotidases: structure function relationships and pathophysiological significance. Purinergic Signal 2, 409–430. Ryu JK, Kim J, Choi SH, Oh YJ, Lee YB, Kim SU, Jin BK (2002). ATP-induced in vivo neurotoxicity in the rat striatum via P2 receptors. Neuroreport 13, 1611–1615. Schnorrer F, Dickson BJ (2004). Axon guidance: morphogens show the way. Curr Biol 14, R19–21. Thibaudeau G, Drawbridge J, Dollarhide AW, Haque T, Steinberg MS (1993). Three populations of migrating amphibian embryonic cells utilize different guidance cues. Dev Biol 159, 657–668. Zhou H, Manji SS, Findlay DM, Martin TJ, Heath JK, Ng KW (1994). Novel action of retinoic acid. Stabilization of newly synthesized alkaline phosphatase transcripts. J Biol Chem 269, 22433–22439. Zimmermann H (2006). Ectonucleotidases in the nervous system. Novartis Found Symp 276, 113–128; discussion 128–130, 233–117, 275–181.
Molecular Biology of the Cell