Research Report Tissue-Specific Microdissection Coupled with ProteinChip Array Technologies: Applications in Cancer Research BioTechniques 29:1066-1070 (November 2000)
F. von Eggeling, H. Davies2, L. Lomas2, W. Fiedler, K. Junker1, U. Claussen and G. Ernst Institute of Human Genetics and Anthropology, Jena; 1Clinic of Urology, Jena, Germany; and 2Ciphergen Biosystems Ltd., Guildford, Surrey, UK ABSTRACT Analysis of whole genomes to monitor specific changes in gene activation or changes in gene copy number due to perturbation has recently become possible using DNA chip technologies. It is now becoming apparent, however, that knowing the genetic sequence encoding a protein is not sufficient to predict the size or biological nature of a protein. This can be particularly important in cancer research where posttranslational modifications of a protein can specifically lead to the disease. To address this area, several proteomic tools have been developed. Currently the most widely used proteomics tool is two-dimensional polyacrylamide gel electrophoresis (2D-PAGE), which can display protein expression patterns to a high degree of resolution. However, 2D-PAGE can be time consuming; the analysis is complicated and, compared with DNA techniques, is not very sensitive. Although some of these problems can be alleviated by using high-quality homogeneous samples, such as those generated using microdissection techniques, the quantity of sample is often limited and may take several days to generate sufficient material for a single 2D-PAGE analysis. As an alternative 1066 BioTechniques
to 2D-PAGE, a preliminary study using a new technique was used to generate protein expression patterns from either whole tissue extracts or microdissected material. Surface-enhanced laser desorption and ionization allows the retention of proteins on a solid-phase chromatographic surface or ProteinChip Array with direct detection of retained proteins by time-of-flight mass spectrometry. Using this system, we analyzed tumor and normal tissue from head and neck cancer and microdissected melanoma to determine differentially expressed proteins. In particular, comparisons of the protein expression patterns from microdissected normal and tumor tissues indicated several differences, highlighting the importance of extremely defined tissue lysates for protein profiling.
INTRODUCTION As the Human Genome Project nears completion, all sequence information for human genes will become available. Although this will be a monumental achievement, in many cases it will provide little information regarding the function and/or interaction of proteins at the cellular level because the genetic sequence cannot effectively predict posttranslational events. Therefore, proteomic tools are essential for gaining a better understanding of cellular mechanisms. The classic proteomic tool, twodimensional polyacrylamide gel electrophoresis (2D-PAGE), is now over 25 years old (4,8). Although this technique has matured to a state that affords highresolution separation of proteins, there are still issues associated with repro-
ducibility, quantitation and the ability to characterize proteins deemed to be of interest. To alleviate these problems, methodologies have been developed to combine the resolving power of 2DPAGE with other technologies, such as tissue microdissection (to provide homogeneous high-quality samples) and mass spectrometry (MS) (to provide a means of protein characterization). In particular, matrix-assisted laser desorption and ionization time-of-flight mass spectrometry (MALDI-TOF) (11) is commonly used to accurately measure the molecular mass of a protein removed from a gel (6,14) or provide tentative identification via peptide fingerprinting. A limitation of MALDI-TOF, which often prevents direct analysis of biological samples, is the presence of buffer components (such as salts and detergents), lipids, carbohydrates, etc., that prevent efficient ionization of the proteins within. Therefore, many complex protein mixtures, such as crude biological extracts, must go through a pre-separation step (such as 2D-PAGE) before analysis. As an alternative to 2D-PAGE-MS, we have used a new ProteinChip (Ciphergen Biosystems, Fremont, CA, USA) Array technology (3,5,13). This technology utilizes affinity surfaces to retain proteins based on their physical or chemical characteristics, followed by direct analysis by TOF-MS. Because proteins are retained on the surface, contaminants such as buffer salts or detergents can easily be washed away before MS analysis, thus eliminating the need for pre-separation techniques such as 2D-PAGE. Furthermore, the small sample requirements, typically 1–2 µL Vol. 29, No. 5 (2000)
per analysis, are ideally suited to the tissue microdissection techniques used to produce high-quality homogenous tissue samples in cancer research (1,7,10), in which only minute amounts of sample can be easily obtained. To evaluate this technology, we compared the protein profiles generated from head and neck cancers (HNC) (six tumor tissues with relevant controls; crude tissue preparation) and microdissected melanoma tissues (four from normal epithelial tissue and three from tumor tissue). Possibilities for clinical applications, including quantification of prognostic cellular proteins and detection of unknown proteins that participate in tumorigenesis and progression, are discussed.
MATERIALS AND METHODS Preparation of Protein Lysates In the case of HNC tissues, crude protein extracts were made by manually disrupting the tissues in 100 mM PBS (pH 7.2) to a final total protein concentration of 10 mg/mL. The samples were then centrifuged at 10 000× g to remove cellular debris, and the supernatant was stored frozen at -80°C until further use. For the melanoma tumors, specific populations of cells were microdissected using an inverted microscope (Axiovert; Zeiss, Oberkochen, Germany) with the help of a joystickcontrolled electric micromanipulator
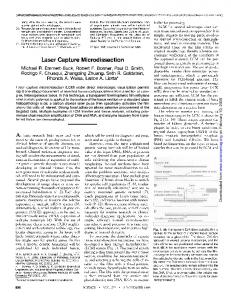
Figure 1. Six HNC cases (2151R, 1905, 1522, 1511, 1155 and 68) were analyzed on an H4 chip. A spectral view from 7500 to 9000 Da is displayed with normalized intensities. The protein peak with 8669.9 Da (arrow) is present in five cases of the tumor tissue but not in the normal tissue. Vol. 29, No. 5 (2000)
BioTechniques 1067
Research Report (Märzhäuser, Wetzlar, Germany) and an extended glass needle. Hematoxylin and eosin (HE)-stained adjacent cryostat sections from melanoma metastases were microdissected to separate tumor from surrounding normal tissue components. It is now commonly accepted that this method is extremely important when using highly sensitive techniques to discriminate subtle differences in protein variation. The dissected tumor and normal cells were then transferred to 5 µL lysis buffer (10 mM Tris, pH 7.5, 1 mM MgCl 2 , 1 mM EGTA, 0.1 mM PMSF, 5 mM β-mercaptoethanol, 0.5% CHAPS and 10% glycerol). This lysis buffer is especially suitable for the enrichment of the S100 protein fraction. The samples were then centrifuged at 10 000× g to remove cell debris. The supernatant was stored frozen at -80°C until use for further analysis.
incubation, each sample droplet was removed, and each target was washed with Tris buffer (50 mM, pH 8.5, containing 0.05% Triton X-100; five washes, 5 µL each wash). The targets were then washed three times with Tris buffer (50 mM, pH 8.5; 5 µL each wash) to remove the detergent, followed by a quick water wash (5 µL) to remove the buffer salts. The ProteinChip Array was then allowed to dry. To the prepared targets (both reversed-phase [H4] and strong anionic exchanger surfaces [SAX2]) two applications of saturated sinapinic acid (SPA) [dissolved in 50% acetonitrile containing 0.5% trifluoroacetic acid (TFA); 0.5 µL each application] was added and allowed to dry. The ProteinChip Arrays were then transferred into the chip reader for analysis.
Data Collection All ProteinChip arrays were analyzed in a ProteinChip Reader (PBS-II; Ciphergen Biosystems) according to an automated data collection protocol. The instrument was operated in positive ion mode with a source and detector voltage of 20 and 1.8 kV, respectively. Time-lag focusing was used, with a pulse voltage and pulse lag time of 3000 V and 673 ns, respectively. Laser intensity was set to 150 (corresponding to approximately 100 µJ), using a nitrogen laser emitting at 337 nm. The digitizer operated at 250 MHz. Transients (105) were averaged over 66% of the target area in a linear sweep to generate each spectrum. Data interpretation was augmented by the use of the ProteinChip software version 2.01.
ProteinChip Array Analysis For the ProteinChip Array analysis, two different types of ProteinChip Arrays (Ciphergen Biosystems) were used to fractionate proteins in the tissue lysates. These included a strong anionic exchanger and a reversed-phase (C16) ProteinChip Array. Tissue extracts were thawed and centrifuged for 5 min at 10 000× g before use. For analyses using the reversed-phase surfaces, the sample targets were first prepared by incubating with 50% acetonitrile:water (v/v; 2 µL) for 1 min. The acetonitrile was removed, and 2 µL cell extract (diluted in acetonitrile to a final concentration of 30% acetonitrile) was immediately added. The ProteinChip Array was then incubated at high humidity for 20 min to allow the sample to interact with the surface. After incubation, each target was washed (five washes, 5 µL 30% acetonitrile each wash) and finally allowed to dry. For analysis using the strong anionic exchanger surfaces, the sample targets were prepared by equilibrating them with Tris buffer (50 mM, pH 8.5, containing 0.05% Triton X100) for 20 min. After equilibration, the buffer was removed, and 5 µL fresh buffer was added to each target. Into this, 2 µL sample extract was spiked, and the ProteinChip Array was incubated at high humidity for 20 min. After 1068 BioTechniques
Figure 2. Microdissected melanoma and epithelia from four and three different areas, respectively, analyzed on a SAX2 chip. A spectral view from 10 000 to 12500 Da is displayed with normalized intensities. The protein peak with 10 362.6, 10 732.5, 11 054.3 and 11 925.9 Da are specific for the melanoma, whereas 11 109.4, 11 185.4 and 11 321.6 Da are exclusively present in epithelia tissue. The peak at 10 439.2 Da is common in both tissues. Vol. 29, No. 5 (2000)
RESULTS AND DISCUSSION As an initial study to determine the lower sensitivity limit for ProteinChip analysis of microdissected melanoma tumor cells, a number of extracts were prepared, ranging from 50 to 500 single cells per extract and analyzed using a reversed-phase ProteinChip Array. Extracts from 50 to 100 cells contained sufficient material to generate a reliable tissue protein profile (data not shown), while extracts from approximately 500 cells provided sufficient material for several analyses. For the primary analysis of HNCs and microdissected melanoma tumor tissues, protein profiles were generated from cell extracts and compared with those from extracts of the respective normal control tissues. In HNC tissues, we analyzed six cases that had been well characterized by other molecular
investigations (2,9) and showed an identical histopathological status. Tumor and normal tissue were identified by at least two HE-stained cryostat sections per case before homogenate preparation and then profiled using a reversed-phase ProteinChip Array. Relative quantitative changes of protein titers (based on either peak intensity or peak area) between tumor and normal tissue could be ascertained (Figure 1). In particular, an 8.7-kDa protein was found that was detectable in five of the six cases in the tumor tissue but in no case in the corresponding normal tissue (Figure 1, arrow). Although more samples must be examined to assign statistical meaning to the up- or down-regulation of this protein, this limited sample size does demonstrate the effectiveness of using the ProteinChip Array system for analyzing the protein profiles of complex samples.
Figure 3. Identical protein lysates as in Figure 2 were analyzed on an H4 chip. The protein peak with 10 415.4, 11 925.9, 12 010.0 and 12 088.7 Da are specific for the melanoma, whereas 11 119.9, 11 197.8 and 11 663.8 Da are exclusively present in epithelia tissue. Vol. 29, No. 5 (2000)
BioTechniques 1069
Research Report In contrast to HNCs, the microdissected melanoma tissue (12) showed a homogenous protein profile, which was clearly different from the surrounding microdissected epithelial regions (Figures 2 and 3). This underlines the importance of using a technique such as microdissection to selectively provide homogeneous populations of cells for each analysis. In extracts prepared from microdissected melanoma tissues, several differentially expressed proteins were detected when comparing normal and tumor protein extracts on both H4 and SAX2 chips. Typical spectra highlighting the protein patterns of tumor and normal microdissected tissues are provided for both the SAX2 (Figure 2) and the H4 (Figure 3) ProteinChip Array. Using either surface, it is clear that a specific pattern of proteins characteristic of disease is generated as compared to the control tissue. Again, the significance of these protein profiles will need to be established using larger sample numbers. Identifying differences between the
protein profiles of tumor and normal tissues is clearly affected by the quality of the sample prepared. In microdissected melanoma tissue samples, proteins unique to the cancer or normal lysates could clearly be identified because of the homogeneous nature of the preparations. In HNC-derived lysates, where the growth pattern of the tumor leads to a very heterogeneous sample composition, it was more difficult to unambiguously identify proteins that show consistent expression differences as compared to normal tissue lysates. As a consequence, the pureness of lysed tissue is tremendously important. The difficulty with the microdissection technique, however, is producing enough of this high-quality sample for classical 2DPAGE analysis. From the data generated, it is clear that the ProteinChip technology addresses this problem and provides a simple method for analyzing minute samples at the proteomic level. The data presented only highlight the up- and down-regulation of specific proteins within a sample, and we realize that further characterization of these proteins will be necessary to understand the genesis and progression of cancer. Although final characterization may ultimately rely on more conventional technologies, the ProteinChip System can still offer advantages throughout the purification as a rapid monitoring platform with final protein identification via peptide mapping. Nevertheless, it is evident that the ProteinChip System is an extremely rapid and powerful proteomic tool for highlighting the differences in protein expression profiles directly from complex tissue lysates and can offer valuable insight to direct further research. REFERENCES 1.Aubele, M., A. Mattis, H. Zitzelsberger, A. Walch, M. Kremer, P. Hutzler, H. Hofler and M. Werner. 1999. Intratumoral heterogeneity in breast carcinoma revealed by lasermicrodissection and comparative genomic hybridization. Cancer Genet. Cytogenet. 110:94-102. 2.Dahse, R., W. Fiedler, F. von-Eggeling, B. Schimmel, S. Koscielny, E. Beleites, U. Claussen and G. Ernst. 1999. P53 genotyping—an effective concept for molecular testing of head and neck cancer? Int. J. Mol. Med. 4:279-283. 3.Davies, H., L. Lomas and B. Austen. 1999. Profiling of amyloid β peptide variants using
SELDI ProteinChip arrays. BioTechniques 27:1258-1261. 4.Klose, J. 1975. Protein mapping by combined isoelectric focusing and electrophoresis of mouse tissues. A novel approach to testing for induced point mutations in mammals. Humangenetik 26:231-243. 5.Kuwata, H., T.T. Yip, M. Tomita and T.W. Hutchens. 1998. Direct evidence of the generation in human stomach of an antimicrobial peptide domain (lactoferricin) from ingested lactoferrin. Biochim. Biophys. Acta 1429: 129-141. 6.Loo, J.A., J. Brown, G. Critchley, C. Mitchell, P.C. Andrews and L.R. Ogorzalek. 1999. High sensitivity mass spectrometric methods for obtaining intact molecular weights from gel-separated proteins. Electrophoresis 20:743-748. 7.Macintosh, C.A., M. Stower, N. Reid and N.J. Maitland. 1998. Precise microdissection of human prostate cancers reveals genotypic heterogeneity. Cancer Res. 58:23-28. 8.O’Farrell, P.H. 1975. High resolution two-dimensional electrophoresis of proteins. J. Biol. Chem. 250:4007-4021. 9.Riese, U., R. Dahse, W. Fiedler, C. Theuer, S. Koscielny, G. Ernst, E. Beleites, U. Claussen and F. von Eggeling. 1999. Tumor suppressor gene p16 (CDKN2A) mutation status and promoter inactivation in head and neck cancer. Int. J. Mol. Med. 4:61-65. 10.Schutze, K. and G. Lahr. 1998. Identification of expressed genes by laser-mediated manipulation of single cells. Nat. Biotechnol. 16:737-742. 11.Siuzdak, G. 1996. Mass Spectrometry for Biotechnology. Academic Press, San Diego. 12.von Eggeling, F., G. Werner, C. Theuer, U. Riese, R. Dahse, W. Fiedler, B. Schimmel, G. Ernst et al. 1999. Analysis of the tumor suppressor gene p16(INK4A) in microdissected melanoma metastases by sequencing, and microsatellite and methylation screening. Arch. Dermatol. Res. 291:474-477. 13.Wright, G.L., L.H. Cazares, S.M. Leung, S. Nasim, B.L. Adam, T.T. Yip, P.F. Schellhammer, L. Gong and A. Vlahou. 1999. ProteinChip surface enhanced laser desorption/ionization (SELDI) mass spectrometry: a novel protein biochip technology for detection of prostate cancer biomarkers in complex protein mixtures. Prostate Cancer Prostat. Dis. 2:264-276. 14.Zhang, W., A.J. Czernik, T. Yungwirth, R. Aebersold and B.T. Chait. 1994. Matrix-assisted laser desorption mass spectrometric peptide mapping of proteins separated by twodimensional gel electrophoresis: determination of phosphorylation in synapsin I. Protein Sci. 3:677-686.
Received 19 January 2000; accepted 19 July 2000. Address correspondence to: Dr. Ferdinand von Eggeling Institut für Humangenetik und Anthropologie Kollegiengasse 10 07740 Jena, Germany e-mail:
[email protected] Vol. 29, No. 5 (2000)