Title
Author(s)
Citation
Issue Date
URL
Rights
An optimal power flow based dispatch model for distributed generation embedded network
Lin, Y; Zhong, J; Bollen, MHJ The 9th International Conference on Environment and Electrical Engineering (EEEIC 2010), Prague, Czech Republic, 16-19 May 2010. 2010
http://hdl.handle.net/10722/126071
International Conference on Environment and Electrical Engineering Proceedings. Copyright © IEEE.
1
An Optimal Power Flow Based Dispatch Model for Distributed Generation Embedded Network Yufeng Lin, Student Member, IEEE, Jin Zhong, Member, and Math H.J. Bollen, Fellow, IEEE
Abstract—The installation of distributed generation (DG) introduces challenges to distribution systems operation. The distribution network operator needs to schedule DG outputs considering some constraints, such as DG characteristics, reactive power control mode of generators, automatic voltage regulation, compensator and power quality standard, etc. Based on an optimal power flow model, this paper proposes a dispatch model for DG embedded distribution systems. The model is proposed basing on energy prices, weather forecasting and load forecasting. The objective is to minimize the electricity supply cost of the distribution company. The proposed model is tested in the 33-buse system. The results show that DisCo’s cost and losses of the distribution system can be reduced by enhancing system operation flexibility. Index Terms—Distributed generation, dispatch model, optimal power flow
NOMENCLATURE A. Parameters i: DG number. j, k: Bus number. ρ S ( PS ) : Price of electricity from power grid, $/MWh.
ρ DGi : Offer from DGi, $/MWh. Gjk: Bjk:
θ jk :
Real part of admittance matrix element. Imaginary part of admittance matrix element. Phase angle difference between bus j and bus k.
PDGi : Lower boundary of DGi output. PDGi : ηw : ρw: A: Cw: V: PDGi ,W
Maximum output of DGi. Overall efficiency of wind turbine. Air density, m/s. Wind turbine rotor area, m3. Optimal power coefficient of wind turbine. Wind velocity, m/s. : Rated active power of wind turbine, W.
Q: Flow rate, m3/s. H: Effective head of hydro power plant, m. ηh: Overall efficiency of hydro power plant. _________________________________________________ This work was supported by the HKU Seed Funding Program for Basic Research (Project code: 200811159092), HKU Strategic Research Theme and the University Development Funding (Initiative on Clean Energy & Environment). Y. Lin and J. Zhong are with the Department of Electrical & Electronic Engineering, the University of Hong Kong, HKSAR (e-mails:
[email protected],
[email protected]). M.H.J. Bollen is with EMC-on-Site, Luleå University of Technology, 97431 Skellefteå and with, STRI AB, 77180 Ludvika, Sweden (e-mail:
[email protected])
ρh: Water density, kg/m3. g: Acceleration due to gravity, m/s. PDGi , H : Rated active power of hydro power plant, W. a1, a2 and a3: Coefficients related to the design of CHP. p: Steam pressure of CHP, ata. G: Steam flux, Tun/Hour. G1: High pressure extraction of CHP, Tun/Hour. G2: Low pressure extraction of CHP, Tun/Hour. ΔH: Steam enthalpy drop in turbine low pressure stage, J/Tun. ηg: Turbine low pressure stage efficiency. xs,DGi: Synchronous reactance, pu. Eq , DGi : Maximum internal voltage, pu. Qmin, DGi: Region heating limit, MVar. SDGi: Rated capacity, MVA. rr: Rotor resistance, pu. xr: Rotor reactance, pu. rs: Stator resistance, pu. xs: Stator reactance, pu. xm: Excitation reactance, pu. S: Induction generator slip. PFDGi: Power factor of DGi. Lower voltage boundary on bus, pu. V : Upper voltage boundary on bus, pu. Lower boundary of substation secondary side voltage, pu. VS : Upper boundary of substation secondary side voltage, pu. Vset: Set point of substation secondary side voltage, pu. QC' , j : Reactive power of fixed capacitor on bus j when the V : VS :
voltage is 1.0 pu, Mvar. QSVC , j : Maximum reactive power of SVC on bus j when the
voltage is 1.0 pu, Mvar. QSVC , j : Minimum reactive power of SVC on bus j when the voltage is 1.0 pu, Mvar. B. Variables Active power from power grid, MW. PS: PDGi: Active power from DGi, MW. PGj: Total DG active power on bus j, MW. PDj: Total active power demand on bus j, MW. Vj: Voltages on bus j, pu. V k: Voltages on bus k, pu. VDGi: Terminal voltage of DGi, pu. VS: Substation secondary side voltage, pu.
2
QC,j: Reactive power of fixed capacitor on bus j, Mvar. QSVC,j: Reactive power of SVC on bus j, Mvar.
I.
D
INTRODUCTION
UE to the increasing concerns on the global warming, and the exhaustion of fossil fuels, clean energy based distributed generation is recognized as one of the feasible approaches for sustainable development. It is expected that the penetration rate of DGs in power system will keep rising and the conventional power system will evolve from a centralized generating system to a more decentralized one. Moreover, DGs have potential advantages to reduce power delivery losses, postpone or shift transmission system investment, and increase system reliabilities. In a DG embedded distribution system, distribution network operators (DNOs) dispatch DGs to maximize social welfare, while satisfy system operation constrains. Hereby, price signals, DG techniques, system operation guidelines, and power quality standards could affect the operation results. Various DG techniques used currently have different power characteristics. Some renewable energy based DG are subject to the meteorologic conditions, such as wind speed, solar radiation, and flow rate, etc [1], [2]. The electrical outputs of combined-heat-and-powers (CHPs) depend on heat load [3]. Other DGs, such as steam turbine, gas turbine and combined cycle turbine, are highly controllable [1], [2]. DGs’ abilities on adjusting reactive power are different. Synchronous machine, double-fed machine or self-commutated converter based DGs can adjust their reactive power outputs for terminal voltage regulation or power factor control. The DGs using induction machines or line-commutated converters are not able to adjust reactive output [1]-[6]. Operation guidelines for distribution system are different from one region to another. DGs are operated in fixed power factor mode or voltage control mode in different systems [7], [8]. In recent years, active management has been applied as an alternative approach to improve system efficiency. In active management, the set points of AVRs can be adjusted real time, and, in some cases, fixed capacitors are replaced by SVCs, which have variable admittance [11]-[13]. Voltage variation is an important issue for system operation. Though detailed definitions of voltage variation are diverse in different standards, voltage variation is commonly known as a phenomenon that unacceptable steady voltage deviation occurs on buses [14]-[16]. In traditional distribution system with few generator embedded, voltage magnitude normally droop gradually along feeder. This situation is no longer true due to the installation of DG, which can change system voltage profile. In this context, economical operation in a DG embedded distribution system is a challenge for DNOs. Some voltage control strategies and dispatch models have been proposed for this issue. For example, Viawan and Karlsson introduce the methods to minimize system losses by coordinating on-load tap changers, capacitors, and switches in the DG embedded system [9-10]. A widespread communication based strategy is discussed to minimize a linear combination of distribution
losses and voltage magnitude marginal [17]. A market model is proposed for distribution companies to coordinate wholesale market, load curtailment, distribution company (DisCo) owned DGs, and independent DGs [18]. The objective of the model is to minimize the total cost to procure the active power and reactive power. In this paper, an optimal power flow (OPF) based dispatch model is proposed for the distribution system with DGs. The objective function is to minimize DisCo’s cost. DG techniques, system operation guidelines, and voltage variation standards are described in the constraints. The structure of this paper is as follows. Section II describes the models used in this paper. Section III and IV are the case studies and conclusions, respectively. II.
MODEL DESCRIPTION
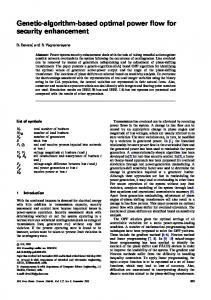
A. Dispatch procedure
Fig. 1. Dispatch procedure for DG embedded distribution system
The proposed model is based on the assumption that DGs are independent and dispatchable. The dispatch procedure is shown in Fig.1. The DNO first receives offers from DGs. The weather conditions and heat loads are predicted to forecast the generation of renewable based DGs and CHPs for source-load matching. Based on this, the dispatch model is established. The objective of this model is to minimize the total cost of DisCo for energy supply, subjected to following constraints: y Active power of renewable DGs: Maximum outputs of renewable DGs are subjected to generator capacities and weather conditions. On the other hand, in many countries, minimum outputs of renewable DGs are guaranteed in terms of laws, operation guidelines, or other terms from policy makers. In this paper, wind power generation and hydro power plant are considered as renewable DGs. y Active power of CHP: The most commonly used CHP is steam turbine based CHP, which can be divided into two types, back-pressure CHP and condensing CHP. For the former one, all steam passes through the turbine and active power is determined only by heat demand [5]. While, condensing CHP can extract steam from the turbine for heat supply [5]. Its active power is adjustable [7].
3
y
y
y
y
Active and reactive power characteristics (P-Q characteristics) of generators: P-Q characteristics affect system voltage profile significantly. Therefore, detailed steady state generator models are used in this paper. The output of synchronous generator is subjected to its field heating, armature heating and end region heating. Induction generator outputs are subjected to armature heating and slip. Reactive power control of synchronous generator: At fixed power factor mode, the proportion between active power and reactive power is a constant. While in voltage control mode, generator terminal voltage is kept constant by adjusting generator reactive power. AVR control strategy: The set point of the substation secondary side voltage is constant in the conventional AVR, while flexible in active management mode. Compensator performance: The equivalent admittances of fixed capacitors are constant. While those of SVCs are adjustable.
B. Objective function The objective function is to minimize DisCo’s cost: MIN [( PS * ρ S ( PS ) + ∑ PDGi * ρ DGi )]
⎧ 2 VDGi * Eq , DGi 2 V 2 ] ⎪ PDGi + (QDGi + DGi ) ≤ [ ⎪ xs , DGi xs, DGi ⎨ 2 2 2 PDGi + QDGi ≤ S DGi ⎪ Q ≥ Q ⎪⎩ DGi min, DGi For induction generator [20]: 2 ⎧ −reVDGi ⎪ PDGi = ⎪⎪ re2 + xe2 ⎨ xe PDGi ⎪QDGi = re ⎪ 2 2 2 ⎪⎩ PDGi + QDGi ≤ S DGi
y
C. Constraints The constraints are introduced as following: y Power balance constraints:
In this paper, V = 0.93 and V = 1.07 . y AVR control strategy: If conventional AVR is used: VS = Vset
(12)
(3)
k =1
N
QGj − QDj = V j ∑ Vk (G jk sin θ jk − B jk cos θ jk )
(4)
y
k =1
y
Active power of renewable DG: PDGi ≤ PDGi ≤ PDGi For wind power generation [5]: PDGi = min[0.5η w ρ w ACwV 3 , PDGi ,W ]
(5)
G2 ΔH ηg . 3600 P-Q characteristics of DG: For synchronous generator [20]: 3
PDGi ,CHP = ∑ a n G1n − n =1
y
y
(10)
In this paper, Vset = 1.05 pu . If active management is used in AVR: VS ≤ VS ≤ VS
(13)
In this paper, VS = 1.0 and VS = 1.07 . Bus voltage variation boundaries V ≤ Vj ≤ V
(14)
Compensator performance: For fixed capacitor: QC , j = V j2 * QC' , j
(15)
For SVC:
For hydro power plant [5]: PDGi = min[QHη h ρh g , PDGi , H ] In this paper, it is assumed that PDGi = 0.5 PDGi . y Active power of CHP: For back-pressure CHP [7]: PDGi = (a1 − a2 p )G + a2 For condensing CHP [7]: PDGi ≤ PDGi ≤ PDGi
⎧ rr xm2 S + rs ⎪ re = 2 ⎪ rr + S 2 ( xr + xm )2 ⎨ 2 2 ⎪ x = xm rr + xm xr ( xm + xr ) S + x s ⎪ e rr2 + S 2 ( xr + xm )2 ⎩ Reactive power control of synchronous generators: Fixed power factor mode:
(11)
N
PGj − PDj = V j ∑ Vk (G jk cos θ jk + B jk sin θ jk )
(9)
2 2 PDGi / PDGi + QDGi = PFDGi Voltage control mode: V ≤ VDGi ≤ V
(1)
In this paper, the relationship between ρ S ( PS ) and PS is described by a linear function. ρ S ( PS ) = a * PS + b (2)
(8)
V j2 * QSVC , j ≤ QSVC , j ≤ V j2 * QSVC , j
(16)
III. CASE STUDY
(6) (7)
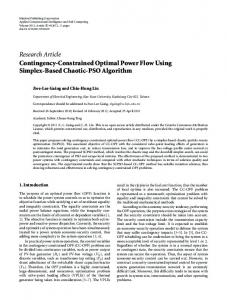
The test system shown in Fig.2 is a 10kV system with a substation, three DGs, and two compensators. The system data is given in Appendix (Table VI). DG types and capacities are shown in Table I. DG parameters are given in Appendix (Table VII). DG offers and electricity price of power grid are in Table II. The offer of condensing CHP is higher than that of back-pressure CHP. The scenarios are in Appendix (Table VIII). They created are to investigate the sensitivities of DisCo’s cost to different technique options. In case A, all DGs are synchronous machines; back-pressure CHP and condensing CHP are applied in A1 and A2, respectively. In case B, DG1 and DG2 are induction machines and DG3 is a synchronous machine.
4
DG3 uses back-pressure CHP in B1, while condensing CHP in B2. In case C, all DGs operate in fixed power factor mode. In case D, active management is used in AVR; and SVC is used in D2. 22 23 24
0
1
2
3
4
DG3
5
25 26 27 28 29 30
6 7 8
18 19 20 21
9
10
31
…
11
32
...
17
A1 A2 B1 B2 C1 C2 C3 C4 C5 D1 D2
DG2
Bus Type Capacity(MVA) DG1 17 Hydro power plant 0.75 DG2 21 Wind power generation 0.6 DG3 24 CHP 0.8 TABLE II DG OFFERS AND ELECTRICITY PRICE FROM POWER GRID DG1 23$/MWh DG2 75$/MWh DG3 26$/MWh for Back-pressure CHP;40$/MWh for Condensing CHP ρ S ( PS ) = 3PS + 23($/MWh) Power Grid
The expected DG biddable generation capacities according to predicted wind speed, predicted flow rate and predicted heat demand are shown in Table III. TABLE III EXPECTED BIDDABLE GENERATION CAPACITIES OF DGS [0.2, 0.4] MW [0.15, 0.3] MW 0.365 MW for back-pressure CHP [0.269, 0.8] MW for condensing CHP
Table IV shows dispatch result for each scenario according to the demand given in Table VI. Table V are the dispatch results in cases that demand increases by 20 percent. TABLE IV DISPATCH RESULT FOR THE DEMAND IN TABLE VI Active power of DGs and power grid (MW)
A1 A2 B1 B2 C1 C2
0.4000 0.4000 0.3952 0.4000 0.4000
0.1500 0.1500 0.1500 0.1500 0.1500
0.6325 0.6706 0.5711 0.6447 0.5496
2.6935 2.6714 2.8015 2.6441 2.6268
6.9253 7.3662 8.0764 5.8988 2.7975
Active power of DGs and power grid (MW) DG1
TABLE I DG TYPES AND CAPACITIES
DG3
129.4670 130.1263 131.1616 128.0273 123.5511
TABLE V DISPATCH RESULT IF THE DEMAND IN TABLE VI INCREASES 20 PERCENT
Fig. 2. Test system
DG1 DG2
C3 C4 C5 D1 D2
Total cost ($)
DG1
DG2
DG3
Power grid
Distribution loss (%)
123.4493 128.2513 124.1925 128.9655 129.0413 129.2035
0.4000 0.4000 0.4000 0.4000 0.4000 0.4000
0.1500 0.1500 0.1500 0.1500 0.1500 0.1500
0.3654 0.6358 0.3654 0.6482 0.5681 0.5992
2.9387 2.6591 2.9570 2.6647 2.7482 2.7207
6.3206 6.0645 6.8245 6.5611 6.6572 6.7578
Total cost ($)
DG1
DG2
DG3
Power Grid
Distribution loss (%))
156.8114 159.4023 157.3402 159.9486 160.9470 160.7992 160.7170 160.9865 161.9093 159.3878 155.0934
0.4000 0.4000 0.4000 0.4000 0.4000 0.4000 0.4000 0.4000 0.4000 0.4000 0.4000
0.1500 0.1500 0.1500 0.1500 0.1500 0.1500 0.1500 0.1500 0.1500 0.1500 0.1500
0.3654 0.7902 0.3654 0.7929 0.6799 0.7201 0.7637 0.8000 0.7637 0.7917 0.7793
3.7153 3.2713 3.7269 3.2816 3.4097 3.3692 3.3268 3.2992 3.3545 3.2696 3.1799
6.4522 6.0115 6.7204 6.3099 6.6574 6.6501 6.6781 6.8786 7.3148 6.0059 3.6589
A. Discussions Based on the results in Table III and Table V, the following can be found y Using back-pressure CHP can reduce the total cost. In Table IV and Table V, the total costs in A1 and B1 are lower than those in A2 and B2, respectively. This is because back-pressure CHP has higher coal utilization rate; thus, can provide lower offer. y Compared with back-pressure CHP, condensing CHP can improve distribution efficiency. This can be observed in Case A and Case B where the distribution losses in A1 and B1 are higher than those in A2 and B2, respectively. This is due to the adjustability of CHP active power. Back-pressure CHP can not adjust active power in a given heat load, while condensing CHP can adjust both active power and reactive power. y Synchronous generator has potential advantage to improve distribution efficiency rather than induction generator. However, this potential advantage is achieved only if appropriate reactive power control scheme is used. The distribution losses in A1 and A2 are lower than B1 and B2, respectively. This fact illustrates that distribution efficiency can be improved if induction generator is replaced by synchronous generator with voltage control mode. While fixed power factor mode is not able to reduce distribution loss. For example, distribution losses of C1-C5 are higher than loss of B2. y Distribution loss varies with power factor set point and load level. Take Case C for example, in Table IV, distribution loss increases scenario by scenario; while in Table V, C2 has a distribution loss lower than losses in C1, C3, C4 and C5. y The enhancement of system flexibility can reduce total cost and distribution loss. This can be investigated from Case D. In D1, substation secondary side voltage is
5
variable and capacitors are fixed; it has lower cost and distribution loss than those in A2, B2 and Case C, whose substation secondary side voltages and capacitors are fixed. In D2, SVC is employed to replace fixed capacitors; the cost and distribution loss in D2 are even lower than those in D1. IV. CONCLUSION This paper proposed an OPF based dispatch model for distribution systems with independent DGs. This model aims to allocate DG outputs according to electricity price signals, load forecasting, and weather forecasting, while take into account operation and security constraints. Cases are studied to verify the impact of technical factors, such as steam turbine types, generator types, reactive power control, AVR control, and compensator, on DisCo’s cost and distribution losses. Back-pressure CHP can reduce DisCo’s cost, however, it results in higher distribution losses due to lack of active power controllability. One feasible solution to reduce cost as well as enhance distribution efficiency is to improve system flexibility, such as using synchronous generator with voltage control mode, managing AVR actively, and installing SVC. V.
APPENDIX
TABLE VI PARAMETERS OF 33-BUS DISTRIBUTION SYSTEM Branch Sending end Receiving end 1 2 1 18 1 0 2 3 2 22 3 4 4 5 5 6 5 25 6 7 7 8 8 9 9 10 10 11 11 12 12 13 13 14 14 15 15 16 16 17 18 19 19 20 20 21 22 23 23 24 25 26 26 27 27 28 28 29 29 30 30 31 31 32 Fixed capacitor on bus9 Fixed capacitor on bus32
r(pu) 0.493 0.164 0.0992 0.366 0.4512 0.3881 0.819 0.1872 0.203 0.7114 1.03 1.044 0.1966 0.3744 1.468 0.5416 0.591 0.7463 1.289 0.732 1.5042 0.4095 0.7089 0.898 0.896 0.2842 1.059 0.8042 0.5075 0.9744 0.3105 0.341
Load on sending end x(pu) P(MW) Q(Mvar) 0.2511 0.1 0.06 0.1563 0.09 0.04 0.047 0.12 0.08 0.1864 0.06 0.03 0.3083 0.06 0.02 0.1941 0.2 0.1 0.707 0.2 0.1 0.6188 0.06 0.02 0.1034 0.06 0.02 0.2351 0.045 0.03 0.74 0.06 0.035 0.74 0.06 0.035 0.065 0.12 0.08 0.1238 0.06 0.01 1.155 0.06 0.02 0.7129 0.06 0.02 0.526 0.09 0.04 0.545 0.09 0.04 1.721 0.09 0.04 0.574 0.09 0.04 1.3554 0.09 0.04 0.4784 0.09 0.05 0.9373 0.42 0.2 0.7091 0.42 0.2 0.7011 0.06 0.025 0.1447 0.06 0.025 0.9337 0.06 0.02 0.7006 0.12 0.07 0.2585 0.2 0.6 0.963 0.06 0.04 0.3619 0.21 0.1 0.5302 0.06 0.04 2.25Mvar 0.4Mvar
SVC on bus9 SVC on bus32 Base Voltage Base Capacity
[-4.5Mvar, 4.5Mvar] [-0.8Mvar, 0.8Mvar] 10kV 100MA TABLE VII PARAMETERS OF DGS
Base Voltage(kV) Base Capacity(MVA) xs(pu) Synchronous generator E ( p u ) q
Induction generator
rs(pu) xs(pu) rr(pu) xr(pu) xm(pu)
DG1 10 0.75
DG2 10 0.6 1.536 2.231 0.0241 0.139 0.22 0.351 9.1
DG3 10 0.8
-
VI. REFERENCES [1] [2] [3] [4] [5] [6] [7]
[8] [9] [10]
[11] [12] [13]
Jörss, W., Jørgensen, B.H., Löffler, P., Morthorst, P.E., Uyterlinde, M., Sambeek, E. van, Wehnert, T, Decentralized power generation in the liberalized EU energy markets. Berlin: Springer-Verlag, 2003. Nick Jenkins, Ron Allan, Peter Crossley, Daniel Kirschen, Goran Strbac. Embedded generation. London: The institution of electrical engineers, 2000. Ni Jingfeng, “The Study and Software Implementation for the HeatLoad-based CHP Units,” Master dissertation, Department of thermal engineering, North China Electric Power University; 2004. Refoufi, L. Al Zahawi, B.A.T., “Analysis and modeling of the steady state behavior of the static Kramer induction generator,” IEEE Trans. Energy Conversion, vol. 14, no. 3, pp. 333-339, May 1999. Wasynczuk, O, “Modeling and Dynamic Performance of a LineCommutated Photovoltaic Inverter System,” IEEE Power Engineering Review, vol.9, no. 9, pp. 35-36, 1989. Wasynczuk, O., Anwah, N. A, “Modeling and dynamic performance of a self-commutated photovoltaic inverter system,” IEEE Power Engineering Review, vol.9, no. 9, pp. 33-34, 1989. Vovos, P.N., Kiprakis, A.E., Wallace, A.R., Harrison, G.P., “Centralized and distributed voltage control: impact on distributed generation penetration,” IEEE Trans. Power System, vol. 22, no. 1, pp. 476-483, 2009. China State Grid, Management Guide for Power System Voltage and Reactive Power. Beijing: China State Grid, Jan. 2005. Viawan, F.A., Karlsson, D, “Voltage and reactive power control in systems with synchronous machine-based distributed generation,” IEEE Trans. Power Delivery, vol. 23, no. 2, pp. 1079-1087, 2008. Viawan, F.A., Karlsson, D., “Combined local and remote voltage and reactive power control in the presence of induction machine distributed generation,” IEEE Trans. Power System, vol. 22, no. 4, pp. 2003-2012, 2007. Liew, S.N., Strbac, G., “Maximising penetration of wind generation in existing distribution networks,” Generation, Transmission and Distribution, IEE Proceedings, vol. 149, no.3, pp. 256-262, 2002. Shafiu, A., Bopp, T., Chilvers, I., Strbac, G, “Active management and protection of distribution networks with distributed generation,” in 2004 Power Engineering Society General Meeting, pp.1098-1103. Wang, D.T.-C., Ochoa, L.F., Harrison, G.P., “Assessing the economic impact of distributed generation on voltage regulation in distribution networks,” in 2008 Universities Power Engineering Conference, pp.1–6.
6 TABLE VIII SCENARIOS FOR CASE STUDY DG1 DG2 DG3 Reactive power Reactive power Reactive power CHP Gen Type@ Gen Type@ AVR@ Compensator control@ control@ control@ Technique@ Constraints Constraints Constraints @Constraints Constraints Constraints Constraints Constraints Syn.@(8) VC@(11) Syn.@(8) VC@(11) Syn.@(8) VC@(11) BP@(6) FX@(12) FC@(15) Syn.@(9) VC@(11) Syn.@(8) VC@(11) Syn.@(8) VC@(11) CO@(7) FX@(12) FC@(15) Ind.@(9) Ind.@(9) Syn.@(8) VC@(11) BP@(6) FX@(12) FC@(15) Ind.@(9) Ind.@(9) Syn.@(8) VC@(11) CO@(7) FX@(12) FC@(15) Syn.@(8) PF@(10)@0.85Lag Syn.@(8) PF@(10)@0.85Lag Syn.@(8) PF@(10)@0.85Lag CO@(7) FX@(12) FC@(15) Syn.@(8) PF@(10)@0.90Lag Syn.@(8) PF@(10)@0.90Lag Syn.@(8) PF@(10)@0.90Lag CO@(7) FX@(12) FC@(15) Syn.@(8) PF@(10)@0.95Lag Syn.@(8) PF@(10)@0.95Lag Syn.@(8) PF@(10)@0.95Lag CO@(7) FX@(12) FC@(15) Syn.@(8) PF@(10)@1.0 Syn.@(8) PF@(10)@1.0 Syn.@(8) PF@(10)@1.0 CO@(7) FX@(12) FC@(15) Syn.@(8) PF@(10)@0.95Lead Syn.@(8) PF@(10)@0.95Lead Syn.@(8) PF@(10)@0.95Lead CO@(7) FX@(12) FC@(15) Syn.@(8) VC@(11) Syn.@(8) VC@(11) Syn.@(8) VC@(11) CO@(7) AM@(13) FC@(15) Syn.@(8) VC@(11) Syn.@(8) VC@(11) Syn.@(8) VC@(11) CO@(7) AM@(13) SVC@(16) Syn.: synchronous generator; Ind.: induction generator; VC: voltage control mode; PF: power factor control mode; BP: back-pressure CHP; CO: condensing CHP; FX: fixed substation secondary side voltage; AM: active management; FC: fixed capacitors;
Gen Type@ Case Scenario Constraints A B
C
D
A1 A2 B1 B2 C1 C2 C3 C4 C5 D1 D2
[14] Power Quality application Guide, Voltage Disturbances, EN 50160, IEE, July 2004. [15] IEEE recommended Practice for Monitoring Electric Power Quality, IEEE Standard 1159-1995, 1995. [16] Power Quality Acceptable Deviation of Voltage for Supplying Power, Chinese Standard GB/T 12325-2003, 2003. [17] Senjyu, T., Miyazato, Y., Yona, A., Urasaki, N., Funabashi, T., “Optimal distribution voltage control and coordination with distributed generation,” IEEE Trans. Power Delivery, vol. 23, no. 2, pp. 1236-1242, 2008. [18] Palma-Behnke, R., A, J.L.C., Vargas, L.S., Jofre, A, “A distribution company energy acquisition market model with integration of distributed generation and load curtailment options,” IEEE Trans. Power System, vol. 20, no. 4, pp. 1718-1727, 2005. [19] National Code for Renewable Energy, Chinese Public law, 2005. [20] A. E. Fitzgerald, Charles Kingsley, Jr, Stephen D. Umans, Electric machinery. Beijing: Tsinghua University Press, 2003.
VII. BIOGRAPHIES Yufeng Lin (S'08) was born in Fujian, China, in March 1982. He received the BS degree from North China Electric Power University, China in 2003 and MS degree from Zhejiang University, China in 2006. He is now a PhD student in the Department of Electrical and Electronic Engineering, the University of Hong Kong. His main fields of interest are renewable energy and smart grid. Jin Zhong (S'00, M'05) received the B. Sc. (Eng.) degree from Tsinghua University, Beijing, China, in 1995 and the M. Sc. (Eng.) degree from the Electric Power Research Institute, Beijing, in 1998, and the Ph.D degree from Chalmers University of Technology, Gothenburg, Sweden, in 2003. She is an Assistant Professor in the Department of Electrical and Electronic Engineering at the University of Hong Kong. Math Bollen (M’93–SM’96–F'05) received the M.Sc. and Ph.D. degrees from Eindhoven University of Technology, Eindhoven, The Netherlands, in 1985 and 1989, respectively. Currently, he is manager power quality and EMC at STRI AB, Ludvika, Sweden and guest professor at Luleå University of Technology, Skellefteå, Sweden. Before joining STRI in 2003, he was research associate at Eindhoven University of Technology, lecturer at the University of Manchester Institute of Science and Technology (UMIST), Manchester, U.K., and professor in electric power systems at Chalmers University of Technology, Gothenburg, Sweden. His current research interests include power quality, reliability, and integration of distributed generation and wind power in the grid. He has published more than 100 papers including a number of fundamental papers on voltage dip analysis and two textbooks on power quality, "understanding power quality problems" and "signal processing of power quality disturbances".