TITLE:
Modelling the Lean Startup: A Simulation Tool for Entrepreneurial Growth Decisions
TRACK: Model-Based Strategy Assessment in Virtual Environments for Sustainable Entrepreneurship (Cosponsored by Strategic Management and Entrepreneurship)
Karl Täuscher* Fraunhofer Center for Central and Eastern Europe Neumarkt 9-19, 04109 Leipzig, Germany Department of Innovation Management and Innovation Economics Grimmaische Straße 12, 04109 Leipzig, Germany
[email protected]
Nizar Abdelkafi Fraunhofer Center for Central and Eastern Europe Neumarkt 9-19, 04109 Leipzig, Germany Department of Innovation Management and Innovation Economics Grimmaische Straße 12, 04109 Leipzig, Germany
[email protected]
*Corresponding author
The paper should be cited as follows: Täuscher, Karl & Abdelkafi, Nizar (2065): Modelling the Lean Startup: A Simulation Tool for Entrepreneurial Growth Decisions. Proceedings of the 16th EURAM Conference, Paris, June 1 – 4 2016. 1
Abstract: Growth-oriented ventures face the challenge of focusing their limited resources on a suitable growth strategy. Extant research argues that successful startups build their growth strategy around reinforcing feedback loops. The “lean startup” literature suggests that entrepreneurs should identify the dominant feedback loop driving the growth of their business and consequently focus their resources on this “engine of growth”. The framework gains increasing popularity among entrepreneurs and investors; yet, they struggle to objectively assess and compare the strength of different feedback loops. This research therefore develops a decision support tool to support entrepreneurs in their strategic growth decisions. The tool builds on a System Dynamics simulation model that allows experimenting with different future scenarios and growth assumptions. The paper applies the decision tool to compare the growth potential of three stylized startups. Based on the modelling practice and simulation runs, it derives implications for entrepreneurs aiming at growing their business. Finally, it makes propositions on how to advance the underlying theoretical framework.
Key Words: Decision Support, Technology Entrepreneurship, Lean Startup, System Dynamics, Simulation Model, Growth Strategy
2
1
Introduction
“A startup is a company designed to grow fast. Being newly founded does not in itself make a company a startup. Nor is it necessary for a startup to work on technology, or take venture funding, or have some sort of "exit." The only essential thing is growth. Everything else we associate with startups follows from growth.” (Graham, 2012) For startups, rapid growth often represents an imperative growth strategy. Rapid growth provides startups with better access to venture capital funding and human talent, allows them to rapidly develop newly created markets and create barriers to entry, or develop a competitive advantage in existing markets through the generation of economies of scale and network effects (Eisenmann et al., 2007). Consequently, entrepreneurs and investors strongly focus on building and identifying startups with sustainable growth models. Empirical evidence, however, shows that most entrepreneurial ventures never achieve sustaining growth dynamics and therefore die within the first five years of their existence (Shane, 2009). This poses the question: How can startup entrepreneurs design and accelerate sustainable growth models? Literature on strategy and entrepreneurship has developed a large body of knowledge of the growth drivers of different types of ventures. Yet, there is no common theoretical perspective that prescriptively supports growth decisions for startups. Over the last years, the “lean startup” approach has seen an increasing adoption by entrepreneurs (York and Danes, 2014). The lean startup describes an approach for building and growing startups, based on the assumption that a startup is an organization in search for a scalable business model (Blank, 2013). The approach emphasizes the rapid cycles of hypothesis-based business experimentation directed at generating new insights and validating the venture’s value and growth
3
hypotheses (Ries, 2011). Based on this philosophy, the related literature (Ries, 2011, 2014, Maurya, 2012, Blank, 2013) proposes actionable frameworks, tools, and techniques to support entrepreneurs in building and testing business models and strategies for rapid growth. Pioneered by Eric Ries in 2008, the lean startup philosophy has developed into a global movement of Lean Startup circles, conferences, and an increasing body of literature aiming at developing suitable tools to incorporate the Lean Startup principles into entrepreneurial practice. Business schools from leading universities such as Harvard and UC Berkeley teach courses on the principles of the “lean startup” in their entrepreneurship education (Greenwald, 2012). Still, there is a lack of academic research and validation of the Lean Startup principles and propositions (e.g., Bosch et al., 2013). A key proposition of the lean startup approach is that startups can grow sustainably if they can build self-reinforcing growth models. “Sustainable growth follows one of three engines of growth: paid, viral, or sticky. By identifying which engine of growth a startup is using, it can then direct energy where it will be most effective in growing the business” (Ries, 2011, p. 182). The concept of the “engines of growth” (EoG) describes three distinctive reinforcing feedback loop that are driven or inhibited by a set of unique variables, leading to a decreasing, constant, or exponentially increasing growth rate. By focusing on the loop strength, one can isolate the sustaining growth potential from growth driven by one-time events such as being featured in a major media outlet or winning a startup competition. These events can be seen as noise in analyzing the venture’s future growth path and potential. Ries further argues that startups should select the set of metrics for performance measurement based on their dominant engine of growth to avoid distraction from seemingly impressive, but misleading metrics. Consequently, he suggests that entrepreneurs should analyze which of the three loops is dominant in their particular business to select the one 4
that promises the largest growth potential. For one of the engines – the viral loop – he proposes a generalizable metric to measure the loop strength—the so-called “viral coefficient”. This metric has become increasingly popular to assess startups and their growth paths (Eisenmann, 2012). Yet, so far, the two remaining loops have not been formally operationalized, thus leading to misrepresentations and flawed conclusions (Ries, 2011). This research aims at advancing the understanding and applicability of the EoG framework through a formal simulation model. Given its focus on identifying and representing feedback loops in a dynamic system, System Dynamics offers a suitable simulation paradigm for this objective. System Dynamics (SD) simulation models can effectively support managerial decision making in complex environments through their combination of graphical modelling of system structures, quantitative operationalization of cause and effect relationships, and its systemic perspective (Senge, 1990; Warren, 2008). SD simulation models have been successfully applied to advance theoretical understanding of entrepreneurial growth strategies (e.g. Oliva et al., 2003), to explain and support managerial decision making (e.g., Delauzun and Mollona, 1999; Grasl, 2009; Abdelkafi and Täuscher, 2016). Simulation models enable decision makers to overcome cognitive limitations and provide a tool for experimentation (Kunc and Morecroft, 2010). The intended contribution of this article is to develop a decision support tool for early-stage entrepreneurs and investors to facilitate strategic growth (and investment) decisions. To do so, we transform the conceptual EoG framework by Ries (2011) into a formal and applicable model. The process and outcome of formal System Dynamics modelling allows one to recognize missing, inconsistent, or unrealistic assumptions about a system. Thus, this research also aims to advance the theoretical understanding of new venture growth in general, and the EoG framework in particular. Finally, the research is motivated by the quest for empowering entrepreneurs through 5
new tools to support their strategic growth decisions (Pidd, 2003). While the decision support tool and the theoretical findings aim at a high generalizability, the paper primarily focuses on technology ventures. The paper is structured as follows. The next section provides an overview of the specific growth requirements for early-stage technology ventures and presents the background information regarding the EoG framework. The third section describes the developed simulation model and proposes key metrics for the objective assessment and comparison of the EoG. Section four applies the simulation model to three startups to assess their preferable growth strategy. Section five discusses the plausibility of the experimentation results, their consequences regarding the ventures’ strategic growth decisions, and the general value of the EoG framework. The final section draws conclusions and provides directions for future research.
2
Growth of new technology ventures
Necessity of rapid growth for new technology ventures Scholars from entrepreneurship and strategy have been concerned with the benefits of firm growth for decades. “Growth helps to establish legitimacy, achieve economies of scale, attract investment capital, and increase profitability. Rapid growth is even better”, argues Nicholls-Nixon (2005, p. 86). He finds that “fast-growing enterprises represent only 3–5 percent of all companies in the United States, [but] they make a disproportionate contribution to wealth creation and employment. So it is not surprising that rapid growth is seen as the business equivalent of a birdie, a touchdown, or a home run on the field of dreams”. Delmar et al (2003), Barringer et al. (2005) and Davidsson and Wiklund (2013) provides a comprehensive overview of different drivers and paths of rapidly growing ventures. Literature studying such ventures finds that “growth is a top strategic priority
6
for a large percentage of firms” (Barringer et al., 2005, p. 664). Thus, entrepreneurship research has been interested in new venture growth for decades. For technology ventures, the ability to grow rapidly is often a necessary condition for superior firm performance. Technological advances lead to a fast entry and exit of players, a potential disruption of established industries, and frequent emergence of new markets (Eisenmann, 2006). In such environments, high growth is a prerequisite for survival and is often linked to First-Mover Advantages, access to distribution channels, and long-term loyalty of customers (Markman and Gartner, 2002). Technology ventures often show large economies of scale due to high initial development costs, a high level of reproducibility and low capacity constraints (Brousseau and Penard, 2007). Technology ventures offering software-based products often exhibit non-rivalry in usage and can therefore serve a large number of customers simultaneously (Slywotzky and Morrison, 2001), incur low variable costs of product delivery and reproduction (Javalgi et al., 2004) and show low material product attrition (Grover and Ramanlal, 2005). Moreover, such ventures often operate in a market and competitive environment which takes place at a global scale since these ventures can offer their products to customers around the world via digital distribution channels (Porter, 2001; Slywotzky and Morrison, 2001; Afuah and Tucci, 2001; Javalgi et al., 2004). The continuous fall of search and communication costs has further decreased transaction costs for consumers (Afuah and Tucci, 2001; Brousseau and Penard, 2007), leading to (relatively) low switching costs (Kim et al., 2004). From a competitive perspective, higher transparency among offerings and prices leads to easier imitation and lower differences between competitors’ products and services (Porter, 2001). Besides, many of such markets share the presence of network effects, which reinforces the incentive to strive for market dominance (Eisenmann, 2006). Network effects describe the (mostly positive) effect of an increased network attractiveness as a function of an 7
increasing network size. Research on businesses and markets that exhibit network effects has shown that larger networks result in greater profit margins and reinforcing returns (Rothaermel and Sugiyama, 2001). Thus, the presence of strong network effects in a market often leads to winner-takes- all (WTA) market dynamics that promise superior returns once a venture has successfully developed a dominant market position (Sun and Tse, 2007). As a consequence of the product- and environment-related characteristics, many technology entrepreneurs initially focus on maximizing the growth of their customer base instead of optimizing their profitability. Engines of growth Literature on how startups sustainably grow their customer base over an extended period of time is rather scarce. Different scholars have argued that firms can grow sustainably if they build and sustain reinforcing feedback loops (Casadesus-Masanell and Ricart, 2010; Täuscher and Abdelkafi, 2015, Abdelkafi and Täuscher, 2016). Reinforcing feedback loops – a concept from systems thinking – describes a design characteristic of systems in which the increase of one component influences (a series of) other components that reinforce the growth of the original component. Identifying such reinforcing loops can help in the process of designing effective business models (Abdelkafi and Täuscher, 2014) or competitive strategies (Casadesus‐Masanell and Zhu, 2013). The strategies for rapidly growing a customer base can be divided into paid and organic strategies for customer acquisition (Blank, 2013). Paid customer acquisition refers to all forms of acquisition as a direct or indirect consequence of the firm’s sales and marketing activities. The relationship between customer acquisition spending and firm performance has been typically described as Ushaped (Eisenmann, 2006) where additional investment in customer acquisition only increases the firm performance until a certain point. Other authors emphasize the idea that startups should follow 8
a reinforcing trajectory of heavy investment in customer base growth to gain (further) access to financial resources from venture funding or an initial public offering (IPO) (Bárbara et al., 2014). Organic growth strategies refer to all forms of customer acquisition that are not sparked by the firm’s sales and marketing activities. Typically, these growth strategies build on the logic of diffusion models from other disciplines such as biology. Once an entrepreneurial team has attracted a number of customers (e.g. through their personal network), the existing customers become potential sources of “infection” for new customers. As such, the existing customer base can be seen as a key resource to the firm. Literature has mainly focused on diffusion dynamics based on word-of-mouth, in which satisfied customers recommend the business or its product(s) to their personal networks and therefore become free ambassadors to the firm (Bass, 1969; Mahajan et al., 1990; Radas, 2006). The three engines of growth proposed by Ries (2011) include both types of growth strategies. The “paid engine of growth” builds on the logic of sustainable investment and reinvestment of the venture’s capital into customer acquisition. The engine is not limited to specific channels or tactics, but encompasses all forms of paid customer acquisition, ranging from paid online advertising on search machines (Google AdWords) to the employment of a sales team. The growth strategy of heavy investment in customer acquisition becomes an engine of growth if the average customer lifetime value (CLV) exceeds the average customer acquisition cost (CAC) (Ries, 2011). The CLV represents the present value of all present and future contributions from the customer minus all future costs associated with serving the customer. Many fast growing technology ventures focus on growing their user base through paid customer acquisition. The transportation startup Uber Technologies, for instance, pays a signup bonus of up to 750 dollars to incentivize individuals to register on their network and work as freelancing chauffeurs for Uber. In practice, the paid engine 9
of growth is often initially sparked and accelerated by venture capital funding, which allows bridging the time gap between the immediate cost of acquiring a customer and the inflow of cash from that relationship in the future (Ries, 2011). The “viral engine of growth” represents an organic growth strategy. The engine is driven by the natural adoption as a side effect of product usage by existing customers. For instance, mail providers and communication applications increase their customer base when customers use the product to send messages to non-customers (which contain a default signature such as “get your free Slack account to communicate in real-time with your team”). File storage and sharing service Dropbox has been growing exponentially because its customers send links of Dropbox files to noncustomers that can only be opened in the Dropbox environment. This provides a concrete incentive for non-customers to register at the Dropbox’s website or download the application. As such, “growth happens automatically as a side effect of customers using the product” (Ries, 2011, p. 212), which is distinctive from word-of-mouth and referral-based transmissions. The strength of the viral EoG increases with the number of contact points between customers and non-customers and the ratio of non-customers that convert to customers from such contact (conversion rate). Ries (2011) proposes the “viral coefficient”, which measures how many new customers will use a product as a consequence of one mew customer adopting the service. The feedback loop underlying the viral engine of growth is stronger when the viral coefficient is larger, leading to exponential growth dynamics when the coefficient exceeds a value of 1.0. For instance, a viral coefficient of 2.0 means that every new customer directly causes the adoption of two additional customers. The “sticky engine of growth” describes a feedback loop driven by high customer satisfaction. This leads to a high retention rate (low churn rate) in the existing customer base and positive 10
referrals from these customers to their personal networks. The retention rate describes the percentage of customers that remain loyal to the business every period, while the churn rate describes the fraction of customers that abandon the business in every period. Ries (2014) argues that ventures that utilize the sticky engine are causing their customers to become addicted to their product and tend to keep them loyal to the platform. Typical examples of exponentially growing businesses using the sticky growth were eBay and Amazon in their entrepreneurial phases. Both businesses did not show high viral effects, but rather provided existing customers with enough value due to a large selection of goods and superior platform functionalities. The underlying feedback loop builds on a positive difference between the number of new customers that are acquired as a direct consequence of positive referrals (word-of-mouth) and the number of customers that leave the company (churn rate). “The rules that govern the sticky engine of growth are pretty simple: if the rate of new customer acquisition exceeds the churn rate, the product will grow. The speed of growth is determined by what I call the rate of compounding, which is simply the natural growth rate minus the churn rate.” (Ries, 2011, p. 211). To date, the paid and sticky EoG are not yet operationalized in a way it is possible to judge their respective strengths.
3
Development of the System Dynamics model
Methodological approach To build the simulation model, we use the process, tools, and guidelines of System Dynamics (SD) modelling. The SD paradigm builds on the assumption that the “behavior of a system arises from its structure” (Sterman, 2000, p. 107). Thus, understanding the causal structure of a system generates insights into its dynamic behavior. SD is particularly useful for analyzing and understanding systems that demonstrate a multitude of interdependencies between its components
11
(we expect the three engines of growth to be partly interdependent). Judging the implication of a seemingly simple decision – such as whether to increase the spending on customer acquisition – will therefore require the consideration of simultaneous and non-linear consequences. System dynamics literature has shown that even experienced systems thinkers often lack the capability of mentally representing simple dynamics of complex systems and has demonstrated the usefulness of SD simulation to overcome cognitive limits of linear thinking and bounded rationality (Sterman, 2002). For entrepreneurial ventures, SD techniques such as causal-loop diagramming are used to represent the entrepreneur’s mental image of the firm and its growth model (Scott et al., 2013). Making these implicit mental models explicit can enhance the entrepreneur’s understanding of the structure of a growth model and can represent a suitable boundary object for communicating and sharing the model with team members, investors, or partners (Morecroft, 2007). SD simulation models can further integrate empirical insights, help quantify assumptions, formalize the relationships between different elements, and ultimately allows the researcher or business manager to run experiments about the venture’s development. System Dynamics scholars have built a set of stylized models and instruments over time. Before building a fully calibrated simulation model, SD modelers use causal-loop diagramming to represent the feedback structure of the system of interest. Causal loop diagrams map the feedback loop structure of systems. A causal loop diagram is a simple map based on three elements: components, interactions between components, and feedback loops. Based on Ries (2011), we develop a causal-loop model for each of the EoG. Then, we transform the qualitative models into stock and flow diagrams and integrate them into a heuristic simulation model. Finally, we calibrate the model to different ventures to test its general consistency, behavior plausibility, and robustness
12
to extreme conditions. The simulation modelling follows the guidelines by Sterman (2000) and makes use of Vensim as simulation software. Paid engine of growth The causal-loop diagram for the “paid engine of growth” is represented in figure 1. It builds on two reinforcing components: cash and customers. The increase in customers from an increase in cash depends on how much cash is reinvested in customer acquisition and on the customer acquisition cost (CAC). The CAC can, for instance, be measured as the product of the cost per impression (e.g. price for Google Ad words) multiplied by the rate of people that convert into a paying customer from that impression. Since technology ventures generally measure and track their CAC, we choose to use this variable directly (representing the efficiency of customer acquisition). The increase in the number of customers, in turn, increases the cash level under the assumption that each customer contributes a cash-equivalent value larger than zero to the firm. The amount of cash created by each additional customer depends on the assumed customer lifetime value (CLV). Similar to the customer acquisition cost, the CLV represents a composite metric that could be further divided into its driving components. The CLV has become a key metric measured by startups (Wouters and Kirchberger, 2015) and can therefore be directly utilized as input parameter to align the decision support tool with existing entrepreneurial practices.
13
Figure 1: Paid loop Whether the loop will accelerate, maintain, or decrease its speed depends on the ratio of these three parameters. An increase of customers by one unit therefore leads to an increase of customers per period by a coefficient that can be calculated with the following equation: fraction of investment in customer acquisition * customer lifetime value ÷ customer acquisition cost
Analogous to the viral coefficient introduced in the previous section, we label this formula as “paid coefficient”. The coefficient is integrated in the stock and flow simulation model (see figure 2). To overcome the challenge of computing simultaneous equations, we introduce a further stock that captures the allocated budget for customer acquisition. In the model, the default mode is that the allocated cash is reinvested directly. Yet, the user of the decision support tool can adjust the spending ratio to account for timely delays in the spending, among others. The amount of customer acquisition spending divided by the customer acquisition cost determines the number of new paid customers, a flow leading from the stock of potential customers to customers.
14
Figure 2: Sub-module paid engine of growth Viral engine of growth The viral engine of growth relies on a different logic. Here, the only reinforcing driver is the number of customers. Given a constant number of invites per customer, each new customer leads to an increase in prospects, which are potential customers that have gained awareness of the product or business. Figure 3 represents the loop.
15
Figure 3: Viral loop As expressed by the viral coefficient, the general loop strength is determined by the following indicator: Invites per customer * conversion rate from invites
Assuming that every customer invites 10 prospects every year, and 10% of these invited prospects convert into customers, the business will – ignoring other growth effects – follow a linear growth trajectory. It is to mention that the loop builds on the assumption that every customer sends invites to a new and independent set of potential customers. To account for the increasing likelihood of customers inviting customers that have already been invited by others, we integrate a balancing feedback loop in the overall model that slightly decreases the flow rate from potential customers to prospects over time based on the ratio of (remaining) potential customers to the initial number of potential customers. This balancing loop has been integrated in many adoption models (e.g., Bass, 1969). Sticky engine of growth The core of the sticky EoG is rather similar to the viral engine. An increase in the customer base leads to an increase in new customers from referral, which will, in turn, increase the customer base in the next period. However, the CLD reveals that the sticky loop is a combination of a reinforcing
16
and a balancing loop. The balancing loop is driven by the churn rate. If the company can retain 100% of its customers every period, the balancing loop will have no effect. With a positive churn rate, the balancing loop in isolation would decrease the number of customers in every period. Considering these two loops together opens an insightful perspective on the sticky engine of growth. The CLD of this engine, depicted in figure 4, represents the simultaneous loops of reinforcing adoption of new customers from referrals (inner loop) and the balancing loop of lost customers (outer loop).
Figure 4: Sticky loop Calculating the sticky coefficient therefore requires the separate calculation of the loop strength of the reinforcing referral-based loop and the balancing loop. Consequently, the combined loop gain per period can be expressed as: Sticky coefficient = (referrals per customer * conversion rate from referrals) – churn rate
17
Model integration To represent the customer flow dynamics from the viral and sticky loop, we develop a further stock that represents the combined number of prospects that are invited from existing customers (either as part of the product usage or through referral). This stock can be interpreted as the pool of prospects that were invited, but have not (yet) become customers. Potential customers and invited prospects represent two separate stocks, providing the key basis for the viral and sticky loop respectively. The separation of these two stocks is further based on the assumption that potential customers that come into contact with the business through either referral or non-personal invites (e.g., e-mail signature) will show different conversion rates. All three loops have a direct impact on the ingoing flow of new customers that increases the stock of customer base; however, only the sticky loop determines the outgoing flow of lost customers. Lastly, we integrate the paid loop with the viral and sticky loop and design a dashboard around the key metrics. The key input and output parameters of the simulation model and their descriptions are provided in table 1. Table 1: Main input and output parameters of simulation model Parameter
Unit
Common Value Range
Description
Customer lifetime value (CLV)
$/customer
0 – 10,000
Customer acquisition cost (CAC) Fraction of cash reinvested in customer acquisition Churn rate
$/customer
0 – 1,000
Dimensionless
0–1
1/period
0–1
Represents the present value of all net contributions (revenues minus direct costs) from a customer over his or her lifetime with the company Represents the cost associated with acquiring a new customer. The share of cash that is reinvested in sales and marketing spending for customer acquisition. The ratio of customers abandoning the business every period.
Referrals per customer
1/period
0 – 50
The average number of contacts to whom an existing customer recommends the business.
18
Invites per customer
1/period
0 – 50
Conversion rate from referrals
1/period
0–1
Conversion rate from invites
1/period
0–1
Total addressable market
Customer
100 – 5 bn
Organic growth rate
1/ period
0–1
Compounding growth rate
1/period
-1 – 1
Paid coefficient
0 – 10*
Viral coefficient
Dimensionless 1/ period
Sticky coefficient
1/ period
-1 – 9*
0 – 10*
The average number of people that observe or hear about a business as a byproduct of one customer using the product. The ratio between potential customers that receive a referral for the firm’s product/service and those that become paying customers. The ratio between potential customers that receive an invite to use the firm’s product/service and those that become paying customers. The total amount of potential customers (people or businesses). The metric describes the number of new customers per period that join the company through non-paid channels as a fraction of the total number of customers. The metric measures the difference between the organic growth rate and the churn rate for every period. It represents the net increase of customers through unpaid adoption as a fraction of the total number of customers. The coefficient expresses the ratio between CLV and CAC. The coefficient expresses the ratio between the new referral-based adoptions per period and the total number of customers. The coefficient expresses the ratio between new unpaid adoptions per customer per period minus the churn rate.
*The value range for the three coefficients is theoretically unlimited on the positive side. To convey the difference between the range of the viral and paid coefficient (non-negative values) to the sticky coefficient, the maximum loop strength of the reinforcing feedback loop is randomly defined as 10.0.
The modelling process and the development of the paid and sticky coefficients have revealed some minor challenges when comparing those metrics. First, the three coefficients relate to a different time horizon. The paid coefficient is independent of the chosen time steps of the model as it compares a one-time value for CAC with a one-time calculation of the CLV (as of today’s present value). In contrast, the other coefficients are calculated on a per-period basis to account for the nature of measuring conversion and churn rates in entrepreneurial practice. Second, the explanations by Ries (2011) in regards to whether the sticky loop incorporates all forms of unpaid
19
customer acquisition (or only those from explicit referrals) are rather ambiguous. Assuming a broad definition would have the consequence that the effects of the sticky and viral loop would strongly overlap. Potential customers that are converted into prospects through existing customers’ product usage would be registered both in the viral and sticky loop. To measure the isolated strength of the sticky loop (based on customer satisfaction), we exclude all other forms of unpaid acquisition when measuring the sticky coefficient. To represent the original framework as closely as possible, we include the metric of “compounded growth rate” as suggested by Ries (the venture’s growth rate from all unpaid acquisition minus the churn rate) in the dashboard. While this metric is useful in recognizing whether the customer base can grow in a self-sustaining manner, it does not allow direct comparison of the sticky loop strength with the other loops. When comparing different growth strategies, entrepreneurs should use the sticky coefficient as suggested above. Third, the sticky coefficient has a slightly differing value range than the other loops. If the churn rate exceeds the adoption from referrals, the customer base will decline. If an equal amount of customers will be acquired from referrals and non-personal invites, the viral coefficient will exceed the sticky coefficient (assuming the presence of customer churn). Entrepreneurs comparing the three coefficients should be aware of these slight differences in their meaning.
4
Applying the simulation model to three entrepreneurial ventures
Application cases To test the applicability and robustness of the simulation model, we calibrate the model to three distinctive types of businesses. While each of the businesses is based on a real startup 1, the
1
The data are primarily collected from the website https://baremetrics.com/open, a platform that allows startups to calculate and track a large number of key metrics such as customer lifetime value or churn rate in real time. On 20
parameter values are rounded and some parameter values are estimated based on reports and surveys for the specific type of business (particularly the conversion rates). The three cases represent stylized models for distinct types of ventures. Table 2: Parameter values for case firms Parameter
Venture 1 (B2C publishing platform)
Venture 2 (SaaS analytics as B2B)
Venture 3 (P2P E-Commerce)
Customer lifetime value (CLV) (in $) Customer acquisition cost (CAC) (in $) Fraction of cash reinvested in customer acquisition Churn rate (per year)
300
1500
300
50
400
40
0.5
0.5
0.5
0.05
0.1
0.4
Referrals per customer (per year) Invites per customer (per year) Conversion rate from referrals (per year) Conversion rate from invites (per year) Total addressable market (in # of potential customers) Initial Customers
2
4
4
5
1
1
0.1
0.2
0.3
0.05
0.1
0.05
1 bn
500,000
1 bn
50000
500
1,000,000
Venture 1 is an online publishing platform that offers a mobile app for individuals to easily publish content on social media. Venture 2 applies a “Software as a Service” (SaaS) business model to provide other startups with a standardized analytics platform (B2B). Venture 3 is a peer-to-peer (P2P) marketplace platform on which individuals sell self-produced content to the network of users. Table 2 represents the stylized parameter values for each of the ventures.
the platform, an increasing number of startups provides transparency about their performance by allowing open access to their data. 21
Dealing with parameter value uncertainty Knowing the precise data makes it possible to calculate the three coefficients. In most cases, however, startups have to deal with uncertainty as well as dynamic changes in their parameter values. These parameters depend on underlying factors such as the attractiveness of the venture’s value proposition, which determines the conversion rates, churn rate or the customer lifetime value. Recall that the lean startup literature considers a startup as a set of value and growth hypotheses. Thus, entrepreneurs should account for the inherent uncertainty of these unproven hypotheses also when making analytical decisions. Hence, literature suggests that entrepreneurs should combine simulation experiments with scenario building (Täuscher and Chafac, 2016). For the purpose of testing the model robustness and generating general insights into the underlying framework, we calculate a worst-case and a best-case scenario. In the best-case scenario, the venture creates such an attractive product that (a) customers increase their spending, doubling the firm’s CLV, (b) allows the firm to increase the conversion rate from referrals, and the conversion rate from invites by 100% each compared to the baseline estimates presented in table 2 and (c) existing customers become half as likely to abandon the business (churn rate equals 50% of baseline assumption). In the worst-case scenario, the venture only achieves 50% of the estimated CLV and conversion rates, while the churn rate is twice as high as in the baseline scenario.
22
Consequently, we calibrate the core model to each of the ventures and run the scenario-based experiments on the management dashboard. Table 3 reports the output values. Table 3: Output values of simulation runs Venture 1 (online B2C publishing platform)
Parameter
Venture 2 (SaaS for startups)
Venture 3 (e-commerce)
Worst case 0.23
Baseline 0.45
Best case 0.99
Worst case 0.43
Base- Best line case 0.81 1.12
Worst case 0.65
Baseline 1.29
Best case 2.41
0.12
0.39
0.87
0.23
0.61
1.07
-0.15
0.89
2.21
1.5
3
6
0.94
1.86
3.75
1.88
3.75
7.5
Viral coefficient
0.125
0.25
0.5
0.05
0.1
0.2
0.05
0.1
0.2
Sticky coefficient
0
0.15
0. 375
0.2
0.6
1.55
-0.2
0.8
2.2
Customers in t=5
90,063
268,677
1.16 mn
1,486
6,704
66,351
442,000
24.6 mn
444 mn
Scenario Organic growth rate (t = 5) Compounding growth rate (t=5) Paid coefficient
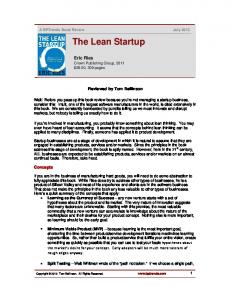
The simulation model shows plausible performance outputs for all simulation runs. Small changes in the coefficients have highly reinforcing implications over time. Figure 5 represents the development of the customer base for each of the three ventures over a time horizon of five years. For the best-case scenarios in which some coefficients exceed the threshold value of 1.0, the customer base grows exponentially. In the worst-case scenarios, which lead to significantly lower coefficients, the growth is much slower. We further test model sensitivity by using different parameter values. Obviously, the relatively small simulation model is sensitive to large changes in parameter values. For example, take the decision of only reinvesting 15% instead of 50% of cash generated from customers into paid customer acquisition (fraction of cash reinvested in customer acquisition). For the baseline scenario of venture 3, this decision would lead to a difference of around 17 million customers after five years (represented in the lower right quadrant of figure 5).
23
Venture 1 (B2C Platform)
Venture 2 (B2B SaaS)
Venture 3 (P2P Marketplace)
Venture 3: Sensitivity to fraction of spending
Figure 5: Customer growth in different scenarios for three ventures
5
Discussion and implications for entrepreneurs
Plausibility and interpretation of simulation results The simulation experiments show a dominance of the paid loop for all three startups. This output seems plausible because in these ventures the customer lifetime value exceeds the customer acquisition cost by a multiple. Startup 1 and 3 show identical paid coefficients (3.0), while startup 2 shows a paid coefficient of 1.85. Startup 2 operates in a B2B field and applies a sales model that incurs estimated customer acquisition costs of $400 per newly acquired (business) customer. In the worst-case scenario, venture 2 shows a paid coefficient of 0.85 and would therefore yield a decreasing growth rate over time (being below the threshold for linear growth of 1.0). The EoG framework would nevertheless suggest that all three startups should invest in paid customer
24
acquisition as the strongest engine of growth since each venture can leverage a loop gain (reinforcement) larger than 1.0, which leads to a compounding return on investment in customer acquisition. In practice, this decision should be supported by qualitative analyses and considerations. The decision regarding the strong expansion of customer acquisition spending depends on the scalability of existing acquisition strategies and the availability of new, equally efficient channels. For instance, the scalability of the sales model of venture 2 depends on the firm’s access to equally qualified sales persons and whether they could be integrated into the sales team with compromising the overall sales efficiency (which would otherwise result in an increase in customer acquisition costs). Venture 1 primarily uses different forms of online advertising, which are generally more scalable. Venture 3 invests its customer acquisition budget mainly in affiliate marketing. Therefore, customer acquisition costs only occur when a new customer is acquired through the affiliate partner. The model allows acquisition costs to grow proportionally and – assuming a sufficient number of affiliate partners – leads to high scalability. Another important factor is related to the assumptions regarding the change of customer lifetime value and customer acquisition cost over time in dependence of different customer cohorts. Geoffrey Moore (2014) argues in Crossing the Chasm that selling technology products to early adopters follows different economics and incurs different costs than marketing the product to a mass market. As such, one could assume a change in the customer lifetime value and customer acquisition costs as a function of the number of paid customers and further specify the simulation model to reflect these assumptions. In addition, entrepreneurs could run further simulation experiments to test whether the investment in paid customer acquisition undermines the unpaid (organic) acquisition engines.
25
The viral coefficient is comparatively small in all three startups. Venture 1, the online publishing platform, shows a viral coefficient of 0.25, while both the SaaS venture as well as the E-commerce platform show coefficients of 0.1. As discussed above, the viral engine of growth only works for specific types of business models. Viral growth is often a function of network effects. The EoG framework and the simulation model aim at providing a high applicability to different types of startups. This lowers their accuracy for some types of businesses. In particular, multi-sided platforms (Hagiu, 2014) – which connect two distinctive customer sides – would require a more nuanced approach. For the case of the E-commerce venture, it is reasonable to assume significant network externalities as the platform grows (Rysman, 2007). Thus, it might be necessary to adapt the simulation model to account for a change in the conversion rates as a function of the increased network size. In the case of a pure multi-sided platforms, where two (or more) customer sides can be clearly separated, entrepreneurs can calculate the viral, sticky, and paid coefficients for each of the market sides separately. However, the coefficients should be adjusted to consider the network externalities between the customer sides. The sticky coefficient is superior to the viral engine of growth for venture 2 and 3. In the best-case scenario, both ventures could generate exponential growth dynamics from their sticky EoG (sticky coefficients of 1.55 and 2.2). However, different assumptions could lead to different decisions. For venture 3, the worst-case scenario would even lead to a negative sticky coefficient. Because of these small changes, the venture would only serve 442,000 customers in year five (less than its initial 1 million customers), compared to 24.6 million customers in the baseline and 444 million customers in the best-case scenario. These extreme performance differences are partly explained by the simplistic mechanism of quantifying parameters for the worst-case and best-case scenarios. Since venture 3 already has a relative high churn rate of 40 percent in the base case, the churn rate
26
increases to 80% in the worst case. Similarly, the high baseline conversion rate from referrals of 30% (given the non-binding and novelty-focused nature of the E-commerce platform) leads to a rather unrealistic conversion rate from referrals of 60% in the best-case scenario. Focusing on the baseline simulation, the sticky engine of growth becomes a clear driver of growth for ventures 2 and 3. Analogous to the other engines, entrepreneurs should further complement these metrics with their assumptions regarding the change in referrals, conversions, and churn rate over time from different customer cohorts. To do so, entrepreneurs can use the simulation software as a dynamic template to adjust parameter values after every simulation step (e.g. 6 months). Implications for theoretical framework The simulation experiments have shown that – contrary to its name and the conceptual framing – the sticky loop is primarily influenced by referral-based acquisition. The amount of “stickiness” of a product or service (expressed through the churn rate) is an important determining factor for the sticky growth. However, its effect size is limited to a value of equal or lower than 1.0 (which would represent a churn rate of 100%). The loop is mostly influenced by the adoption from referral which can exceed the value of 1.0 if new customers recommend the service to more than one noncustomer per period. Thus, the modelling process has revealed a slight conceptual misrepresentation of the sticky loop and could potentially clarify the loop which Ries had diagnosed as the part of the framework that “causes the greatest confusion” (Ries 2008, p. 1). Entrepreneurs should adapt their mental models about the sticky engine of growth to avoid unrealistic growth expectations from reducing the churn rate. A general insight of the simulation process is related to the sensitivity of formula-based growth metrics such as the paid, viral, and sticky coefficient to assumptions about external and internal parameter values. The simulation of these metrics under different parameter scenarios – rather than 27
deterministic calculation – has revealed their sensitivity to parameter assumptions. Especially for new ventures, growth assumptions initially always build on high uncertainties regarding a variety of external factors. The entrance of new competitors or other external shocks will have a direct influence on key parameters such as the conversion rates. Besides, the parameter values depend on the configuration of the business itself. A change in the customer acquisition channels or the revenue model will likely have an impact on the customer acquisition costs or the customer lifetime value. Decisions with long-term implications should not build on the assumption that the business model and environment will not change over the coming several years and should avoid a false sense of certainty about the predictability of the future. The formal simulation approach further advances the understanding of the EoG framework of engines of growth. Table 4 gives an overview of the three EoG, their characteristic growth drivers and barriers (as identified in the model), and the exemplary tactics for accelerating the loop by strengthening the key driver or reducing the key barrier. Table 4: Overview of engines of growth Paid engine of growth
Viral engine of growth
Sticky engine of growth
Key growth driver
High customer lifetime value
Invites as a by-product of product usage
Key growth barrier Growth investment priority
High customer acquisition cost Heavy spending on paid customer adoption
Low conversion rate
High number of referrals from customer satisfaction High customer churn
Exemplary tactics for loop acceleration
Increase CLV through up-selling or cross-selling tactics Decrease CAC through experimentation with different acquisition channels
Product engineering to implement features that lead to product transmission from customers to noncustomers Increase transmissions through tangible incentives for users to invite friends (e.g. create network externalities) Increase conversion rate through facilitated signup process
Creating high value to existing customers (e.g. better service or additional product attributes) Increase customer satisfaction through experimentation with additional value propositions Decrease churn rate through regular promotional offers
28
Judging the effectiveness of the simulation model and underlying framework for entrepreneurial decision support depends on the user’s understanding of the complementary principles, qualitative contingencies, and drivers of the engines of growth. The core of the lean startup methodology builds on the assumption that startups are initially a set of unproven assumptions about how to create value to customers (value hypotheses) and sustainably grow the business (growth hypotheses) (Blank, 2013). For such a perspective, it is important to emphasize that seemingly simple formulas such as the viral coefficient are tools and simplifications, not characteristics of the business itself. Isolating the calculation of the coefficients from considerations of model uncertainty can lead to over-confidence in the analytically identified engines of growth. Consequently, decisions made on the pure basis of such quantitative metrics can be flawed if they ignore the associated uncertainties and specific firm characteristics. A strong paid coefficient provides a good argument for investment in customer acquisition and can become a valuable metric in negotiations with investors. Yet, entrepreneurs that, for instance, ignore actual cash flow management by relying on the present values of future cash flows (represented by the CLV) won’t earn the rewards of these reinforcing engines of growth. Contrary to other types of dynamic systems, these feedback loops do not directly measure the dynamics of a physical system, but rather a conceptualized representation of a part of a business. As such, the EoG and the simulation model should be considered as a tool for decision making rather than a binding law. Following the lean startup principles, entrepreneurs should first test their critical assumptions about the parameter values empirically. Therefore, the effectiveness of the framework and simulation model for decision making ultimately depends on its usage by the entrepreneurial team or investor. The formal modelling further reveals those dynamics that are not explicitly mentioned in the EoG framework. In incorporates particularly the links between the three loops as well as the balancing
29
loop from a decreasing base of potential customers. Thus, the simulation model draws the attention to the fact that the sustainability of all three engines of growth depends on a large population of potential customers. Modelling the causal interdependencies of the customer adoption flows therefore allows recognizing how the three growth engines compete for the same resource. In particular, entrepreneurs focusing on paid customer acquisition should be aware of the fact that this engine of growth limits the speed of organic growth in the long run. However, the model equally reveals a positive influence from the paid loop to the viral and sticky loop. Whether the long-term effect from paid to viral and sticky growth is positive or negative depends on the model’s specific parameter values.
6
Conclusions and directions for further research
This research has developed a simulation model for the conceptual framework of engines of growth (EoG) – paid, viral, and sticky growth – developed by Ries (2011) and increasingly adopted by technology entrepreneurs. The framework primarily serves entrepreneurs in making decisions about their resource allocation and development of tactics for rapidly growing a venture. The simulation model advances the conceptual understanding and the applicability of the framework. Entrepreneurs can utilize the dashboard of the simulation model to run scenario-based simulation experiments to assess and compare the value and uncertainty of their engines of growth. The simulation model further complements the principles of the lean startup methodology by providing a tool that can serve entrepreneurial teams as a boundary object to recognize, discuss, and document key growth assumptions about their model. The simulation model can equally support investors in judging the growth potential of startups.
30
While the simulation model can support decisions regarding the investment of scarce resources, it does not replace the process of deliberate strategizing. Developing a long-term growth strategy requires the consideration of competitive and environmental factors – both are not part of the EoG framework. Using the framework as a complementary approach to traditional forms of growth strategy development can open up new insights into the special requirements and superior growth strategies of technology ventures that aim at rapid growth. Furthermore, future research from the field of strategy could investigate how a systemic perspective on firms can support the identification of sustainable competitive advantages. The main weakness of the EoG framework is that it lacks rigorous empirical validation. Future research can investigate the causal interdependency between the three loops for different types of businesses, study whether one of the engines of growth shows general performance advantages over the others, and inductively investigate whether there exists other key engines of growth. We suggest that entrepreneurship scholars that rigorously investigate the practitioner-driven principles, frameworks, and tools of the lean startup methodology can generate relevant insights for academia and entrepreneurs. The scenario-based simulation experiments with three stylized businesses have revealed the sensitivity of the performance outcomes related to the venture’s growth paths. Since entrepreneurs operate in an environment of high uncertainty, every simulation run can contribute valuable data points for better decision making. The process of recognizing the uncertainties related to the model parameters can limit the risk of over-confidence in the entrepreneur’s growth assumptions. Simulating the sensitivity of the coefficients on changes in one or multiple variables can challenge the entrepreneur’s mental models and reveal the necessity for additional empirical experiments. As such, the decision support tool is in line with the underlying philosophy of the lean startup
31
approach. To validate the decision support tool, further research should investigate its usage in practice to identify cognitive or organizational challenges and identify the framework and tools is applicable to larger firms as well.
32
References Abdelkafi, Nizar; Täuscher, Karl (2014): Understanding the Basic Functioning of Business Models: A Graphical Approach for Theoretical Analysis and Tool Development. Proceedings of the 25th ISPIM Conference. Dublin (Ireland), 6-10 June, 2014. Abdelkafi, Nizar; Täuscher, Karl (2016): Business Models for Sustainability From a System Dynamics Perspective. In: Organization & Environment, Published online before print July 2, 2015, doi: 10.1177/1086026615592930. Available at: http://oae.sagepub.com/content/early/2015/07/01/1086026615592930.full.pdf. Afuah, Allan; Tucci, Christopher (2001): Internet business models and strategies. Text and cases. Boston: Irwin/McGraw-Hill. Argentesi, Elena, Filistrucchi, Lapo (2007): Estimating market power in a two-sided market: the case of newspapers. Journal of Applied Econometrics 22, pp. 1247–1266. Barringer, Bruce R., Foard F. Jones, and Donald O. Neubaum (2005): A quantitative content analysis of the characteristics of rapid-growth firms and their founders. Journal of Business Venturing, 20 (5), pp. 663–687. Bárbara, Larrañeta; Zahra, Shaker A. and Galán González, José Luis (2014): Strategic repertoire variety and new venture growth: The moderating effects of origin and industry dynamism. Strategic Management Journal, 35 (5), pp. 761–772. Bass, Frank (1969): A New Product Growth for Model Consumer Durables. Management Science. 15 (15), pp. 215–227.
33
Blank, Steve (2013): Why the Lean Start-Up Changes Everything. Harvard Business Review, 91(5), pp. 63-72. Bosch, Jan; Holmström Olsson, Helena; Björk, Jens; Ljungblad, Jens (2013): The Early Stage Software Startup Development Model: A Framework for Operationalizing Lean Principles in Software Startups. Lean Enterprise Software and Systems, 167 of the series Lecture Notes in Business Information Processing, pp. 1–15. Brousseau, Eric and Pénard, Thierry (2007): The Economics of Digital Business Models: A Framework for Analyzing the Economics of Platforms, Review of Network Economics, 6, pp. 81–114. Delmar, Frédéric, Per Davidsson, and William B. Gartner (2003): Arriving at the high-growth firm. Journal of Business Venturing, 18 (2), pp. 189–216. Davidsson, Per and Johan Wiklund (2013): New perspectives on firm growth. Cheltenham: Edward Elgar Pub. Ltd. Casadesus‐Masanell, Ramon; Ricart, Joan E. (2010): Competitiveness: business model reconfiguration for innovation and internationalization. Management Research: Journal of the Iberoamerican Academy of Management, 8 (2), pp. 123–149. Casadesus‐Masanell, Ramon; Ricart, Joan E. (2010): From Strategy to Business Models and onto Tactics. Long Range Planning 43, pp. 195–215. Casadesus‐Masanell, Ramon; Zhu, Feng (2013): Business model innovation and competitive imitation: The case of sponsor-based business models. In: Strat. Mgmt. J., 34 (4), pp. 464–482.
34
Eisenmann, Thomas (2006): Internet companies' growth strategies. Determinants of investment intensity and long-term performance. In: Strat. Mgmt. J., 27 (12), p. 1183–1204. Eisenmann, Thomas; Parker, Geoffrey; van Alstyne, Marshall (2007): Platform Envelopment. Working Paper 07-104. Harvard Business School, Boston, MA. Eisenmann, Thomas (2012): Business Model Analysis for Entrepreneurs. Teaching note. Available online: http://radio.shabanali.com/business-model-analysis-for-entrepreneurs.PDF Delauzun, F. and Mollona, E. (1999): Introducing System Dynamics to BBC World Service. An insider perspective. Journal of Operational Research Society, 50: pp. 364–371. Graham, Paul (2012): Startup = Growth. Available online at: http://www.paulgraham.com/growth.html, last retrieved Jan 6th 2016. Grasl, Oliver (2009): Professional Service Firms: Business Model Analysis - Method and Case Studies. Dissertation. Universität St.Gallen, St. Gallen, Switzerland. Online available at http://www1.unisg.ch/www/edis.nsf/SysLkpByIdentifier/3686/$FILE/dis3686.pdf. Greenwald, Tom (2012): Upstart Eric Ries Has the Stage and the Crowd Is Going Wild. Available online at http://www.wired.com/2012/05/ff_gururies/all/1, last retrieved Jan 8th 2016. Grover and Ramanlal (2004): Digital economics and the e-business dilemma. Business Horizons, 2004, 47(4), pp. 71–80. Hagiu, Andrei (2014): Strategic Decisions for Multisided Platforms. In: MIT Sloan Management Review 55 (2). Available online at: http://sloanreview.mit.edu/article/strategic-decisions-formultisided-platforms/.
35
Javalgi, Rajshekhar; Cutler, Bob; Todd, Patricia (2004): An Application of an Ecological Model to Explain the Growth of Strategies of Internet Firms: The Cases of eBay and Amazon. In European Management Journal. 22 (4), pp. 464. Kim, Eonsoo, Nam, Dae-il and Stimpert, J.L (2004). The Applicability of Porter’s Generic Strategies in the Digital Age: Assumptions, Conjectures, and Suggestions. Journal Of Management, pp. 569–589. Kunc, M. H. and J. D. W. Morecroft. 2010. Managerial decision making and firm performance under a resource-based paradigm. Strategic Management Journal, 31(11), pp. 1164–1182. Mahajan, Vijay, Muller, Eitan; Bass, Frank M. (1990). New product diffusion models in marketing: A review and directions for research. The journal of marketing, pp. 1–26. Maurya, Ash (2012): Running Lean: Iterate from Plan A to a Plan That Works (Lean Series). 2nd edition. O'Reilly Media. Markman, G.D. and Gartner, W.B. (2002): Is Extraordinary Growth Profitable? A Study of Inc. 500 High-Growth Companies. Entrepreneurship Theory and Practice, 27 (1), p. 65–75. Moore, Geoffrey (2014): Crossing the Chasm: Marketing and Selling High-Tech Products to Mainstream Customers, 3rd edition. Harper Business Essentials. Morecroft, John (2007): Strategic Modelling and Business Dynamics: A Feedback Systems Approach. Hoboken, NJ: John Wiley & Sons. Nicholls-Nixon, Charlene L. 2005. Rapid growth and high performance: The entrepreneur's "impossible dream?" Academy of Management Executive 19 (1), pp. 77–89.
36
Pidd, Michael (2003): Tools for thinking. Modelling in management science. 2nd ed. Chichester, England, Hoboken, NJ: Wiley. Porter, Michael E. (2001): Strategy and the Internet. Harvard Business Review, March 2001. Radas, Sonja (2006): Diffusion Models in Marketing: How to Incorporate the Effect of External Influence? Privredna kretanja i ekonomska politika, 15(105), pp. 30–51. Ries, Eric (2008): The three drivers of growth for your business model. Choose one. Available online: http://www.startuplessonslearned.com/2008/09/three-drivers-of-growth-for-your.html, last retrieved Jan 3rd 2016. Ries, Eric (2011): The Lean Startup: How Today's Entrepreneurs Use Continuous Innovation to Create Radically Successful Businesses. Crown Publishing. ISBN 978-0-307-88791-7. Rothaermel, Frank T. and Sugiyama, Stephen (2001): Virtual internet communities and commercial success: individual and community-level theory grounded in the atypical case of TimeZone.com. Journal of Management 27, pp. 297–312. Rysman, Marc (2007): An empirical analysis of payment card usage. The Journal of Industrial Economics, 55, pp. 1–36. Scott, Rodney J.; Cavana, Robert Y.; Cameron, Donald (2013): Evaluating immediate and longterm impacts of qualitative group model building workshops on participants' mental models. In: Syst. Dyn. Rev. 29 (4), pp. 216–236. DOI: 10.1002/sdr.1505. Shane, Scott (2009): Why encouraging more people to become entrepreneurs is bad public policy. Small Business Economics, 33 (2), pp. 141–149.
37
Senge, Peter (1990): The fifth discipline. Mastering the five practices of the learning organization. 1st ed. New York: Doubleday/Currency. Slywotzky, Adrian and Morrison, David (2001): Becoming a digital business: ‐ it’s not about technology, Strategy & Leadership, 29 (2), pp. 4 – 9. Sterman, John (2000): Business dynamics. Systems thinking and modeling for a complex world. Boston, MA: Irwin/McGraw-Hill. Sterman, John (2002): System Dynamics: System Thinking and Modelling for a Complex World. Working Paper. Massachusetts Institute of Technology, Cambridge, Mass. Engineering Systems Division. Oliva, Rogelio, Sterman, John D. and Giese, Martin (2003) Limits to Growth in the New Economy: Exploring the "Get Big Fast" Strategy in e-commerce. System Dynamics Review, 19, pp. 83– 117.
Sun, Mingchun; Tse, Edison (2007): When Does the Winner Take All in Two-Sided Markets? In: Review of Network Economics 6 (1), pp. 1–25. Täuscher, Karl; Abdelkafi, Nizar (2015): Business Model Robustness: A System Dynamics Approach. In: Proceedings of European Academy of Management (EURAM) Conference 2015, Volume XV, Warsaw (Poland), 17 - 20 June 2015. Täuscher, Karl and Chafac, Melvis (2016): Supporting Business Model Decisions: a Scenariobased Simulation Approach. In: Int. J. of Markets and Business Systems (forthcoming). Warren Kim, Strategic Management Dynamics, 2008, Wiley: New York.
38
Wouters, Marc, and Markus A. Kirchberger (2015): Customer value propositions as interorganizational management accounting to support customer collaboration. Industrial Marketing Management 46, pp. 54–67. York, Jonathan L.; Danes, Jeffrey E. (2014): Customer Development, Innovation, and DecisionMaking Biases in the Lean Startup. Journal of Small Business Strategy, 24 (2), pp. 21–39.
39