The Thalys. (9309) would have arrived at the junction point at Lage Zwaluwe well before the 42610. The two trains could then subsequently have continued on ...
TMS (Traffic Management System) On AIR – June 2011
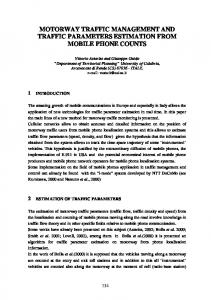
Overview What is TMS TMS is an autonomous system for the complete real-time management of railway traffic over a given network. The goal of the TMS is to execute a predefined plan as well as possible, given a certain optimization criterion. The TMS detects and solves future conflicts and generates a new conflict free plan by shifting timetable target times and exploiting alternative routes. The TMS also supports the implementation of this plan by giving advisory speeds (or time-location-speed slots) to train drivers and advices about routes, route setting times and order changes to dispatchers.
This short paper concentrates on the kernel modules of the TMS architecture, which are responsible for automatic local traffic optimisation and control. The TMS kernel has a hierarchical structure consisting of two layers, respectively named Conflict Detection & Resolution-1 (CRS1) and Speed Regulator (SR). Additionally the TMS has a graphical user interface, named CRS2, where the original plan, the new plan and actual plan execution is shown.
Application The TMS is highly suitable to support dispatchers, solving routine conflicts with a high level of automation (which can be adapted to the desires of a dispatcher), thus freeing the dispatcher of this work so that he/she can focus on tactical decisions and also preventing that small deviations become large ones by intervening at an early stage. Even problems with a limited number of trains on a limited network (e.g. 5 trains approaching ‘sHertogenbosch from different directions) have many solution possibilities and involve many relevant details, while there can be large differences in quality between various solutions. This quickly grows beyond human capabilities and response times. At the same time, computers are very good at this. On the other hand, humans are very good at a tactical level, requiring a broader overview and creativity, dealing with problems that as yet cannot easily be formulated in mathematical terms or are too complex to solve.
1
Dispatcher
What-if simulator
solution disability to achieve a target
interface to higher or adjacent management levels
Dynamic plan GUI
constraints
plan allowable routes constraints
Conflict Detection and Resolution
disability to achieve a target
targets routes
routes Interlocking
Speed Regulator interlocked routes
current speeds and positions or disability to achieve targets
current speed and position when train intelligent
Track side advisory speeds or targets when train intelligent
(Intelligent) Trains
Train side
translation of target to advisory speed when train intelligent
The Rail system is not unique, not in process, not in complexity, not in operator interfacing needs. Decision support and control systems have been implemented successfully for similar systems. Clearly, a step by step approach in implementation is advisable. Due to its modularity TMS is suitable for this. In simulation studies and a pilot implementation TMS already has shown its value, increasing punctuality, reducing energy consumption and reducing the number of non-commercial stops for freight trains.
TMS core Modules � CRS1 is responsible for automatic real-time train scheduling and routing. Given the current timetable, a set of constraints, the current traffic disturbances, and the position and speed of each train in the area, CRS1 detects and solves future conflicts and creates a new conflictfree plan by means of an alternative graph in which each node represents an event and each arc represents a time precedence relationship between two events. The scheduling algorithm minimises a suitable function of exit delays, acting both on train precedence relations at conflict points and on train routings. The new plan generated by CRS1 consists of time-location-speed goal windows and routes. It exploits allowable alternative routes, order changes and speed variations. CRS1 performs a global optimization. The optimization is over the whole voyage from entry to
2
location
exit of the network of all trains currently running in the network or expected to enter in the next 15 minutes. So all trains, the whole network and a sufficient part of the future are taken into account. This time horizon is adaptable. Also the optimization criterion itself is adaptable.
time-location-speed slots optimum speed profile
time � SR is responsible for the execution of the plans produced by CRS1. SR books routes and computes an optimal speed profile for each train, in order to make the CRS1 plan being executed in a safe and fuel-efficient manner. An advisory speed is sent to the trains whenever a change of speed is required, as result of estimations on the current plan goals and current state of running trains and infrastructure. If due to new disturbances SR detects that it no longer can comply with the goal windows, it informs CRS1 and asks for a new plan. Thanks to the modularity of TMS architecture, CRS1 can operate as stand-alone module, as well as linked to SR and other communication tools. As stand-alone tool, CRS1 generates optimal schedules, given different traffic scenarios. Connected to SR and external modules, CRS1 exploits its capability to react to traffic disruptions, building and re-building in real time optimised plans, managing the order of trains, or using alternative routes.
Main functions The main functions performed by TMS are: � Conflict detection and resolution � Complete schedule generation � Advisory speeds computation � Route booking
Theoretical foundations The TMS internal model is based on the alternative graph scheme, originally developed for job shop problems and successively extended and adapted for the rail traffic scheduling problems. In the graph model the nodes represent the passage of trains at a give set of network points, and arcs represent time relations between nodes. A detailed description of the graph model can be found in the paper “A Traffic Management System for Real-Time Traffic optimization in Railways”, Transportation Research Part B 41 (2), pp. 246-274 (2007).
How it can be used TMS is conceived to operate in a fully automatic way. The main current use of TMS is in combination with a train simulator, providing all train data and executing the suggested actions (advisory speed for trains, order changes, modified routings, route settings, …). However, there
3
are also several reduced operational modes, depending on the required level of automation. The simplest one is a DSS-mode, in which only the train scheduling function is active. The intended use of TMS is in a traffic control centre to support dispatchers and train drivers. A successful proof-of-concept pilot has been executed at the Lage Zwaluwe junction (see the examples at the end of this paper).
TMS input TMS manages both static and dynamic input data: � Static data o Network topology (blocks, switches, signals, slopes, speed restrictions,…) including the length of infra o Maximum speeds on the infra (speed boards, signal aspects) o Minimum speeds on infra (e.g. on crossings with roads) o Signal positions and signal aspects patterns o Rolling stock characteristics (length, maximum speed, acceleration & braking curves, …) o Train priorities (e.g. delays for an IC are weighted heavier than for a freight train) o Train routes (planned and alternatives) o Phased setting rules � Dynamic data o Initial infra and traffic status o Initial and current plan o Connections between trains o Train initialisations (including trains expected to enter in the near future) o Train positions and speeds o Route that are set o Setting rules (Dutch: Instelvoorschriften) o Current delays Static data are stored in a database, accessed by TMS either directly or by suitable translation software. Dynamic data are communicated to TMS by a message passing interface. Output data are managed by the same messaging scheme. Currently, the availability of train position data at a sufficiently high rate (e.g. each 10 seconds) is considered as mandatory for TMS full operation. In absence of train position information, TMS could operate also with only track occupation information, but this is still a research issue.
TMS output The final goal of TMS is to provide a smooth and efficient traffic regulation, through a continuous update of train speeds (by the communication of advisory speeds when required) and a progressive modification of the current train schedule in order to dynamically solve future conflicts and optimize the chosen cost function (e.g. the total expected delay). Optimization is the core activity of TMS and it is based on a set of heuristics allowing quick identification of the best set of train precedence rules. When it is needed, alternative routes are explored in order to achieve a better solution. Given routings and ordering of the trains, the running time/speed profiles are computed, and so the train schedule contains an estimate of passing time/speed of each train at every future control point on the network (goals). Control points are distributed in the model in such a way to avoid any possible ambiguity in train motion (block limits, switches, speed restriction boards and so on).
Operating cycle At each cycle, TMS evaluates if a conflict will occur in the future, and it modifies the current schedule in order to solve it in the best way. Conflicts may arise in different ways (delayed trains, mismatches between predicted and actual positions/speeds, other disturbances). Conflict resolution is performed hierarchically by the following single actions, or by a combination of them: � Adapting train speed
4
� Changing train precedence � Modifying train routing The best modified schedule is evaluated keeping in account all the possible railway constraints (e.g. blocking, connections, min/max speed, turning and many others). This is possible, as the railway constraints are modelled into the internal graph representation. The schedule is guaranteed to be feasible with respect to train dynamic characteristics, because acceleration/deceleration curves are explicitly used in travel time computations. Finally, the schedule is also compatible with the already booked routes. Booking policy is a key aspect of TMS, because it is strongly related to traffic smoothness. Booking is performed generally as late as possible, in order to improve resource allocation. However, it can also be anticipated in order to allow the so-called “green wave” traffic flow.
Cost functions The final goal is pursued at each level by optimizing cost functions whose selection can be tailored by the user needs. Currently we mainly focus on punctuality, averaged delay and energy consumption as major terms to be evaluated, but every other computable quantity can be used. Train speed optimal profiles are evaluated in order to maximize smoothness of the speed function itself, minimizing the number of speed changes.
Communication issues TMS is conceived as a centralised system, managing messages coming from the field and producing new messages in order to execute the required actions. In this way a key issue is the communication delay between a datum (e.g. a train position) and the implementation of a suggested action (e.g. new target speed). In order to cope with such a delay (T seconds), TMS operates always in forecasting mode, that means it always evaluates train position/speed in the near future after T seconds according to the current schedule. That is, when sending a new target speed TMS takes care that it is correct for the moment T seconds later when it is actually implemented. Doing so, delayed communication effects are circumvented and efficiency of the suggested actions is maintained.
TMS capabilities A short list of the most important TMS capabilities, available with the current TMS version, is: � Drive each train according to the railway constraints (e.g. speed restrictions, minimal headway). � Deal with different train types and priorities (from freight to IC). � Generate updated time/speed estimations of each train at a large set of control points in the future, allowing precise monitoring of the expected evolution of the current scenario. � Ensure smooth speed profiles avoiding unnecessary speed changes. � Forecast the future effect of each decision in order to select the best choice not for its immediate benefit, but for its global impact on delays. � Exploit alternative routes in order to find the most efficient solution to conflicts. � Ensure that every routing modification could be realized with proper and efficient information to dispatchers and customers. � Model every type of network element, either for double or single direction. � Model all types of railway constraints among different trains (connections, fixed order,…). � Tune the objective function giving different emphasis on punctuality, delay, or energy consumption. � Manage complex railway mechanisms like phased route setting and turning/coupling through of trains. � Consider trains as physical objects, with length, mass and dynamic characteristics, described by specific laws. � Deal with unavoidable communication delays, compensating them with short term forecasting.
5
Previous TMS versions showed the capabilities to address also the following issues. Through an adaptation process, they could be added to the current version too: � � � � �
Guarantee proper speed control on positive and negative slopes. Use coasting. Manage efficiently fixed block and moving block signalling, even in a mixed mode. Deal with infrastructure and train degradations. Cope with the presence of uncontrolled trains, not sending/receiving messages to/from TMS.
TMS possibilities TMS is able to generate a new consistent global plan in the face of disturbances. TMS can show this plan to the dispatchers, together with the original plan, so that dispatchers can see the differences and can quickly see the consequences of the TMS proposals. TMS can very well act as a decision support system, where even the level of automation can be decided upon (some routine task could be automated so that TMS measures are followed unless blocked by the dispatcher, while for other tasks TMS makes proposals and shows their consequences but these are not followed unless approved by the dispatcher). Although not implemented, TMS is by construction and applied optimization method suitable to support the following functions: � Present advices to dispatchers, who can accept or reject parts of the proposed solution and who can suggest or force their own measures. It can be shown if an advice involves a nonlocal order change (i.e. order change on open track) or the choice of an alternative route. Subsequently TMS takes these forced components of the desired solution into account as constraints in its optimization. � Present advices to dispatchers and show the value of the optimization criterion for different solutions (e.g. doing nothing, following TMS, dispatcher proposal). � Show a prediction of what will happen for a scenario. � Adapt the optimization criterion and time horizon over which this criterion is being evaluated. � Send time-location-speed goal windows to train drivers instead of advisory speeds. Software in the train could support the driver to calculate a speed profile. The train driver could notify the TMS if he no longer expects to be able to reach his current goal (expects to violate allocated slot). This is a more distributed system. Advantages are that more freedom and responsibility is given to the train drivers, and that train drivers and the support software implemented in the specific train can follow their own strategy and optimization criterion in reaching the given goal (punctuality, energy, throughput, interval). As a side effect the computational load decreases for the central system. Note that TMS currently works with: � Receiving train position and speed at a sufficiently high rate (down-link with trains). � Sending advisory speeds to trains when needed (up-link with trains). Considering the down-link, TMS could operate also with only section occupation information. This probably means less accurate data and hence reduce TMS performance. This is still a research issue. Considering the up-link, TMS can function without and only use route choice and timing to control the flow of traffic. Again, this will affect performance, trains may meet more yellow and red signals which affects punctuality, throughput and energy efficiency.
6
Examples of TMS results Below three examples of TMS applications will be given: � Green Wave pilot implementation for Lage Zwaluwe junction. � Schiphol simulation study. � ‘s-Hertogenbosch simulation study. The green wave 2004 The pilot “The Green Wave”, actually called “de Groene Golf” (dGG) was carried out in June 2004, and was a first attempt to test TMS in practice. The pilot area starts at Breda at signal 88 and at Roosendaal at signal 82 and ends at Willemsdorp at signal 615. The Breda and Roosendaal tracks are outside the scope of the pilot area. Dordrecht Dordrecht-Zuid 15 Km
Willemsdorp
Lage Zwaluwe Zevenbergen 23 Km
15 Km
Oudenbosch Breda Prinsenbeek
22 Km
Roosendaal
Breda
Tilburg
The bottleneck in the pilot area is the junction at Lage Zwaluwe. Trains that, due to delays, are required to stop at this bottleneck, generally see their delay becoming ever longer, as a result of the waiting time and the running time lost because of the slowing down and subsequent reacceleration of the train. The consequences are disadvantageous for all trains, but they are farreaching for heavy goods trains, whose time losses can amount to as much as 10 minutes. These unplanned stops can result in delays also for the following trains. For the pilot, the TMS communicated with a Tracking & Tracing system (T&T) and the Procesleiding system (VPT-PRL). The system architecture is sketched below.
7
The TMS received, on a regular basis, position and speed information from the running trains, equipped by mobile units. Combining the actions of CRS1 and SR, the TMS issues 3 types of recommendations, namely speed recommendations, order recommendations and route recommendations. Network controllers and train traffic controllers are the addressee of order and route recommendations. The speed recommendations are intended for the driver. By following the speed recommendations, the driver can ensure that his train is not forced to stop at a red signal. If network controllers and train traffic controllers comply with the order and route recommendations, the result is an optimum flow across the entire control area. In this way, the delay effects for other trains are minimised. The main “quantities” of the pilot are: 11 • Test days: 8 • Pilot days: 993 • Train runs: 766 • Passenger trains: 211 • Freight trains: • Special pilot trains: 16 89 • Train-attendants: 50 • Mobile units: TMS must work in real-time, so its recommendations have to be produced as fast as possible. This can be a key aspect for order and routing recommendations, involving a new plan generation by CRS1. However, with TMS core modules (CRS1+SR) installed on a dedicated PC, TMS was able to produce a new a plan in a few seconds, allowing timely reaction to perturbations. Results of the pilot The effects of the TMS were demonstrated using a number of cases occurring during the pilot and analyzing the precise course of events. In some cases, it was verified that major problems caused by trains running a few minutes late, would in fact have been prevented by taking up the TMS plan and speed advices. An example from the analysed cases is reported in the following. Starting situation This example dates from 29/06/2004 at around 09:45 hours, and describes a case where the TMS came up with a solution for eradicating the delay, for a number of trains.
8
Train
Type
9309 42610 5128 2528
Thalys Freight Stop train Intercity
From
Planned Time Roosendaal 09:34:34 Breda 09:38:08 Roosendaal 09:39:30 Breda 09:47:29
Entry Entry Delay +5 min. +1 min. +4 min. On time (+10 min.)
In this practical example, in particular the 9309 and the 5128 from Roosendaal suffered some delay. In this example, an indication is provided of what recommendation was issued by the TMS and what happened when a train ignored the recommendation. By way of comparison, it also is indicated what would have happened if the train in question had taken up the recommendation. The TMS recommendation If the trains had travelled according to the plan, nothing would have gone wrong. The Thalys (9309) would have arrived at the junction point at Lage Zwaluwe well before the 42610. The two trains could then subsequently have continued on their way, unhindered. Due to the delay of the 9309 (5 minutes), the situation turned out to be very different. TMS detected that a conflict was due to occur at around 9:52 at the junction point at Lage Zwaluwe, and calculated the best means of avoiding the conflict. In this solution, TMS also included the subsequent trains (5128 and 2528) and TMS attempted to maintain the original order, in other words first the 9309 and then the 42610. In this schedule, the 42610 should have been slightly delayed by reducing the recommended speed to prevent the train having to stop at a red signal. At the same time, the 9309 should have been slightly accelerated to maximum section speed, in order to in part make up the area entry delay and at the same time to delay the 42610 as little as possible. Result of not taking up the recommendation In practice, no agreement had yet been made with the drivers to take up the TMS recommendations. Actually, the 9309 did take up the recommendation, but the 42610 ignored it. The 42610 travelled at a speed of 65 km/hour rather than the recommended 40 km/hour. As a consequence, the 42610 was forced to stop at the red signal at the junction point at Lage Zwaluwe. The figure below shows that the Thalys was granted its route across Lage Zwaluwe (red line) whilst the 42610 had to wait for a red signal. The other two trains (2528 and 5128) are also visible in this picture.
9
The table below shows the consequences of ignoring the recommendation. Failing to take up the speed recommendation by the 42610 resulted in a total delay of 14 minutes. Train 9309 42610 5128 2528
Type Thalys Freight Stop train Intercity
Entry Delay +5 min. +1 min. +4 min. On time (+10 min.)
Exit Delay +4 min. +7 min. +6 min. +7 min. (+24 min.)
Extra Delay -1 min. +6 min. +2 min. +7 min. (+14 min.)
Result if TMS recommendation had been taken up From the analysis of TMS calculation, it emerged that the above-described additional delay would not have occurred if the 42610 had taken up the recommendation. If we assume that the Thalys in that case had also stuck to the recommendations, the 42610 would have reached the junction point several minutes later, at the recommended speed of approximately 40 km/h. As a result of which the train would not have been forced to halt for a red signal, but would have been able to pass through a green signal. Train 9309 42610 5128 2528
Type Thalys Freight Stop train Intercity
Entry Delay +5 min. +1 min. +4 min. On time (+10 min.)
Exit Delay +4 min. +2 min. +2 min. +1 min. (+9 min.)
Extra Delay -1 min. +1 min. -2 min. +1 min. (-1 min.)
Differences On balance, taking up the speed recommendation represents a gain of 15 delay minutes. In terms of punctuality, whereby a train is only in fact delayed if the delay is greater than 3 minutes, this means an output punctuality of 75% as opposed to an initial punctuality of 50%. Because in the practical situation the recommendation was not taken up, all four trains were delayed, resulting in an output punctuality of 0%. Conclusion This example shows the strength of the TMS for improving punctuality (and the secondary objective: saving fuel by avoiding a stop) by preventing conflicts and guiding trains on the basis of recommended speeds. The example also shows that an apparently simple problem, namely a Thalys running a few minutes late, can grow into a considerable disruption with major delays for other trains. A global estimation, based on the analysis of a number of practical situations occurring during pilot days and on feedbacks from the involved personnel, was carried out. These figures and the other experiences acquired during the trial indicate that the TMS does have sufficient capacity to become a positive addition to the existing systems. The pilot demonstrated that on a weekday, gains of approximately 210 train delay minutes could be achieved for the entire pilot area, when equipped to cover all trains. On an annual basis, the gain for the pilot could be of 1100 delay hours. The pilot has also demonstrated that the forecast energy saving of 10% is easily achieved.
10
The Schiphol bottleneck 2007 A study was carried out to verify if the use of a TMS could be effective to manage the forecasted increased traffic at Schiphol bottleneck in 2007. The study addressed the problem of efficiently using the capacity of the existing railway network and improving reliability and punctuality of train operations. The study verified the effectiveness of the TMS global approach by means of simulations on different traffic scenarios. The research area comprises all tracks between Nieuw Vennep on the east side, Amsterdam Lelylaan on the north side and Amsterdam Zuid WTC on the south side. At the Hoofddorp location a number of storage sidings operate as origin or destination for trains.
N AmsterdamLelylaan
AmsterdamZuid WTC Schiphol
Schipholtunnel Hoofddorp
Nieuw Vennep
Model Boundary
The next figure gives an overview of the infrastructure, including the 4-track bottleneck at Schiphol, where in each direction 27 trains will run. This involves trains in/from two directions northbound (Amsterdam Zuid WTC and Amsterdam Lelylaan) via three platform tracks and three directions southbound (HSL, Leiden, shunting yard) via three platform tracks.
The next figure shows the standard routes per line at Schiphol. For each direction, 9 possible routes have been considered in schedule optimisation.
11
S
N
S
N
In the figure, “SCH” identifies the Schiphol station, concerning possible routes and platform tracks (Northbound direction). A set of points P1…P5 identifies the Schiphol area limits. The train characteristics considered in the model are summarised in the following table. Rolling stock Length (m) TGV-P 10 200 ICE22 8 200 ICM3 6 161 IRM3 9 242 IRM4 8 214 E17D2 Dd 8 245 E17D2 Dd 6 193
Weight (ton) 417 465 287 431 394 550 459
Max speed (km/h) 220 220 160 160 160 140 140
12
The study considered different values for the number of trains per hour (19, 23, 27, 29, 32), starting from reference timetables. Two different kinds of perturbations were added to each timetable: - entry delays for approaching trains (randomly sampled from a “Pearson T5” distribution) - stop extensions at Schiphol and Hoofddorp (randomly sampled from a normal distribution) According to the above context (timetable + perturbations), a large set of different realisations was generated, each one considering 8 hours of traffic. Every 10 min, CRS1 generated a new optimal conflict-free schedule for all the trains inside the controlled area, by acting on both precedence relations and track changes (allowed only in the Schiphol station). Results of the Schiphol study The overall result from the study is that it is possible to manage the requested 27 trains per hour timetable through the Schiphol bottleneck, so the existing infrastructure is adequate for the objective. The result came from a relevant number of simulation hours, leading to about 2600 averaged trains for each one of the 5 analysed timetables. The study showed the benefits that can be expected. The most important are: - travel times are lower and reliability is higher. 27 trains per hour Direction Northbound Southbound -
Average Throughput Time [min.] Reference CRS1 17,8 14,4 17,5 15,0
severe disturbances can be handled easier, or bad consequences can be weakened. the energy consumption is lower. there is a better overall control of the traffic.
Below, the most important results of this study are reported by synthesis graphs. - Average Throughput (number of trans per hour) - Percentile Travel Time (87th percentile of the travel time distribution) - Exit delay - Punctuality (many trains have an exit delay less than 3 minutes) 87th Percentile Throughput
24,0 23,0 22,0 21,0 20,0 19,0 18,0 17,0 16,0 15,0 14,0 13,0 12,0 11,0 10,0
Travel Time (min)
Travel Time (min)
Average Throughput
19
23
27
29
32
Number of trains per hour
32,0 30,0 28,0 26,0 24,0 22,0 20,0 18,0 16,0 14,0 12,0 19
23
27
29
32
Number of trains per hour
Exit Delay (min)
Average Exit Delay 24,0 22,0 20,0 18,0 16,0 14,0 12,0 10,0 8,0 6,0 4,0 2,0 0,0
Average
19
23
27
29
32
Number of trains per hour
13
The graphs show that 27 trains per hour can be managed with reasonable performance degradations in all the computed parameters. However, a further increase in train density is not sustainable. This is due to the Schiphol station bottleneck where the 3 existing platforms and the approaching tracks are not sufficient to handle the traffic (with perturbations) at more than 30 trains per hour. ‘s-Hertogenbosch 2009 A simulation study has been executed for an area of reasonable size and complexity, where an actual control challenge currently exists. TMS results have been compared statistically to a number of other strategies (FCFS, VaVo: FCFS with maintaining timetable order for trains having the same end-track in a route). The study area is delimited by and including Tilburg and Boxtel on one end and by and including Geldermalsen and Oss on the other end. Gdm a
Gdm The main conflict area’s are at Vught Aansluiting (Vga) and at Diezebrug Aansluiting (Htda) and also in ‘s-Hertogenbosch (Ht) itself. Additionally, headway conflicts frequently occur on the open tracks (e.g. between intercities and stopping trains or freight trains).
Mbtw an B rm e t
M btw az
Zb m Ozbm Ow
O
H dl Mb h H tda
Rs H to
Tb
Gdm
Ht Vga Vg
i b T
b T
a b T
Ht
Btl
O
B tl t O
The timetable contains 28 trains per hour. 2 Intercities per hour per direction 2 Stopping trains per hour per direction
Geldermalsen
coupling through 1 Freight train per hour per direction
Oss
Total: 28 trains per hour
‘s-Hertogenbosch Tilburg
Boxtel
Entry delays in the simulation are generated from distributions based on measured data (peak hours 2007).
14
Simulation results have been gathered over 48 hours (12 runs of 6 hours where the first 2 hours are discarded as warm-up time). Punctuality at exit and bandwidths at exit are depicted below. It can be seen that TMS performs better than FCFS and VaVo. In turn VaVo outperforms FCFS, which is not surprising since disturbances are not large. Comparing TMS with VaVo on punctuality, TMS has significantly more trains with delays less than 1 minute or 3 minutes. Also, looking at the percentiles and standard deviations, TMS achieves more compact intervals containing most trains (smaller deviations from planned timetable paths).
Punctuality at exit 100,0%
95,0% VaVo 90,0%
FCFS TMS
85,0%
Entry
80,0% 1 min
3 min
5 min
7 min
Bandwidth at exit 300
VaVo
FCFS
TMS
200
[sec]
100 0
Delay avr±std avr
-100 -200
Percentiles 10% - 90%
-300 -400
15