oped an agent-based weed dispersal model in NetLogo with in-built economic evaluation and management strategies components. We modelled the spread.
To weed or not to weed? The application of an agent-based model to determine the costs and benefits of different management strategies J. Steel A, J. WeissA and T. MorfeB Department of Environment and Primary Industries Victoria, AgriBio, Centre for AgriBiosciences, 5 Ring Road, La Trobe University, Bundoora, Victoria 3083, Australia. B Department of Environment and Primary Industries Victoria, Ballarto Road, Frankston, Victoria 3199, Australia. A
Summary
Introduction
Whilst non-spatial economic models can calculate the costs and benefits of different weed management strategies, they have to assume a uniform rate of weed spread, that is either under management or spreading without control. They do not take into consideration the heterogeneous nature of the landscape and the resultant differences in costs and benefits at specific locations. Program managers often report on the effectiveness of control programs in terms of the number of inspections and/or extent of area treated, but rarely is there the ability to: • calculate the benefit-cost ratio of programs (the productive value of the area protected over time); • optimise the strategy by balancing costs with future benefits; or • allow for adaptive management scenarios.
One of the major issues of coordinated weed management across large and diverse landscapes is determining what the best strategy is given a limited or constrained budget. Trying to determine the best strategy by comparing the benefits and costs of the different options requires the involvement of a variety of participants (landholders, program managers, extension staff, community representatives, researchers, and evaluation and policy advisors). The use of mathematical models to optimise landscape-scale weed spread management has led to the development of a range of general recommendations regarding the likely success of a management strategy under modelled “normal” or “usual” conditions (e.g. Moody and Mack 1988, Odom et al. 2003) or under particular conditions (Moore et al. 2011). Spatially-explicit modelling has been used to similar effect across theoretical landscapes (e.g. Coutts et al. 2011, Caplat et al. 2014) and also deployed to test the effectiveness of such strategies across real-life landscapes (Higgins et al. 2000, Büyüktahtakın et al. 2011, Giljohann et al. 2011, Januchowski-Hartley et al. 2011, Frid et al. 2013). To date these models have been applied to public land where the responsibility for weed control works sat directly with the land manager. The modellers could assume that there would be a prescribed response to the weed management strategies they investigated. Epanchin-Niell and Wilen (2014) recognised that the patchy nature of weed control across landscapes composed of a mosaic of land managers influences the level of control of a weed species. They modelled the social context of coordinated control and found that cooperation was important. The model in this paper extends this idea by recognising that government-led programs can facilitate this cooperation, but only up to a point. The model bridges the public/ private divide as it is designed to assess a range of management strategies for
To address these issues we developed an agent-based weed dispersal model in NetLogo with in-built economic evaluation and management strategies components. We modelled the spread of serrated tussock (Nassella trichotoma (Nees) Hack. ex Arechav.) under three management scenarios to compare their costs and benefits: a (hypothetical) baseline scenario where only self-motivated landholders treat infestations as there is no enforced control of the species; the current strategy of uniform intervention where the government intervenes on every property that is known to have (or have had) an infestation; and a proposed new containment line strategy where a buffer zone around the known infestations prescribes the properties that will be subject to government intervention. The insights provided by the modelling suggest that in the study area improved targeting of enforcement via a containment line could produce an outcome at least as good as the current approach, but without the need for larger government expenditure every year as the weed spreads to more properties.
serrated tussock (Nassella trichotoma (Nees) Hack. ex Arechav.), a weed that affects both agricultural productivity and biodiversity. In this context, program managers overseeing the implementation of a regional weed management strategy cannot assume that the strategy will be translated directly into action. Landholders will enact the strategy with varying degrees of compliance. The response of landholders to a plan’s directives can range from pre-compliance, whereby the landholder controls the weed without requiring government intervention; compliance, whereby the landholder controls the weed to a standard deemed satisfactory at inspection time; and non-compliance where no control works for the weed are performed satisfactorily by inspection time. Landscape scale weed management success depends on how well each landholder manages the weed, how many of them do and where their properties are located. For this reason, unlike the bioeconomic model developed by Higgins et al. (2000) the management unit in our model is determined by property boundaries (albeit coarsely rendered by 200 x 200 m cell size) rather than by individual grids. Our model covers a landscape that is composed of private properties as well as public land (native vegetation). Agent- (or Individual-) Based Models were developed to allow modellers to simulate the behaviour of entities that are influenced by their environment (Railsback and Grimm 2011). They have been used to model the management of invasive species (e.g. Higgins et al. 2000, Buckley et al. 2003, Shae et al. 2006, Rebaudo and Dangles 2013). The modelling software we chose to use has been used by others to model weed management (Iannone et al. 2014), but to our knowledge this is the first landscape scale bioeconomic model to investigate management strategies as applied across a realistic landscape that explicitly models the social context. NetLogo (v. 5.0.4, Wilensky 1999) was chosen as a suitable platform for modelling within this social context for two main reasons: 1. the interactive user interface allows the modellers to work with program managers to capture their understanding of the compliance environment and to test the spread that is simulated by particular parameter values to iteratively develop a model that fits to past spread patterns; and 2. the model is capable of interpreting geographic data on the layout of property boundaries to allocate an agent (or landowner) to the set of grid cells within each property boundary. The action of each landowner to managing
Plant Protection Quarterly Vol.29(3) 2014 101
the infestation on their property could then be different, according to management zones specified by the management strategy, with landowners exhibiting varying degrees of compliance. At a local spatial scale (i.e. a farm level) there is clearly good reason for landholders to control their own weeds to mitigate negative economic and environmental effects. For many weed species the impacts can immediately be observed by the landholder and this promotes self-motivation to manage the weed. This is particularly true for weeds of broad-acre cropping where the competition between species is usually evident. For some weed species, however, the benefits of control are not apparent until the weed has reached a density or level of infestation that causes obvious impacts. For example, pasture weeds may be tolerated at a low level but at some point they reach a threshold that prompts a landholder response. Unfortunately,
Life stages
Landscape suitability
by this stage, a weed such as serrated tussock is likely to have reached reproductive age and/or to have spread to other properties over a number of years. Under this circumstance, there is a role for government investment where there is a general public good in inhibiting further spread by ensuring landholders prevent the dispersal of the weed. Such actions from government incur a cost and in this case the cost equates with the number of times departmental Compliance Officers visit landholders to encourage or enforce control of the weed. There is a requirement for the government to quantify the benefits of serrated tussock containment. At present program managers commonly report the area or number of infestations that were detected each year and what proportion were treated. Whilst this is a measure of achievement, it falls short of evaluating the benefits of the program in two important ways. Firstly, the number of treated infestations does not directly indicate how effective the program is at reducing
the weed’s spread. There is an assumption that the more infestations that are treated, the slower the spread, but research suggests that it is more important to treat infestations in particular locations (first postulated by Moody and Mack (1988) and discussed by EpanchinNiell and Hastings (2010)) that are a major source of spread than to maximize the number of infestations that are treated. Secondly, if the species continues to spread, this can give the impression that the program is not effective. However, if the aim is to limit or slow the spread of the species then this is an unfair assessment. A more appropriate assessment would be to estimate the extent the weed could have spread without the program and compare to this the area that was still infested at the time of reporting. This approach has the added benefit of facilitating a comparison between the economic loss of productivity that could have occurred both with and without the containment program. This avoided loss allows us to calculate the benefit of the
Values in the literature
Processes
[values in the model]
Seed bank
1755–42 930 m-2 (Gardener and Sindel 1998) [seedbank reduces by 10% per year]
Germinate
Seedlings
4000–5000 seedlings m-2 (Campbell 1998)
[95–99% seeds die at landing to simulate mass seed germination and death]
Grow
Adult
Apply management
5–20 adults m-2 in dense patches (Campbell 1998) [40 represents a patch with adults of various ages]
Flower
Seed dispersal
Produce seeds
93 000–340 000 m-2 (Gardener and Sindel 1998) [120 000]
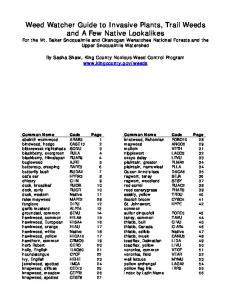
Return to Adult Figure 1. The lifecycle module. Individuals within a cell progress through each of the illustrated life stages (in rectangles) by undergoing each relevant process (in ellipses). The number of individuals at each life stage that can occupy each cell is limited to within published values for this species. The specific values used in the model were chosen because they best simulated observed population dynamics over the operation of the model.
102 Plant Protection Quarterly Vol.29(3) 2014
program and compare this to the direct cost of control to landholders and indirect cost of administering that control (the government investment). Benefitcost analysis can be used to compare the efficiency of different weed management strategies for a species, such as containment focused either on older core infestations or newer satellite infestations. Non-spatial economic models can calculate the costs and benefits of different weed management strategies (for example, as applied to serrated tussock, see Denne 1988, Jones and Vere 1998, Jones et al. 2000). However, these models assume a uniform rate of weed spread for a given scenario and do not take into consideration the heterogeneous nature of the landscape that affects spread rates (Bergelson et al. 1993). This heterogeneity results in different costs and benefits at specific spatial and temporal scales. Computerised weed spread models combined with economic analysis can be used to integrate the interactions between weeds and their environments. Their outputs can be verified against field data to determine how well the modelled spread corresponds to the observed historic spread. Importantly these models can also be used to spatially illustrate (i.e. on a map) the different results that each strategy is predicted to have. They show the user how far and where the weed is likely to spread without the control program and compare predictions of spread under different types of control strategies, each with its own measure of cost.
In this paper, we developed a weed dispersal model in NetLogo with in-built economic evaluation and management strategies components. The model was calibrated to past years data from a real infestation in Gippsland, Victoria, including information on landholders’ response to enforcement. The final model outputs agreed closely with the actual observed spread of serrated tussock across the study area. The model was therefore able to be used to realistically test the different serrated tussock future management scenarios with a high degree of confidence.
Methods Model Structure The model consists of a number of modules that interact to simulate the spread of serrated tussock across a reallife landscape under different management strategies, including the: a) Serrated tussock life cycle module which grows each plant from seed to adult producing its own seeds; b) Wind spread module that disperses a proportion of these seeds across the landscape; c) Landscape suitability module that allows a certain number of seeds to germinate and progress through the life cycle, depending on the type of vegetation that is recorded at each location that receives the dispersed seeds, and how suitable it is for the establishment and growth of serrated tussock; and
d) W eed management module that determines where in the landscape control works are focused, what proportion of landholders control serrated tussock on their land and how effective the control is. The model operates across a realistic landscape that is divided into 200 x 200 m cells. Each cell contains information that relates to each of the modules described above. The landscape suitability of a cell is extracted from rasterized GIS files that can be read into the model. Similarly weed management is linked to land tenure, so cells that are located within a private property boundary are linked together by a property number embedded in another GIS file. The model generates a single land manager for each property so that weed management is uniform across all the cells that belong to the same property. The model also keeps track of the demographics of each cell, so for any point in time (month) that the model is running, each cell contains a number of plants and/or seeds (or is not infested) at a certain stage of the life cycle a), has a probability of seeds arriving from another cell via wind dispersal b), comprises a land use that may or may not be suitable for serrated tussock c), and is managed (or not) according to the settings in the management module d). The stages of the life cycle module and where these interact with the landscape suitability, wind spread and weed management modules are shown (Figure 1.). Published literature and expert opinion give a range of values for the maximum number of individuals at each stage of the
Table 1. Model parameters for serrated tussock associated with susceptible land uses within the study area. Name of land use (susceptible to serrated tussock invasion and present in the study area)
% germination
% invadable
Management - effects and associated costs
Broad-acre cropping
5
5
Annual broad-acre spray that kills all seedlings is common agricultural practice. No added cost to landowner or government.
Horticulture perennial
5
20
Pasture-dryland
6
100
Variable percentage of land managers control serrated tussock due to voluntary compliance and enforced compliance. Cost to landholder of labour and chemical. Cost to government of enforcement.
Pasture-irrigated
1
100
Urban
10
15
Native vegetation
0-6
0–100
Percentage of infestations that are treated is variable and can be from 0 to 100%. All cost to government.
Periurban
0–10
0–100
Infestations are not treated. No cost to government.
Roadsides
*1–6
*10–100
Assume that mowing occurs without government intervention, preventing long distance dispersal from these infestations.
Infestations are treated according to associated land use.
*% germination and invadable area were scaled to the underlying land use for these areas. The presence of a roadside in an otherwise unsuitable native vegetation land use allowed some germination (1 %) and invadable area (10 %) to be associated with the cell to simulate roadside spread.
Plant Protection Quarterly Vol.29(3) 2014 103
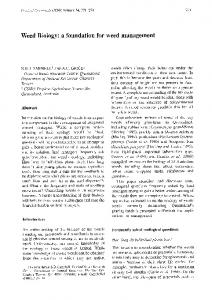
Williams et al. (2008) developed the equation below to model the likelihood of seed arrival from a known weed infestation population as: δ ç Pr (seed arriving)= 1-e-( /x)
Likelihood of reaching distance
with definition of parameters within the equation as: Pr (seed arriving) is the probability of a seed dispersing from a source population/plant at a specified distance;
x is the average distance dispersed by each seed/propagule; δ is the distance from the source population plant; and
ç is a derived constant based upon the dispersal kernel of the species.
0
Dispersal distance (km)
Figure 2. Nine dispersal kernel scenarios based on varying x and ç to model the likelihood of seed arrival from a known weed infestation population.
N 8%
NW 16%
NE 11%
W 22%
E 20%
SW 7%
SE 12%
S 4%
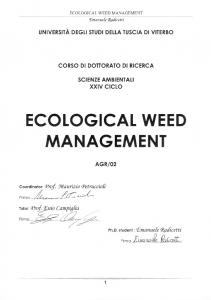
Figure 3. Proportion of seeds dispersed in each of eight cardinal directions according to the average wind direction during seeding of serrated tussock. life cycle that would be expected to occur within a unit area of an infestation. These figures were used to set up the life cycle module as annotated (Figure 1). However, serrated tussock does not survive well in shade (Healy 1945) so the landscape
suitability module adjusts the maximum values in the lifecycle module so that the percentage of seeds germinating and the area that can be invaded are linked to the type of vegetation that was recorded in each cell (see Table 1). The more canopy
104 Plant Protection Quarterly Vol.29(3) 2014
gaps in a vegetation type, the higher the proportion of serrated tussock plants that can germinate and survive in each cell. For example, in irrigated pasture, there would be very few canopy gaps at any particular time so only 1% of the maximum number of seeds that can germinate will do so each year the model runs (Table 1). However, over time, 100% of the pasture could be occupied by serrated tussock. In perennial horticulture, by contrast, the model allows 5% of the available seedbank to germinate, but due to the permanent canopy cover of fruit trees the maximum area of the cell that could be infested with serrated tussock is only 20%. Major roads were located in the study area and cells which were otherwise considered unsuitable for serrated tussock establishment, but that contained major roads were considered corridors for weed spread. This was modelled by increasing the germination and invadability of these cells from 0 to 1%, and from 0 to 10% respectively (Table 1). The wind dispersal module determines how many seeds are dispersed and how far they travel (Figure 2) in each of eight cardinal directions (Figure 3). The resolution of the dispersal kernel equation (Figure 2) predicts that 99% of
Figure 4. The location of the containment line (cross-hatching) within the study area of Gippsland, Victoria. The properties with records of serrated tussock infestations are shown in grey. The study area is illustrated on the inset map of Victoria. the seed produced by a plant will remain within 200 m of the parent plant (or inside the original cell). This is consistent with expert opinion that although half the seeds are dispersed, most land close to or only a short distance away from the parent plant (i.e. do not leave the cell at all). Maximum long distance dispersal is recorded as more than 8 km (Taylor 1987, in Campbell 1998); and up to 10 km (Campbell 1982, in Gardener and Sindel 1998), although 20 km is sometimes quoted. The model runs with either 10 km or 20 km as maximum dispersal distance, with 20 km chosen for this study because the calibration process identified this as the optimal value for maximum distance in this location. Wind direction was incorporated into the model following the method described by Williams et al. (2008) where the proportion of wind blowing in each direction during seeding time (December-March) was calculated from Bureau of Meteorology data. In discussion with Dr David McLaren, it was suggested that the majority of seeds (i.e. >50%) would be released in December, with about 5% left by March, and so the average wind direction across each
month was scaled to the proportion of seed that is usually dispersed at that time (illustrated in Figure 3). We assume that prevailing wind patterns will not change substantially over time. It was not possible to project the effect of climate change on this factor. The management module can be operated via the user interface to test the effect of different management strategies by altering the proportion or number of landholders that control serrated tussock on their property each year, where in the landscape that control is focused, and how effective their control efforts are. Since 2006, serrated tussock has been managed as a statewide target for containment (P. Major personal communication). Under this strategy, the infestations in Port Phillip and Corangamite Catchment Management Authorities were designated core infestations. A containment line was established on the periphery of this core and infestations outside this line were considered satellite infestations. A uniform intervention strategy identified them all as targets for eradication. The infestations in the study area are among those satellite infestations.
A new containment line strategy was proposed that defined a containment line for the infestations in the Gippsland region in Victoria. With natural barriers to dispersal on the north, east and south sides, a containment line was established on the western edge of the infestations (Figure 4) with an occupied zone to the east of that line, and the area to the west of the line was designated free of infestations or unoccupied.. Under the containment line strategy, compliance activity moves from the region’s core infestations to the properties in the buffer zone. We assumed that, as the core infestations have been subject to compliance, the control rate in this occupied zone would lie between the current level of compliance (43%) and the level of self-motivated control (10%), so 25% was chosen. Properties within the containment line are required to have a high level of compliance which aims to slow the spread of the weed across the study area. Compliance in this zone was set at 95% which is the level that is expected if all properties in the zone (both known to be infested and presumed uninfested) are inspected every year. The unoccupied zone is presumed to be free
Plant Protection Quarterly Vol.29(3) 2014 105
a)
b)
c)
Legend:
0 - 20 %
20 - 40%
40 - 60%
Containment line
Figure 5. Average density of spread from ten model runs under each strategy, over 20 years in Gippsland, Victoria, under a: a) baseline strategy (no government investment); b) containment line strategy (possible future strategy); and c) uniform intervention strategy (the current strategy). Note that in b) there is much less spread into the south-west of the study area than in a) or c).
106 Plant Protection Quarterly Vol.29(3) 2014
Uniform intervention
180000
Containment line
Baseline
160000 Hectares infested
140000 120000 100000 80000 60000 40000 20000 0
0
2
4
6
8
10 Years
12
14
16
18
20
Figure 6. Comparison of the spread of serrated tussock in Gippsland, Victoria, within dryland pasture under the three modelled management scenarios. Uniform intervention
45000
Containment line
Baseline
40000 Hectares infested
35000 30000 25000 20000 15000 10000 5000 0
0
2
4
6
8
10 Years
12
14
16
18
20
Figure 7. Comparison of the spread of serrated tussock in Gippsland, Victoria, within irrigated pasture under the three modelled management scenarios. Uniform intervention
35000
Containment line
Baseline
30000 Hectares infested
of infestations at the commencement of the containment strategy. Containment failure is conceptualised in Panetta (2012) whereby the core is surrounded by a barrier zone from which dispersal is prevented (if containment is successful). Failure to contain a species can occur if propagules are dispersed beyond the barrier zone (from the core or from satellite infestations within the barrier zone). This may be due to dispersal distances being too large to effectively form a barrier against, or because incomplete control within the barrier zone allows some seeding and dispersal to occur. If seeds dispersed beyond the barrier zone are able to establish and reproduce then containment has failed. Our model predicts that this will almost certainly occur due to two factors: the cost of compliance vs maximum dispersal distance; and incomplete compliance. With the cost of attempting to enforce compliance at $1000 per property and a barrier zone that is 10 km wide, it does not need to be very long before a budget becomes exhausted. And with effectiveness of control at 70% within infestations treated, dispersal from satellite infestations is bound to occur even if every property within the barrier zone attempts control. Even when compliance is assumed to be 95%, complete containment does not appear to be possible with this strategy. Thus, the realistic aim becomes to reduce the speed of spread and to allow higher productivity to be maintained in comparison to that which would be seen under no government investment. This is known as partial containment. The purpose of this study was to compare the economic benefits and costs of two different (partial) containment strategies to determine which was ‘better value’. The economic impacts of serrated tussock include the contamination of sheep fleeces, reduction in pasture production, damage to mouths of livestock, control costs, reduced market supplies leading to higher prices and welfare losses (see Lane and Edgar 1978, Vere et al. 1993). We assumed that the impact of serrated tussock on both production and environmental values is related to the location, size and density of the infestations. The model outputs a yearly tally of the number of hectares infested along a density gradient per land use. We assume a linear relationship between the density of serrated tussock and the loss of productivity. Infested cells with a density of serrated tussock between 0 and 20% lose 10% of their productivity, those with a density between 20 and 40% lose 30% productivity, and those with a density of between 40 and 60% lose 50%
25000 20000 15000 10000 5000 0
0
2
4
6
8
10 Years
12
14
16
18
20
Figure 8. Comparison of the spread of serrated tussock within public land (native vegetation) in Gippsland, Victoria, under the three modelled management scenarios. Plant Protection Quarterly Vol.29(3) 2014 107
Uniform intervention
250000
Containment line
investment was maintained within the current budget.
Baseline
land by a low level (10%) of self-motivated land-holders;
The results compare the spread of serrated tussock under the baseline scenario (no government intervention) with that under the uniform intervention strategy and the containment line strategy. Under the baseline scenario, 10% of private land managers are assumed to control serrated tussock due to self-motivation. Under uniform intervention, this figure is 43% which was found to produce the most realistic spread pattern under the current containment strategy in the calibration process. On public land, 51% of the infestations were controlled. Serrated tussock was not controlled on peri-urban properties. Control on roadsides depends on the land use attributed to cells that the road occupies. All control efforts were assumed to be 70% effective, meaning that 70% of the adult plants were killed in each treatment. The model was run ten times for each management scenario to capture the variation in outputs generated by the stochastic nature of the model.
2. uniform intervention strategy (current practice);
Results and Discussion
Hectares infested
200000 150000 100000 50000 0
0
2
4
6
8
10 Years
12
14
16
18
20
Figure 9. Comparison of the average spread of serrated tussock across the study area under the three modelled scenarios across all land uses. The benefit of each of the containment scenarios was compared to a baseline (no government intervention). productivity. The productivity of irrigated pasture is assumed to have a ‘high’ gross margin (based on ‘Beef Cattle Farming’ and ‘Wool sheep’ and ‘Prime lambs’ five-year average gross margin data to 2007-08 (Victoria Department of Primary Industries 2011) of $300 hectare -1, and dryland pasture a ‘medium’ gross margin of $200 hectare -1. We modelled the spread of serrated tussock across the Gippsland region under three management scenarios to compare their costs and benefits of a: 1. baseline strategy (no government investment); This is a hypothetical unregulated scenario where no enforcement takes place. Treatments occur on productive
Compliance operates on every property that is known to have (or have had) an infestation. As serrated tussock spreads and more properties become infested the cost of this intervention increases each year; and 3. containment line strategy; A new strategy was examined using the model to determine the best location for a containment line and also what level of compliance would be necessary to slow the spread of the weed across the study area. For this strategy government
The model produces both visual and quantitative outputs to illustrate and measure the outcomes of the management strategies that were simulated. The maps are part of the user interface and the modelled spread can be observed as the mapped infestations are updated every year. The final map (after 20 years) averaged across ten runs for each modelled scenario is presented (Figure 5). Without government investment, serrated tussock is projected to spread across a larger area and at higher densities than either the containment line or uniform intervention strategies (Figure 5). The containment
Table 2. Estimated present value of benefit (PVB), present value of cost (PVC), net present value (NPV) and benefit-cost ratio (BCR) based on average values across 10 model runs for each strategy . Baseline
Uniform containment
Containment line
Comments
(AU$ million) Control costs Productivity loss Present Value of Benefit (PVB)
Present Value of Cost (PVC)
Net Present Value (NPV)
Benefit Cost Ratio (BCR)
3.69 (M 0)
72.72 (L 0)
7.24 (M1)
25.44 (L1)
14.65 (M 2)
Sum of modelled outputs per land use
-
43.72
32.02
= (M 0 - M1 (or 2)) + (L 0 - L1 (or 2))
-
19.30
5.20
Government investment
-
24.42
26.81
= PVB - PVC
-
2.25
6.15
= PVB/PVC
108 Plant Protection Quarterly Vol.29(3) 2014
29.74 (L 2)
Sum of modelled density per hectare per land use
line reduces the number of hectares of infested land compared to the uniform intervention, but allows a greater area have high density infestations (40–60%) (Figure 5a and b). Almost all of the study region (96.8%) is comprised of only three land uses: dryland pasture (~62%), irrigated pasture (~16%), and native vegetation (~16% - not all of which is susceptible to serrated tussock establishment). The remaining land uses include roadsides, perennial horticulture, urban and forestry and cover only 3.2% of the landscape. Illustrating that the model’s intrinsic variability in the amount of spread across the ten model runs for each scenario, the standard error in each landuse was smaller than the difference between the average number of hectares infested for most of the years the model was running (Figures 6, 7 and 8). The two containment scenarios reduce the number of hectares of infested land compared to the area that could be infested if serrated tussock were allowed to spread without government intervention (the baseline, Figure 9 c.f. Figure 5). Clearly there is a benefit to implementing either containment program. However, there is no clear difference in the number of hectares infested between the two containment scenarios. In the shorter term, the uniform intervention strategy would appear to slow the spread of serrated tussock more successfully. However, after 16 years, the spread under the containment line strategy appears to plateau, suggesting there may be longer term benefits under this strategy. The spatial modelling revealed that the rate of spread under each containment strategy was different, but also that the shape of the invasion curve differs between the two. An economic analysis that only included a rate of spread would not draw out this distinction. These results exemplify that general rules regarding optimal management strategies are useful for informing the development of regional strategies. Our study follows the findings of Moody and Mack (1988) by comparing a containment line to manage outlier infestations with the uniform strategy that focusses on the core. However, by including landscape heterogeneity and social factors we can observe their importance in the spread of a weed, as highlighted by Epachin-Niell and Wilen (2014) and Bergelson et al. (1993). The other effect that the model can reveal is how the spatial arrangement of the productive value of the land, especially in relation to the location of a containment line, affects the control costs and economic benefits of each management strategy. The economic analysis compared the sum of the cost of
control by landowners and the avoided cost of potential damage to the cost of compliance by government to identify the best value-for-money containment strategy. We defined the best value-formoney containment strategy as the one that generated the highest benefit-cost ratio or net present value. Containment failure occurred after four years 90% of the time under the containment line strategy. A potential refinement of the containment line approach could add outlier surveillance effort in the unoccupied zone to increase management of these satellite infestations. Consideration would need to be given to funding such an approach as the proposed containment line utilises the entire available budget. For each management strategy, we estimated the value of the costs and losses associated with the spread of infestations through time, based on the predicted extent of serrated tussock infestation per land use type, and the per unit cost of control and productivity loss for each land use. The cost of government investment was equal to the compliance cost per property of $1000 per annum. A four percent discount rate was applied to each annual output to determine the sum of the present values of future costs and benefits. Both containment strategies are good ‘value for money’ (benefit-cost ratio is more than one for both) (Table 2). If the current trend in investment through the uniform intervention is continued, a relatively lower BCR could be expected (BCR = 2.25). By implementing the containment line strategy, a less costly alternative i.e. $5M vs $19M, we could expect similar net present values, but a relatively higher BCR (BCR = 6.15). Overall, both strategies would generate more benefits than their cost and thus be judged as good investments. The containment line strategy appears to be the investment option that offers the best value-for-money. Once again, the model illuminates the importance of considering a realistic landscape because the containment line formed an effective spread barrier in concert with natural vegetation and coastal barriers to the north, north-east and south of the infested areas, as well as the predominantly east-west wind directions directing dispersal and providing clues to locating an effective containment line. Without these features, the containment line would have had to surround the core infestations entirely, thereby increasing the government investment and likely reducing the cost:benefit to below that of the uniform strategy. Despite the higher BCR of the containment line, compared to uniform
intervention, the estimated productivity loss was higher under the containment line strategy than uniform intervention. Also, the control cost (to landholders) under the containment line strategy was more than double that under the uniform intervention strategy. These two higher costs were offset by the lower cost to government under the containment line scenario which was less than a third of that under the uniform intervention strategy. The NPV for each scenario per year indicates that the uniform intervention and containment line strategies only begin to generate a net benefit (i.e. NPV>0) after nine or ten years. The model has provided a method for quantifying the benefits of continued investment in a containment strategy for serrated tussock. The present value of the benefits of either containment strategies is in the order of $32–44M. The model’s ability to also quantify the costs of each strategy reveals that the higher cost of the uniform intervention gives it a lower BCR. Continuing the current level of government investment in strategic enforcement under a proposed new containment line strategy would give the highest return. This paper focuses on the application of an ecological modelling tool to examine variations in weed dispersal over time and space and then analysing the consequence of such changes from an economic perspective. For the basic economic model we applied a four per cent (4%) discount rate to estimate present values of future costs and benefits. This chosen rate is within the range of three and seven per cent recently used in biosecurity benefit-cost analysis in Australia (e.g. Kompas 2012, Hafi et al. 2013). It would be worth looking at the significance of the impact when using higher discount rates on the net benefits of each containment strategy we considered here. Hence, the effect of a seven per cent (7%) discount rate typically applied to projects involving the use of public funds in Australia (Hafi et al. 2013) will be explored in our future work. This would be useful in determining whether the containment strategy we have identified as best value for money will be the same regardless of a higher discount rate being used. Rebaudo and Dangles (2013) modelled the dissemination of information amongst farmers. We assumed that where compliance was currently, or had previously been enacted, the level of knowledge about management of serrated tussock would be uniform, which is not necessarily so. We also acknowledge that there is an upper and lower threshold to managing a weed species that is linked
Plant Protection Quarterly Vol.29(3) 2014 109
to its density. We found no simple way to link density-dependent weed control with assumed compliance levels so did not include this in our model. The user-interface aspect of this Netlogo model also gives scope for the model to be applied to analyzing management options for other weed species with different biological traits and management options.
Acknowledgements
We would like to thank Jean-Philippe Aurambout, Ratnapriya Gajaweera and Franz Mahr for their work developing earlier versions of this model; Nigel Ainsworth and Michael Rosier for the time they spent guiding this project; Paul Major for his input into the containment strategies; the Victorian Serrated Tussock Working Party and in particular Alison Head for linking us with several experts who contributed data and comments to the development of the model, including Peter Steller and Peter Stark; David McLaren and Charles Grech for technical expertise; andthe first draft of this paper was improved by Fiona Ede, all from the Victorian Department of Environment and Primary Industries. The comments from two anonymous reviewers were very useful in constructing the final version of this paper. We thank them too.
References Bergelson, J., Newman, J.A. and Floresroux, E.M. (1993). Rates of weed spread in spatially heterogeneous environments. Ecology 74, 999-1011. Buckley, Y.M., Briese, D.T. and Rees, M. (2003). Demography and management of the invasive plant species Hypericum perforatum. II. Construction and use of an individual-based model to predict population dynamics and the effects of management strategies. Journal of Applied Ecology 40(3), 494-507. Büyüktahtakın, İ.E., Feng, Z., Frisvold, G., Szidarovszky, F. and Olsson, A. (2011). A dynamic model of controlling invasive species. Computers and Mathematics with Applications 62(9), 3326-33. Campbell, M.H. (1998). Biological and ecological impact of serrated tussock (Nassella trichotoma (Nees) Arech.) on pastures in Australia. Plant Protection Quarterly 13(2), 80-5. Caplat, P., Hui, C., Maxwell, B.D. and Peltzer, D.A. (2014). Cross-scale management strategies for optimal control of trees invading from source plantations. Biological Invasions 16(3), 677-90. Coutts, S.R., van Klinken, R.D., Yokomizo, H. and Buckley, Y.M. (2011). What are the
key drivers of spread in invasive plants: dispersal, demography or landscape: and how can we use this knowledge to aid management? Biological invasions 13(7), 1649-61. Denne, T. (1988). Economics of Nassella Tussock (Nassella trichotoma) control in New Zealand. Agriculture, Ecosystems and Environment 20(4), 259-78. Epanchin-Niell, R.S. and Hastings, A. (2010). Controlling established invaders: integrating economics and spread dynamics to determine optimal management. Ecology Letters 13, 528-41. Epanchin-Niell, R.S. and Wilen, J.E. (2014). Individual and cooperative management of invasive species in human-mediated landscapes. American Journal of Agricultural Economics: doi: 10.1093/ajae/aau058
weed spread: an economic assessment of serrated tussock control. Agricultural Economics 22(1), 91-103. Kompas, T. (2012). Optimal Surveillance, Public Perceptions, and the Non-Market Value of Biosecurity Measures. Presentation to the Department of Agriculture, Fisheries and Forestr y, Canberra, May 2012. ht tps://craw ford.anu.edu.au/pdf/staf f/ tom_kompas/2012/presentations/DAFF-2Kompas-pptx.pdf (accessed 11 November 2014). Lane, D.W.A. and Edgar, R.V. (1978). ‘Serrated Tussock in Victoria.’ (Department of Crown Lands and Survey, Victoria). Moody, M.E. and Mack, R.N. (1988). Controlling the spread of plant invasions: The importance of nascent foci. Journal of Applied Ecology 25, 1009-21.
Frid, L., Knowler, D., Myers, J.H., Scott, L. and Murray, C. (2013). A multi-scale framework for evaluating the benefits and costs of alternative management strategies against invasive plants. Journal of Environmental Planning and Management 56(3), 412-34.
Moore, J.L., Runge, M.C., Webber, B.L. and Wilson, J.R.U. (2011). Contain or eradicate? Optimizing the management goal for Australian acacia invasions in the face of uncertainty. Diversity and Distributions 17(5), 1047-59.
Gardener, M.R. and Sindel, B.M. (1998). The biology of Nassella and Achnantherum species naturalised in Australia and the implication of management on conservation lands. Plant Protection Quarterly 13(2), 76-9.
Odom, D.I.S., Cacho, O.J., Sinden, J.A. and Griffith, G.R. (2003). Policies for the management of weeds in natural ecosystems: the case of scotch broom (Cytisus scoparius L.) in an Australian national park. Ecological Economics 44(1), 119-35.
Giljohann, K.M., Hauser, C.E., Williams, N.S.G. and Moore, J.L. (2011). Optimizing invasive species control across space: willow invasion management in the Australian Alps. Journal of Applied Ecology 48(5), 1286-94.
Panetta, D.F. (2012). Evaluating the performance of weed containment programmes. Diversity and Distributions 18(10), 1024-32.
Hafi, A., Spring, D., Croft, L., Kompas, T. and Morey, K. (2013). ‘Cost-effectiveness of biosecurity response options to red imported fire ants in South East Queensland.’ Australian Bureau of Agricultural and Resource Economics repor t for the National Biosecurity Committee, Canberra, Australia. Healy, A. (1945). Nassella tussock (Nassella trichotoma (Nees.) Hack.). Field studies and their agricultural significance. Department of Science and Industrial Research, New Zealand, Bulletin 91, 1-90. Higgins, S.I., Richardson, D.M. and Cowling, R.M. (2000). Using a dynamic landscape model for planning the management of alien plant invasions. Ecological Applications 10(6), 1833-48. Iannone, B.V., Zellner, M.L. and Wise, D.H. (2014). Modeling the impacts of life-history traits, canopy gaps, and establishment location on woodland shrub invasions. Ecological Applications 24(3), 467-83. Januchowski-Hartley, S.R., Visconti, P. and Pressey, R.L. (2011). A systematic approach for prioritizing multiple management actions for invasive species. Biological Invasions 13(5), 1241-53. Jones, R.E. and Vere, D.T. (1998). The economics of serrated tussock in New South Wales. Plant Protection Quarterly 13(2), 70-6. Jones, R.E., Vere, D.T. and Campbell, M.H. (2000). The external costs of pasture
110 Plant Protection Quarterly Vol.29(3) 2014
Railsback, S.F. and Grimm, V. (2011). ‘Agentbased and individual-based modeling: A prac tical introduc tion’. (Princeton University Press, New Jersey, United Sates of America). 352 pp. Rebaudo, F. and Dangles, O. (2013). An agent-based modeling framework for integrated pest management dissemination programs. Environmental Modelling and Software 45, 141-9. Shea, K., Sheppard, A. and Woodburn, T. (2006). Seasonal life-history models for the integrated management of the invasive weed nodding thistle Carduus nutans in Australia. Journal of Applied Ecology 43(3), 517-26. Vere, D.T., Auld, B.A. and Campbell, M.H. (1993). Economic assessments of serrated tussock as a pasture weed. Weed Technology 7, 776-82. Victoria Department of Primary Industries (2011). ‘South West Farm Monitor Project Data in Livestock Farm Monitor Project Results 2010/11.’ (Farm Services Division, Depar tment of Primar y Indus tries Melbourne, Victoria). Wilensky, U. (1999). NetLogo. http://ccl. nor thwestern.edu/netlogo (Center for Connec ted Learning and ComputerBased Modeling, Northwestern University, Evanston, Illinois, United States of America). Williams, N.S.G., Hahs, A.K. and Morgan, J.W. (2008). A dispersal-constrained habitat suitability model for predicting invasion of alpine vegetation. Ecological Applications 18, 347-59.