Tool Demonstration: Effective Runtime Exploration of the Inter-Procedural Control Flow in Java Applications Philippe Moret
Walter Binder
Abbas Heydarnoori
Danilo Ansaloni
Faculty of Informatics, University of Lugano, CH–6904 Lugano, Switzerland
[email protected]
Abstract Statically exploring the inter-procedural control flow of objectoriented applications is often difficult because of the use of abstraction, polymorphism, and dynamic binding. To ease this problem, in this tool demonstration, we present a new profiler that dynamically explores the inter-procedural control flow of Java applications while they are executing. Our profiler visualizes the complete Calling Context Tree (CCT) with various dynamic metrics, such as method invocations, executed bytecodes, or allocated objects, and enables efficient navigation in large CCTs comprising up to several millions of nodes. We show that our tool can render data quite fast with response times in the range of 14–204ms upon user interactions. Thanks to a carefully tuned incremental data representation, the profiling data produced by a running application can be updated several times per second on a standard laptop. The visualization can also show recently active parts of the application. The collection of profiling data uses an aspect-based dynamic program analysis technique that simplifies extension and customization of the tool. Categories and Subject Descriptors C.4 [Computer Systems Organization]: Performance of Systems–Measurement Techniques; I.3.8 [Computing Methodologies]: Computer Graphics–Applications General Terms
Measurement, Performance, Experimentation
Keywords Calling context profiling, Calling Context Tree (CCT), calling context ring chart, visualization, aspect-oriented programming
1. Introduction Program profiling techniques are widely used by application developers to collect information about the runtime behavior of programs. Calling context profiling is a common technique that yields dynamic metrics separately for each calling context, such as the number of method invocations or the number of object allocations in a calling context. A calling context is a sequence of methods that were invoked but have not yet completed; that is, a calling context corresponds to the methods represented on the call stack at some moment during program execution. Calling context profiling is powerful since it helps in analyzing the dynamic interprocedural control flow of applications. This technique is particu-
Permission to make digital or hard copies of all or part of this work for personal or classroom use is granted without fee provided that copies are not made or distributed for profit or commercial advantage and that copies bear this notice and the full citation on the first page. To copy otherwise, to republish, to post on servers or to redistribute to lists, requires prior specific permission and/or a fee. PPPJ ’10, September 15–17, 2010, Vienna, Austria. c 2010 ACM 978-1-4503-0269-2. . . $10.00 Copyright
larly important for comprehending and optimizing modern objectoriented software, where polymorphism, dynamic binding, and reflection often hinder static analysis approaches. The Calling Context Tree (CCT) [1] is the most commonly used data structure for representing calling context profiles. Each node in the CCT corresponds to a calling context and stores the measured dynamic metrics for that calling context. Moreover, the parent of a node represents the caller’s context, while the children nodes correspond to the callee methods. Most of the existing techniques for generating CCTs illustrate them in the form of expandable trees. However, CCTs can become quite large, sometimes comprising millions of nodes. Furthermore, the depth of CCTs can be large so that CCTs with 50–400 layers are common in practice. In this situation, navigating and exploring CCTs for a particular dynamic metric of interest (e.g., locating invocations of a particular method in various calling contexts) can be quite challenging when a simple expandable tree representation is used, and hence, better visualization techniques are required. We tackled this problem by using Calling Context Ring Charts (CCRCs) [5, 7, 8] for visualizing and exploring CCTs. In a CCRC, the CCT root is represented as a circle in the center. Callee methods are represented by ring segments surrounding the caller’s ring segment. With CCRCs, it is possible to display all calling contexts of a CCT in a single chart, preserving the caller/callee relationships conveyed in the CCT. For a detailed analysis of certain calling contexts, they can be selected to be visualized separately and the tree depth can be limited. In our earlier work [5–8], we employed our CCRC visualizations to explore the profiles offline after program termination. However, offline exploration of profiles has the disadvantage that it may be impossible for the user to visualize and explore the profiles while the program is running. This is not specially suitable for longrunning programs. To address this issue, in this tool demonstration we present a novel profiler that employs our CCRC visualizations to ease the exploration of the inter-procedural control flow of applications while they are running. In this profiler, the application is being executed on a Java Virtual Machine (JVM), and using an aspect written in AspectJ, its corresponding CCT is built at the same time. To reduce the overheads of profiling and visualizing, the updates to this CCT during the application execution are incrementally transmitted to a second JVM process that runs our CCRC visualization. Thanks to this incremental transmission of data, the profiler can highlight the recently active parts of the application during its execution. The user can also interactively play with the visualization tool and navigate the profiles. The novel contributions of this tool demonstration include (i) CCRC visualization of an application while it is running, (ii) incremental transmission of updated CCT fragments and incrementally building the complete CCT from these fragments, and (iii) visualization of recently active parts of the application.
public aspect CCTProf { public static final CCTNode root = new CCTNode(); public static final ThreadLocal currentNode = new ThreadLocal() { protected CCTNode initialValue() { return root; } }; pointcut execs() : execution(* *.*(..)) && !within(CCTProf) && !within(CCTNode); before() : execs() { CCTNode caller = currentNode.get(); CCTNode callee = caller.profileCall(thisJoinPointStaticPart); currentNode.set(callee); } after() : execs() { CCTNode caller = currentNode.get().getParent(); currentNode.set(caller); } ... }
Figure 1. Simplified aspect for building CCTs public aspect AllocCCTProf { ... // Same code as in Figure 1 pointcut allocs() : call(*.new(..)) && !within(AllocCCTProf) && !within(CCTNode); after() returning(Object o) : allocs() { currentNode.get().profileAllocation(o); } }
Figure 2. Extended aspect to collect also object allocation metrics This paper is organized as follows. Section 2 presents the aspects that were used to build the CCT during the application execution. Section 3 provides an overview of CCRC visualizations. Section 4 describes the architecture of our profiler. Section 5 discusses the results of empirical evaluations. Section 6 overviews related work and Section 7 concludes.
after() advice is woven after constructor invocations, and the newly created object is passed to the advice as an argument. We assume that the method profileAllocation(...) updates object allocation metrics, such as the number of allocated instances and an estimate of the total allocated bytes in a calling context.
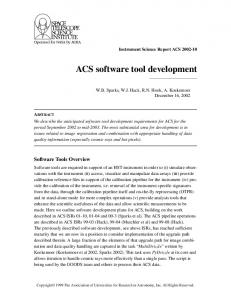
3. Visualizing CCTs as Calling Context Ring Charts (CCRCs) To visualize CCTs in a more condensed way and to offer advanced exploration capabilities, CCRCs use an onion-like structure with circular layers in which each layer corresponds to a layer in the CCT (Figure 3 (left)). Beginning with the root node as the central ring, nodes are illustrated as ring segments, and children nodes (callees) are represented on the outer ring of their parent (caller). Currently, CCRCs support three different kinds of visualizations [5, 7, 8]. First, for each caller, the ring segments of the callees have the same size and completely surround the caller’s ring segment. While this representation eases the analysis of caller/callee relationships, it does not convey any information on dynamic metrics collected within different calling contexts. In the second visualization, the angle covered by each ring segment is proportional to the contribution of the corresponding calling context to a chosen dynamic metric, relative to the respective caller’s contribution. For example, if object allocation is chosen as the desired metric, this representation reveals the methods that instantiate the most objects in each calling context. While in the first and second visualizations the width of each layer in the ring chart is the same, the third representation continuously reduces the width of outer layers such that the area occupied by each ring segment is proportional to the overall metric contribution of the corresponding calling context. The above three visualizations are complemented with four tree manipulation operations on the CCT that help exploring large calling context profiles. The first operation, subtree selection, allows the selection of any CCT node as root, while the second operation, depth limitation, limits the depth of the visualized CCT. The third operation, recursion elimination, merges CCT nodes representing recursive calls. This operation can significantly reduce the CCT size in the presence of recursions. Finally, the fourth operation, dynamic metric aggregation, determines the overall metric contribution of each method, completely discarding calling context information.
4. Profiler Architecture 2. Dynamic Analysis Aspects for Building CCTs Figure 1 illustrates a simplified version of an aspect used in building CCTs [2]. This aspect keeps the root of the shared CCT in a static field and defines the thread-local variable currentNode to keep the current position in the CCT for each thread. The two advices in Figure 1 build the CCT. The before() advice is woven in method entries. It loads the caller’s CCTNode instance from the thread-local variable currentNode, looks up the callee’s CCTNode (profileCall(...)), and stores it back into the thread-local variable currentNode. The static join point representing the woven method (i.e., the method identifier of the callee) is accessed through the AspectJ pseudo-variable thisJoinPointStaticPart. In the after() advice, which is woven right before returning from the method or throwing an exception, the callee’s CCTNode is loaded from the thread-local variable currentNode in order to access its parent node (assuming that each CCTNode instance keeps a reference to the parent node in the tree). To highlight the flexibility of our AOP-based approach to profiler development, Figure 2 illustrates an extension of the CCTProf aspect (Figure 1), called AllocCCTProf, in order to collect also object allocation metrics for each calling context. The additional
Figure 3 illustrates a screenshot of our profiler and Figure 4 depicts its architecture. In this tool, the Java application being profiled is executed on a JVM and at the same time, the CCT profiling aspects build its corresponding CCT. This CCT is being continuously updated during the application execution. Since the standard AspectJ weaver cannot weave aspects into the Java class library, the MAJOR [13] aspect weaver is used instead in order to have full method coverage. While the application is being executed on the first JVM, a thread periodically transmits the updated CCT fragments through a socket to a second JVM that runs the CCRC visualization tool. The corresponding CCRC visualization is then automatically updated with the newly arriving data. In this way, our profiler supports incremental transmission of data in which, at the beginning, the complete CCT structure is transmitted from the first JVM to the second one. Afterwards, only new or updated CCT nodes are being sent. A CCT node is considered updated, if it has one or several new children, or if some of the dynamic metrics corresponding to that node have been updated (since the last transmission). The incremental transmission of data not only decreases the amount of data communicated between the two JVMs, but also
Figure 3. Profiler screenshot
Incremental Transmission
CCT'
JVM
Figure 4. Profiler architecture allows the profiler to highlight the recently active parts of the application.
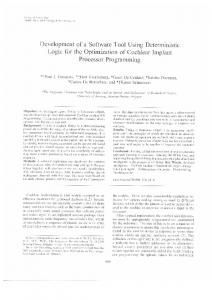
5. Evaluation This section presents the results of the evaluations performed to validate whether our tool can be used to profile real-world applications such as Eclipse. These evaluations were done with the DaCapo benchmark suite1 with its default workload size running on a laptop with Sun JDK 1.6 18, Intel Core 2 Duo 2.33Ghz processor, 3GB of memory, and the Linux Fedora 12 operating system. Size of Transmitted Packets. This evaluation was done to show that the sizes of the packets transferred from the first JVM to the second one is much smaller than the size of the whole CCT data. Figure 5 presents the sizes of successively transmitted data packets for a single run of DaCapo’s “eclipse” benchmark with a transmission rate of 1.25 packets per second. For each packet, this figure also differentiates between the size of the transmitted CCT nodes and the size of the sent dynamic information. This information in1 http://www.dacapobench.org/
cludes different dynamic metrics such as the number of method invocations, the number of executed bytecodes, the number of allocated objects, and the total size of allocated objects. A transmission rate of 1.25 packets per second confirms that the developer always observes up-to-date dynamic information in the visualization tool, refreshed more than once per second, while the application is running on the first JVM. In total, 370 packets were sent in a total runtime of 296 seconds. Although most packets were relatively small, below 1MB, some packets were considerably larger, reaching up to 9MB. For instance, packets 60–79 appear as a major peak in the figure. We found that these packets were conveying dynamic information collected while the “eclipse” benchmark was compiling some projects. On the other hand, the minor peak in Figure 5, i.e., packets 227– 232, corresponds to some XML data processing. The initial packets, collected during the startup phase of “eclipse”, were very small. This can be described by the fact that the startup phase was IOintensive and involved much class-loading and just-in-time compilation by the JVM, which were mostly implemented in native code and consequently, were not amenable to MAJOR’s instrumentation. With respect to the above discussion, we conclude that due to the incremental data transmission feature of our profiler, typically only a subset of the CCT nodes is transmitted. This makes it possible to frequently transmit the collected dynamic information to the visualization tool, and to continuously provide up-to-date data to the user. CCRC Rendering Performance. The goal of this evaluation is to illustrate that our CCRC visualization can render large CCTs in a small amount of time, which makes it practical in exploring large CCTs. To this end, first we generated CCTs for the DaCapo benchmarks. The size of these CCTs was huge comprising up to 2,166,169 nodes for the “eclipse” benchmark. Afterwards, we visualized the generated CCTs by using our second type of CCRC visualizations (see Section 3). The rendering time was between 14ms and 204ms for a varying number of displayed tree layers. As experimentally established in [3], users will not notice delays in their mouse interactions when the response time is up to 195ms.
updated fragments of the CCT from the first JVM to the second one, our profiler also helps the user focus on the recently active parts of the running application. Our evaluations confirm that rendering CCRCs is perceived almost instantaneously (in the range of 14–204ms). Additionally, thanks to incremental data transmission, the profiling data produced by a running application can be updated several times per second on a standard laptop. Finally, due to an aspect-based dynamic program analysis technique which is used in the collection of profiling data, it is easily possible to extend and customize the tool.
Acknowledgments The work presented in this paper has been supported by the Swiss National Science Foundation. Figure 5. Sizes of transmitted data packets for the “eclipse” benchmark. Transmission rate: 1.25 packets per second With respect to this, we conclude that CCRC rendering is perceived as being almost instantaneous by users, allowing them to explore very large calling context profiles smoothly. Interested readers are referred to [8] for a detailed description of results. Instrumentation Considerations. As described in Section 4, in order to have full method coverage including the Java class library, we use MAJOR for instrumenting the code. MAJOR offers a mechanism that allows the inserted code to be skipped [13]. We use this feature to avoid perturbations (e.g., method calls for network communication) and to prevent infinite regression when the profiler calls back in the Java class library. Regarding the instrumentation overhead, it was evaluated with a similar setting to this paper in [11]. The overhead of running the instrumented program is typically a factor of 3 to 10.
6. Related Work There is a large body of related work on visualizing large hierarchies in a comprehensible form. Interested readers are referred to [4] for a detailed survey of these techniques. One main category of these approaches is radial techniques that represent hierarchical structures in a circular layout, similarly to CCRCs. Previous research has indicated that these techniques are highly effective in supporting the users in exploring hierarchical structures [12]. Consequently, this observation backs the claim that CCRCs are useful in practice for exploring large CCTs. In contrast to our profiler that uses CCRCs to visualize profiling data, many existing profilers, such as JProfiler [10] and NetBeans Profiler [9], visualize calling context profiles in the form of expandable trees. In these profilers, calling contexts are sorted by their contribution to an aggregated metric (typically execution time) and can be expanded or collapsed in order to show or hide callees. While such a view is simple and straightforward to use, CCRCs convey more profiling information in a single view and give a better understanding of caller/callee relationships. Moreover, by using the subtree selection and depth limitation operations, CCRCs efficiently support exploring parts of the CCT which are of interest.
7. Conclusion In this tool demonstration, we presented a profiler that employs Calling Context Ring Charts (CCRCs) visualization to enable efficient construction and navigation of large CCTs while the program is running. By running the application and the visualization on two different JVMs, and by incrementally transmitting only the
References [1] G. Ammons, T. Ball, and J. R. Larus. Exploiting hardware performance counters with flow and context sensitive profiling. In Proceedings of the ACM SIGPLAN Conference on Programming Language Design and Implementation, pages 85–96. ACM Press, 1997. [2] D. Ansaloni, W. Binder, A. Villaz´on, and P. Moret. Rapid development of extensible profilers for the Java virtual machine with aspectoriented programming. In Proceedings of the 1st Joint International Conference on Performance Engineering, pages 57–62. ACM Press, 2010. [3] J. R. Dabrowski and E. V. Munson. Is 100 milliseconds too fast? In Extended Abstracts on Human Factors in Computing Systems, pages 317–318. ACM Press, 2001. [4] I. Herman, G. Melanc¸on, and M. S. Marshall. Graph visualization and navigation in information visualization: A survey. IEEE Transactions on Visualization and Computer Graphics, 6:24–43, 2000. [5] P. Moret, W. Binder, D. Ansaloni, and A. Villaz´on. Visualizing Calling Context Profiles with Ring Charts. In Proceedings of the 5th IEEE International Workshop on Visualizing Software for Understanding and Analysis, pages 33–36. IEEE Computer Society, 2009. [6] P. Moret, W. Binder, M. Schoeberl, A. Villaz´on, and D. Ansaloni. Analyzing performance and dynamic behavior of embedded Java software with calling-context cross-profiling. In Proceedings of the 7th International Conference on Principles and Practice of Programming in Java, pages 121–124. ACM Press, 2009. [7] P. Moret, W. Binder, D. Ansaloni, and A. Villaz´on. Exploring large profiles with calling context ring charts. In Proceedings of the First Joint International Conference on Performance Engineering, pages 63–68. ACM Press, 2010. [8] P. Moret, W. Binder, A. Villaz´on, D. Ansaloni, and A. Heydarnoori. Visualizing and exploring profiles with calling context ring charts. Software: Practice and Experience, 2010. [9] NetBeans. The netbeans profiler project. Web pages at http:// profiler.netbeans.org/. [10] ProSyst. ProSyst JProfiler. Web pages at http://www.prosyst. com/. [11] D. R¨othlisberger, M. H¨arry, A. Villaz´on, D. Ansaloni, W. Binder, O. Nierstrasz, and P. Moret. Augmenting static source views in IDEs with dynamic metrics. In Proceedings of the 25th IEEE International Conference on Software Maintenance, pages 253–262. IEEE Computer Society, 2009. [12] J. Stasko, R. Catrambone, M. Guzdial, and K. McDonald. An evaluation of space-filling information visualizations for depicting hierarchical structures. International Journal of Human-Computer Studies, 53 (5):663–694, 2000. [13] A. Villaz´on, W. Binder, and P. Moret. Aspect Weaving in Standard Java Class Libraries. In Proceedings of the 6th International Symposium on Principles and Practice of Programming in Java, pages 159–167. ACM Press, 2008.