Downloaded from rspa.royalsocietypublishing.org on October 1, 2012
Proc. R. Soc. A (2012) 468, 3552–3570 doi:10.1098/rspa.2012.0270 Published online 25 July 2012
Tool durability maps for friction stir welding of an aluminium alloy BY T. DEBROY1, *, A. DE2 , H. K. D. H. BHADESHIA3 , V. D. MANVATKAR2 AND A. ARORA1 1 Department
of Materials Science and Engineering, Pennsylvania State University, University Park, PA 16802, USA 2 Department of Mechanical Engineering, IIT Bombay, Powai, Mumbai 400076, India 3 Department of Materials Science and Metallurgy, Cambridge University, Pembroke Street, Cambridge CB2 3QZ, UK Friction stir welding is not used for hard alloys because of premature tool failure. A scheme is created that exploits the physical three-dimensional heat and mass flow models, and implements them into a fast calculation algorithm, which, when combined with damage accumulation models, enables the plotting of tool durability maps that define the domains of satisfactory tool life. It is shown that fatigue is an unlikely mechanism for tool failure, particularly for the welding of thin plates. Plate thickness, welding speed, tool rotational speed, shoulder, and pin diameters and pin length all affect the stresses and temperatures experienced by the tool. The large number of these variables makes the experimental determination of their effects on stresses and temperatures intractable and the use of a well-tested, efficient friction stir welding model a realistic undertaking. An artificial neural network that is trained and tested with results from a phenomenological model is used to generate tool durability maps that show the ratio of the shear strength of the tool material to the maximum shear stress on the tool pin for various combinations of welding variables. These maps show how the thicker plates and faster welding speeds adversely affect tool durability and how that can be optimized. Keywords: friction stir welding; tool durability; fatigue and erosion; durability maps
1. Introduction The early failure of friction stir welding tools during the joining of hard alloys precludes the widespread application of friction stir welding (FSW) to steels and many other important engineering alloys (Bhadeshia & DebRoy 2009; Rai et al. 2011). The tool durability is often limited by mechanical erosion (Thompson & Babu 2010) and, depending on the tool and workpiece materials, by chemical erosion and other mechanisms such as fatigue and fracture. The subject has recently been reviewed (Rai et al. 2011). At the initiation of the FSW process when both the workpiece and the tool are cold, the plunge force needed to insert the tool can also affect the tool life. Subsequently, during welding, the high *Author for correspondence (
[email protected]). Received 8 May 2012 Accepted 26 June 2012
3552
This journal is © 2012 The Royal Society
Downloaded from rspa.royalsocietypublishing.org on October 1, 2012
Maps for friction stir welding
3553
stresses and temperatures endured by the tools are often the main underlying factors in the failure. The stresses and temperatures, in turn, are affected by the plate thickness, welding speed, tool rotational speed, shoulder and pin diameters and pin length. A lack of comprehensive understanding of how these variables affect the temperature and stresses hinders any meaningful systematic exploitation of the process, especially for the welding of hard alloys. What is urgently needed in the field, and not currently available, is a set of maps of stresses experienced by an FSW tool relative to its shear strength as a function of welding conditions. Because the temperature affects the shear strength of the tool material (Brandes & Brook 1992), the ratio of the tool shear strength at the peak temperature and the maximum shear stress on the tool pin can serve as a quantitative measure of the durability of the tools from stress-related failure. The higher the value of this index, the higher is the durability of the tool in an environment when mechanical wear is the main mechanism of tool failure and chemical erosion can be ignored. The availability of the maps can allow welding engineers to select welding variables for maximum tool durability, especially for hard alloys such as steels or the strong aluminium variants. Experimental determination of the effects of all the FSW variables on the stresses and temperatures is impractical because of the large number of experiments needed to evaluate the effects. Furthermore, the direct measurement of stresses and the temperatures of the tool pin is challenging because the pin is immersed inside the deforming solid (Sorensen & Stahl 2007). Heat and materials flow models of FSW have been able to correctly predict available experimental data of thermal cycles (Nandan et al. 2006a,b, 2007, 2008), torque (Arora et al. 2009, 2011, 2012; Mehta et al. 2011) and traverse force (Colegrove & Shercliff 2004, 2005, 2006; Arora et al. 2009, 2012) for the welding of aluminium alloys (AAs; Colegrove & Shercliff 2004, 2005, 2006; Nandan et al. 2006a; Mehta et al. 2011; Arora et al. 2009, 2011, 2012), steels (Nandan et al. 2006b, 2007) and titanium alloys (Nandan et al. 2008). These models can be used to create the tool durability maps, at least in principle. However, two problems need to be solved before these models can be applied to improve tool longevity. First, these large comprehensive FSW models solve the equations of conservation of mass, momentum and energy considering the spatial variation of thermophysical properties (Colegrove & Shercliff 2004, 2005, 2006; Nandan et al. 2006a,b, 2007, 2008; Arora et al. 2009, 2011, 2012; Mehta et al. 2011). These equations must be discretized, typically over a grid of 80 × 76 × 62 for seven variables, depending on the domain size, so that a total of some 2.64 million equations need to be solved for each iteration; such methods are less suited for rapid calculations in practical scenarios. Computational speed is especially important because large volumes of results are needed to create the tool durability maps. Second, and more important, these models (Colegrove & Shercliff 2004, 2005, 2006; Nandan et al. 2006a,b, 2007, 2008; Mehta et al. 2011; Arora et al. 2009, 2011, 2012) are mostly designed to calculate velocities, temperatures, torque and traverse force but they need to be restructured (Arora et al. 2012) to calculate the bending and overall stresses on the tools based on the principles of continuum mechanics to understand the potential failure mechanisms and create the tool durability maps when stresses are important. The problem of computational speed can be addressed by training and validating a neural network from the results of a well-tested, comprehensive, Proc. R. Soc. A (2012)
Downloaded from rspa.royalsocietypublishing.org on October 1, 2012
3554
T. DebRoy et al.
heat and material flow model for the required window of operating variables. A similar approach has been demonstrated to work well for fusion welding (Mishra & DebRoy 2007; Kumar & DebRoy 2007). Although several artificial neural network (ANN) models (Fratini & Buffa 2007, 2008; Okuyucu et al. 2007; Fleming et al. 2009; Fratini et al. 2009; Atharifar 2010; Tansel et al. 2010) have been developed to calculate various features of the FSW process and the weld attributes, none of the existing models can predict bending stress and the maximum shear stress on the tool pin. In order for a neural network to produce bending stresses and maximum shear stresses on the tool that are close to those obtained from models based on the laws of conservation of mass, momentum and energy, certain requirements need to be satisfied. The data for the training and testing of the neural network must be selected from an appropriate large array of modelling results to adequately represent a given window of welding variables for a particular workpiece alloy and tool material. The errors in the prediction of the neural networks must also be low. The minimization of the errors involves the assessment of the alternative neural network architectures in order to select the one with the minimum attainable errors in prediction without over-fitting the problem. Only then can the neural network produce results that are as close to those obtained from the numerical heat transfer and material flow model as possible but without the large computational time requirement of a comprehensive model. Restructuring of the existing heat and materials flow models to predict the stresses on the FSW tools bridges the large gap that exists between the current model capabilities and the needs of practising engineers. Most available models provide the velocity and temperature fields and a few can calculate the traverse force and the torque. In contrast, what the practising engineers need is a detailed understanding of the temperatures and stresses on the FSW tools for various welding conditions. For example, the bending stress on the tool pin can be useful to estimate the fatigue life of the tool pins. The maximum shear stresses and temperatures can be used to construct the tool durability maps that can guide engineers to select appropriate welding variables to achieve most favourable stress and temperature conditions to enhance tool life. Here, the results from a comprehensive phenomenological model are used to produce ANN with an adjustable architecture to achieve the optimal agreement between the outputs of the neural network and the phenomenological models. The neural network model provides a means to estimate errors in the prediction of output variables rigorously. After the capability of the neural networks is rigorously tested, they are then used to create the tool durability maps that can be interrogated to determine how the maximum shear stress experienced by the tool pin can be affected by changes in welding variables. Apart from providing greater validation of the models by the users of FSW, the maps can enable the modelling results to be practically used by the welding engineers to prolong tool life based on scientific principles.
2. Calculation procedure The tool pins and the shoulder surface geometries differ widely in FSW. A rough shoulder surface leads to a larger shoulder surface area for a given shoulder Proc. R. Soc. A (2012)
Downloaded from rspa.royalsocietypublishing.org on October 1, 2012
Maps for friction stir welding
3555
diameter, higher heat-generation rates and increased peak temperatures. Also, the shoulder surface is not always flat, particularly when the escape of plasticized materials from the top surface is a concern. The pin geometry typically used is that of an inverted truncated cone with different types of features. Typically, the features on the pins facilitate movement of plasticized materials, increase the pin surface area and slightly increase the heat-generation rate on the pin surface. Here, a straight tool pin without any thread or taper is considered for simplicity. Such tools are used (Lee et al. 2009) but it is appreciated that more complex geometries are applied in many cases. Some features on the pin may cause stress concentration that can contribute to tool fracture. It is important first to establish the scheme for calculating the tool durability maps first and then, if necessary, to progress towards intricate shapes and composite tools.
(a) Consideration of fatigue failure Initial work on the premature failure of FSW tools during the joining of hard materials shows that both the erosion of the tool as well its fatigue failure need to be considered. Fatigue can be the key cause of failure when joining thick plates, simply because the cyclic stresses experienced as the tool rotates and translates are larger. The crack propagation rate (Knott & Withey 1993) can be calculated as da = ADK m , (2.1) dN where a is the crack length, N is the number of cycles, A and m are materialdependent empirical constants and DK is the stress intensity factor range obtained from the following relation: DK = Ds(pa)1/2 ,
(2.2)
where Ds is the range of cyclic stress experienced by the tool pin. The crack growth rate given by equations (2.1) and (2.2) can be integrated between the initial crack size and a crack size required before fracture to obtain the number of cycles to failure, Nf (Knott & Withey 1993), (1−m/2)
(1−m/2)
− a0 ] [af Nf = , m 0.5m [A(1 − m/2)Ds p ]
(2.3)
where af is the critical crack length of an edge crack in an semi-infinite plate obtained from the fracture toughness, KI (Knott & Withey 1993), af =
[KI /(1.12tb )]2 , p
(2.4)
where KI is the toughness of the tool material, and tb is the maximum bending stress. If the bending stress endured by the tool pin is known, the number of cycles to failure can be calculated from equation (2.3). The data used for calculations are presented in table 1. It will be shown subsequently in this paper that the fatigue failure of the tool when welding AA7075 is a serious consideration only when dealing with thick plates. Proc. R. Soc. A (2012)
Downloaded from rspa.royalsocietypublishing.org on October 1, 2012
3556
T. DebRoy et al.
Table 1. Data used for the calculation (Sessler & Weiss 1963) of number of cycles to failure for the FSW of AA7075. workpiece material tool material parameter A for tool material parameter m for tool material toughness of tool material range of initial crack size range of bending stress
AA7075 EN24 tool steel 1.93 × 10⁻¹³ m−1 3.05 40 MPa m1/2 0–25 mm 0–1500 MPa
(b) Wear as a failure mechanism Both chemical and mechanical erosion are potential mechanisms of tool failure, depending on the tool and workpiece materials. Although the mechanism of such degradation is complex, both temperature and stress are thought to be important. The stresses and temperatures are affected by the plate thickness, welding speed, tool rotational speed, shoulder and pin diameters and pin length for a given pair of tool and workpiece materials. Thus, the tool durability maps are constructed based on temperatures and stresses experienced by the FSW tools. The following three tasks are needed for the calculations of the tool durability maps.
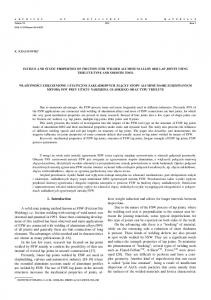
(i) Temperatures and stresses from heat transfer and material flow calculations A well-tested, three-dimensional, steady-state heat transfer and visco-plastic flow model (Nandan et al. 2006a,b, 2007, 2008; Arora et al. 2009, 2011, 2012; Mehta et al. 2011) for FSW is used as the main engine for the calculation of stresses and temperatures. The model does not consider the transient variations of variables during the initial tool insertion period or the final tool withdrawal period. The model solves the equations of conservation of mass, momentum and energy in steady-state, three-dimensional Cartesian coordinate considering incompressible single phase flow. It calculates three-dimensional heat-generation rates, temperature and velocity fields, viscosity, flow stress, strain rate and torque for various welding conditions and tool and workpiece materials. Because the details of the model are already available in the literature (Arora et al. 2009, 2011, 2012; Nandan et al. 2006a,b, 2007, 2008; Mehta et al. 2011), these are not repeated here. Instead, only the extension of the heat transfer and materials flow model to calculate the bending and maximum shear stresses are discussed here. Table 2 provides the thermophysical properties (Sessler & Weiss 1963) of workpiece material that are used for the calculations. Figure 1 shows a typical force distribution, q(z), opposite to the welding direction. The normal stress due to bending, sB , is calculated as (Popov 2003; Arora et al. 2012) ! 4 cos q L z q(z) dz, (2.5) sB = pr 3 z1 Proc. R. Soc. A (2012)
Downloaded from rspa.royalsocietypublishing.org on October 1, 2012
3557
Maps for friction stir welding (a) shoulder
S
S¢ (b)
q(z)
pin
L
B x
z S
x
y
D
S¢
q r x
welding direction
A
Figure 1. Schematic layout of (a) straight cylindrical pin and (b) cross-section along S –S # . Table 2. Data used for the calculation of temperature and velocity fields, torque and traverse force for the FSW of AA7075. workpiece material tool material workpiece solidus temperature, K specific heat (Sessler & Weiss 1963), J kg−1 K−1 thermal conductivity (Sessler & Weiss 1963), W m−1 K−1 yield stress (Sessler & Weiss 1963), MPa
AA7075 EN24 tool steel 749 853.5 + 1.25T − 4.18 × 10⁻⁴ T2 − 1.25 × 10⁻⁸ T3 74.52 + 2.5 × 10⁻¹ T − 4.18 × 10⁻⁵ T2 6.97 × 10³ × e(−0.0087×T) for T < 644 K 0.24478 × (749 − T) for 644 ≤ T ≤ 749 K
where r is the radius of the pin, q is the angle of the point A from the welding direction, L is the length of pin, z1 is the distance of the point A from the root of the pin, q(z) is the force on the infinitesimal part of the pin dz at z distance from the base of the pin. The shear stress, tT , at point A due to torsion can be estimated as (Popov 2003; Arora et al. 2012) tT = and
MT pr3 /2
! MT = ! rA × (1 − d)t × dA,
(2.6)
(2.7)
where MT is the sticking torque, rA is the distance of any infinitesimal area element, dA, from the tool axis, d is the spatial fractional slip, t is the temperature-dependent shear strength. The shear stress, tB , at point A due to bending can now be computed as (Popov 2003; Arora et al. 2012) ! 4 sin2 q L q(z) dz. (2.8) tB = 3 pr 2 z1 Proc. R. Soc. A (2012)
Downloaded from rspa.royalsocietypublishing.org on October 1, 2012
3558
T. DebRoy et al.
Following Tresca’s criterion, the maximum shear stress, tmax , at A is obtained as (Popov 2003; Arora et al. 2012) !" # sB 2 + (tB + tT sin q)2 + (tT cos q)2 . (2.9) tmax = 2 These equations help determine the stresses on the pin; it is assumed that the durability of the tool for the geometry considered is determined by the pin. Note that from an experimental point of view, it is only possible to measure the torque and force on the tool as a whole because the pin is buried within the workpiece and is rotating; the important point is that the results from these equations should not be compared against the forces and torques that are measured on the tool as a whole.
(ii) Neural network to expedite calculations Three ANN models were constructed to calculate peak temperature, bending stress and maximum shear stress for various values of welding speed, tool rotational speed, axial pressure, shoulder diameter, pin diameter and pin length. Because the pin length is close to the plate thickness in a typical FSW to obtain full penetration, plate thickness was not considered as an additional variable. The temperature-dependent thermophysical properties of the AA7075 workpiece and the tool were kept the same for all input variables, and, therefore, each ANN was valid for the specific tool and workpiece material combination within the range of variables considered. The ANNs were trained using a set of results from the heat transfer and visco-plastic flow model and tested with a different set of testing data. In order to produce ANN models that accurately represent the correct solutions from a given volume of training data, datasets were generated using a hybrid design of experiments embodying features of Taguchi’s design of experiments (Taguchi 1987) and central composite rotatable design (CCD; Montgomery 2004). A total of 10 levels of values were considered for the training data: five for Taguchi’s L50 array and five for the CCD array (Montgomery 2004). The testing data consisted of five levels of input parameters within the range of variables. Table 3 lists the levels of both training and testing data used for FSW of AA7075. The weights were optimized using a feed-forward back-propagation algorithm with the gradient descent approach (MacKay 1992). The calculations involved minimizing an objective function which was the squared error between the desired and the actual output assigning equal weights to all training data points. The optimum number of hidden nodes (from 1 to 12, which is two times the number of input nodes) for each ANN model were determined from the performance of these models based on the respective errors. The variance or the uncertainty of the outputs of the ANNs were calculated using the Bayesian approach of conditional probability by estimating the variance of the weights of the various nodes corresponding to the most probable weight distribution (MacKay 1992; Chua & Goh 2003; Strijov & Weber 2010). A detailed description of the theory for the construction of the ANN models, the computer code used, a user’s manual for the ANN model and the datasets used for the training and testing of the ANN models are available for download Proc. R. Soc. A (2012)
Downloaded from rspa.royalsocietypublishing.org on October 1, 2012
3559
Maps for friction stir welding
Table 3. Levels of the six input variables used for training and testing of the ANN models for FSW of AA7075.
shoulder radius (cm)
pin radius (cm)
pin length (cm)
weld velocity (cm s−1 )
rotational speed (rpm)
axial pressure (MPa)
levels for training (L50 )
0.75 1.00 1.25 1.50 1.75
0.200 0.225 0.250 0.275 0.300
0.27 0.35 0.43 0.55 0.93
0.1 0.2 0.3 0.4 0.5
300 420 570 750 900
18 20 22 25 27
levels for training (CCD)
0.75 0.99 1.1 1.26 1.5
0.25 0.28 0.3 0.32 0.35
0.27 0.41 0.5 0.56 0.7
0.1 0.23 0.3 0.37 0.5
300 494 600 706 900
18 22.53 25 27.47 32
levels for testing (L50 )
0.9 1.1 1.3 1.4 1.6
0.21 0.24 0.26 0.27 0.29
0.306 0.387 0.468 0.513 0.594
0.15 0.25 0.33 0.36 0.45
360 480 630 680 820
19 21 23 24 26
input variable
from the following three web sites: http://www.me.iitb.ac.in/∼amit/ANN; http://www.matse.psu.edu/modeling/ANN; http://www.msm.cam.ac.uk/phase trans/2012/ANN.
(iii) Construction of the tool durability maps On the basis of bending stress and fatigue calculations, it will be subsequently shown in this paper that fatigue is unlikely to be the mechanism of failure of FSW tools for the welding of thin plates of AA7075. In many cases, the tool failure is believed to occur by shear. The tool durability index is defined as the ratio of the shear strength of the tool material and the maximum shear stress on the tool pin. The peak temperature is used to calculate the temperature-dependent shear strength of the tool materials for a given set of welding parameters. These values of tool durability index are then plotted in the form of contours so that the effects of tool rotation speed, welding velocity, axial pressure, tool shoulder radius, tool pin radius and tool pin length on the tool durability index can be easily determined.
(iv) Model validation It is important to be able to reproduce the large volume of data used to construct the tool durability maps and assess their errors. These data are generated from the ANN models. A comprehensive documentation of these models, the data used for their training and testing and the procedure for the estimation of errors involved in the ANN calculations are available in the websites indicated in a previous section of this paper. The access to and the documentation of these ANN models are intended to allow interested users to Proc. R. Soc. A (2012)
Downloaded from rspa.royalsocietypublishing.org on October 1, 2012
3560
T. DebRoy et al.
reproduce the results reported in this paper and to estimate the errors in the results reported here. The training and testing data for the ANN models were obtained from a well-tested heat and materials flow model of FSW available in the literature (Nandan et al. 2006a,b, 2007, 2008; Mehta et al. 2011; Arora et al. 2009, 2011, 2012) although equations (2.5)–(2.9), which deal with the normal and shear stresses felt by the rotating and translating tool, have not previously been used to calculate tool durability maps. The heat and material transport model, used in the work, has been able to correctly predict the available experimentally determined results of thermal cycles (Nandan et al. 2006a,b, 2007, 2008), torque (Mehta et al. 2011; Arora et al. 2009, 2011, 2012) and traverse force (Arora et al. 2009, 2012) for the welding of AAs (Nandan et al. 2006a; Arora et al. 2009, 2011, 2012; Mehta et al. 2011), steels (Nandan et al. 2006a, 2007) and a titanium alloy (Nandan et al. 2008). Since extensive evidence of the model validation is available in the literature, this is not reproduced here to avoid repetition. Because of the large number of welding variables involved, it is very difficult to determine experimentally the degradation/failure of the tools for the variety of welding conditions reported here. However, it will be reported later that 3.55-mmthick AA7075 plates were welded under 20 different combinations of different tool shoulder diameter and tool revolutions per minute (rpm) for various lengths of welds each amounting to about 2000 mm total length for each rpm and shoulder diameter combination. The tools were examined after the testing for any sign of wear or damage. These tests, although laborious and resource-intensive, do not span the entire range of parameter space covered by the tool durability maps. Currently, there is a dearth of data and theory to help practising engineers select welding conditions to enhance tool durability. This paper is the very first attempt to provide both a new methodology and an extensive roadmap to enhance tool durability with full reproducibility of the results and adequate validation of the foundational data to the extent practical. More extensive validation of the maps is indeed very desirable through their extensive practical use.
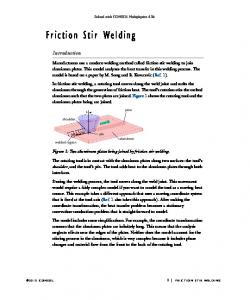
3. Results and discussions (a) Fatigue as a potential failure mechanism The initial crack size in tool steel is considered to be equal to the largest dimension of the carbide precipitates in the tool, which is typically in the 0–25 mm range. The range of the bending stress varies depending on the welding conditions but a range of 0–1500 MPa adequately covers most welding conditions. The maximum bending stress considered is therefore 750 MPa without considering any stress concentration factor which is typically about two. This value of bending stress is somewhat higher than those calculated for 7-mm-thick plates. Figure 2 shows the computed number of cycles required for failure for various values of bending stress and initial flaw size. The results show that for a bending stress of up to 350 MPa, and for the entire flaw size range, the tool should endure at least 10 million cycles before fatigue failure. At a welding speed of 0.5 cm s−1 and tool rpm of 600, a tool should be able to weld about 5 km of the alloy before failure. For a conservative estimate of tool life, if the bending stress is about 1200 MPa and the Proc. R. Soc. A (2012)
Downloaded from rspa.royalsocietypublishing.org on October 1, 2012
3561
Maps for friction stir welding 1500 1×10⁵
bending stress (MPa)
1200 1×10⁶ 900
600
1×10⁷
300 1×10⁸
1×10⁹ 0
5
10 15 initial flaw size (µm)
20
25
Figure 2. The calculated number of cycles for failure of the steel tool for a toughness of 40 MPa m1/2 . The contour values represent the number of cycles to failure.
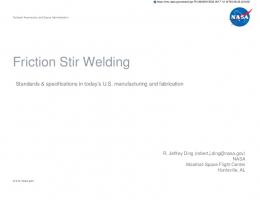
initial flaw size is about 15 mm, the tool will endure 1.5 × 10⁵ cycles before fatigue failure. In other words, the tool will be able to weld 75 m long joints at a welding velocity of 0.5 cm s−1 and tool rpm of 600 before fatigue failure. The bending stress experienced by the tool pin can be well above 1000 MPa during FSW of AA7075 plates thicker than 12.5 mm. For such high bending stress values, fatigue is likely to be the competitive mechanism of tool failure because the number of cycles to failure will be less than 3 × 10⁵ for a tool of 40 MPa m1/2 toughness as shown in figure 2. Because the fracture toughness data at high temperatures are not accurately known, an assessment of the sensitivity of the computed number of cycles to failure on the toughness value is necessary. The number of cycles to failure is presented in figure 3 for a low value of toughness of the tool material, 5 MPa m1/2 . Figure 3 shows that up to a bending stress of 300 MPa, failure does not occur until about 10 million cycles. In other words, it would still be possible to weld specimens adding up to 5 km long at a welding speed of 0.5 cm s−1 and rotational speed of 600 rpm before the tool fails by fatigue. However, for a bending stress of 600 MPa and an initial flaw size of 15 mm, the tool will endure only 5000 cycles before fatigue failure. These calculations show that fatigue failure in FSW tools is highly unlikely for thin plates of AA7075. The fatigue becomes an important mechanism of failure at high bending stress values that are expected for the FSW of thick plates of hard alloys.
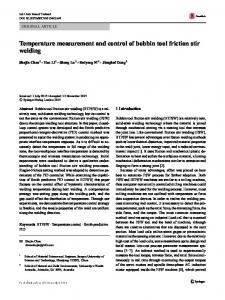
(i) Peak temperature The computed peak temperatures for various values of welding variables are shown in figure 4a–d for FSW of AA7075. All results show that a larger tool Proc. R. Soc. A (2012)
Downloaded from rspa.royalsocietypublishing.org on October 1, 2012
3562
T. DebRoy et al. 1500
3
0 1×1
5
900
10 1×
bending stress (MPa)
1200
600 1×10⁶ 1×10⁷
300
1×10⁸ 1×10⁹ 0
5
10
15
20
25
initial flaw size (µm) Figure 3. The calculated number of cycles for failure of the steel tool for a toughness of 5 MPa m1/2 . The contour values represent the number of cycles to failure.
shoulder radius results in higher peak temperatures for a given tool rotational speed, because the larger radius results in an increased heat-generation rate at the interface between the tool shoulder and the workpiece. Similarly, for a constant tool shoulder radius, an increase in tool rotational speed also results in a higher peak temperature because of faster heat-generation rate. Sato et al. (2002) reported that the measured values of peak temperatures increase continuously with tool rotational speed for the FSW of AA6063. The trend of peak temperature obtained from the ANN model is the same as that reported by Sato et al. (2002), although their experiments were done with a different alloy. The plots in figure 4a show that an increase in tool pin length or plate thickness results in lower peak temperature. This is because the slight increase in the heatgeneration rate due to an increased pin surface area does not keep pace with the larger mass of the material that needs to be heated. The effect of welding speed on the peak temperature can be observed by comparing the results in figure 4b. As expected, faster welding speed results in the reduction of both the heat input per unit length and peak temperature. However, the effect of welding speed on the peak temperature, in particular at larger shoulder diameter and higher rotational speed, is noticeably milder within the range of welding conditions considered in the present calculations. Figure 4c shows that an increase in the axial pressure results in a higher peak temperature due to faster frictional heat-generation rate. Figure 4d shows that the computed peak temperature increases slightly with an increase in pin radius. The solid and dashed lines represent lower and higher radii, respectively. For larger diameter pins, the higher surface area at the tool-workpiece interface results in a higher heat-generation rate and a higher peak temperature. Proc. R. Soc. A (2012)
Downloaded from rspa.royalsocietypublishing.org on October 1, 2012
3563
Maps for friction stir welding 900
720 720
rotational speed (rpm)
735
640 600 600 580
600
680
640
600 570
400
680
715
600 500
640
735
640
700
735
680
680
800
(b)
720
(a)
300 900
(d)
735
640
735
735
735
600
720
680
640
600
680
640
400
600
720
500 600 600
rotational speed (rpm)
680
720
640
700
680
800
720
(c)
300 0.75
0.95 1.15 1.35 1.55 shoulder radius (cm)
1.75
0.75 0.95 1.15 1.35 1.55 1.75 shoulder radius (cm)
Figure 4. Peak temperature (K) contours computed using the ANN model for the FSW of AA7075 as function of tool shoulder radius and tool rotational speed for various welding variables listed in table 4. (a) The effect of plate thickness (or pin length): weld no. 1, solid lines, thinner plate and no. 2 dashed lines, thicker plate. (b) The effect of welding speed: weld no. 1, solid lines, lower speed and no. 3, dashed lines, higher speed. (c) The effect of applied pressure: weld no. 1, solid lines, lower pressure and no. 4, dashed lines, higher pressure. (d) The effect of pin radius: weld no. 1, solid lines, thinner pin and no. 5, dashed lines, thicker pin.
(ii) Bending stress The computed values of the bending stress calculated from equation (2.5) are plotted in figure 5 for various values of welding variables shown in table 4. All the plots show that a larger tool shoulder radius results in a lower bending stress for a constant tool rotational speed. The larger shoulder radius results in faster heat-generation rates, higher workpiece temperatures and lower stresses. For a given tool shoulder radius, the bending stress decreases with an increase in tool rotational speed. The higher tool rotational speed also results in more rapid heat-generation rates, higher temperatures and lower bending stresses. A comparison of the solid and the dashed lines in figure 5a shows that tools with longer pins (used for thicker plates) endure higher bending stress. Thicker plates increase the force on the tool pin and result in a higher bending stress. The higher welding velocity slightly increases the bending stress on the tool Proc. R. Soc. A (2012)
Downloaded from rspa.royalsocietypublishing.org on October 1, 2012
3564 (a)
T. DebRoy et al. 900
80
50
100
50
40
60
0
80
28
150
110
0
0 31
400
40
24
60
80
600 500
(b)
160
700
100
rotational speed (rpm)
800
60
0
50
20
300 900
(d)
40
30
100
100 0.75
50
60
400 300
40
100
50
500
40
600
50
80
700
20
60
60
80
40
50
60
800
80
rotational speed (rpm)
(c)
0.95 1.15 1.35 1.55 shoulder radius (cm)
1.75
0.75 0.95 1.15 1.35 1.55 1.75 shoulder radius (cm)
Figure 5. Bending stress (MPa) contours computed using the ANN model for the FSW of AA7075 as function of tool shoulder radius and tool rotational speed for various welding variables listed in table 4. (a) The effect of plate thickness (or pin length): weld no. 1, solid lines, thinner plate and no. 2 dashed lines, thicker plate. (b) The effect of welding speed: weld no. 1, solid lines, lower speed and no. 3, dashed lines, higher speed. (c) The effect of applied pressure: weld no. 1, solid lines, lower pressure and no. 4, dashed lines, higher pressure. (d) The effect of pin radius: weld no. 1, solid lines, thinner pin and no. 5, dashed lines, thicker pin. Table 4. Variables considered for various runs.
case
pin radius (mm)
pin length (mm)
welding velocity (mm s−1 )
pressure (MPa)
1 2 3 4 5
2.0 2.0 2.0 2.0 2.9
2.7 5.5 2.7 2.7 2.7
1.0 1.0 4.5 1.0 1.0
18 18 18 25 18
pin as shown in figure 5b. The higher welding velocity reduces the heat input per unit length and results in lower workpiece temperatures and higher bending stresses. A comparison of the solid and the dashed lines in figure 5c shows that Proc. R. Soc. A (2012)
Downloaded from rspa.royalsocietypublishing.org on October 1, 2012
3565
Maps for friction stir welding (b)
75
15 0
300
65 75
100
200
75
165
250
200
400
100
500
150
rotational speed (rpm)
65
700 600
85
115
250
800
125
900
175
(a)
300 65
100
65
0
20
65 75
100
150
500
200
600
65
700
75
100
800 150
75
0
15
100
400
150
200
rotational speed (rpm)
(d )
900
75
(c)
300 0.75
0.95 1.15 1.35 1.55 shoulder radius (cm)
1.75
0.75 0.95 1.15 1.35 1.55 1.75 shoulder radius (cm)
Figure 6. Maximum shear stress (MPa) contours computed using the ANN model for the FSW of AA7075 as function of tool shoulder radius and tool rotational speed for various welding variables listed in table 4. (a) The effect of plate thickness (or pin length): weld no. 1, solid lines, thinner plate and no. 2 dashed lines, thicker plate. (b) The effect of welding speed: weld no. 1, solid lines, lower speed and no. 3, dashed lines, higher speed. (c) The effect of applied pressure: weld no. 1, solid lines, lower pressure and no. 4, dashed lines, higher pressure. (d) The effect of pin radius: weld no. 1, solid lines, thinner pin and no. 5, dashed lines, thicker pin.
the predicted values of bending stress decreases slightly as the axial pressure increases. As expected, an increase in axial pressure results in a higher frictional heat-generation rate, higher temperatures and lower forces on the tool pin. The effect of pin radius is observed by comparing the results shown by the solid and dashed lines in figure 5d. A thicker pin experiences lower bending stress when all other variables are kept constant because of the effect of geometry on bending stress as indicated in equation (2.5). The bending stress values in figure 5 provide the magnitude of the cyclic loads for fatigue calculations in figures 2 and 3.
(iii) Maximum shear stress Figure 6 shows the values of maximum shear stress computed using equation (2.9) following Tresca’s criteria as a function of the tool rotational speed and tool shoulder radius for various welding variables. The values of the Proc. R. Soc. A (2012)
Downloaded from rspa.royalsocietypublishing.org on October 1, 2012
3566
T. DebRoy et al.
welding variables are shown in table 4. The effects of tool shoulder radius and tool rotational speed can be seen from all the plots in this figure, considering their effects on the heat-generation rate and the resulting weld metal temperature. For example, at a constant tool rotational speed, an increase in the tool shoulder radius results in a faster heat-generation rate, higher temperature and lower maximum shear stress. Similarly, for a given tool shoulder radius, the maximum shear stress decreases with an increase in tool rotational speed due to higher temperature and a more rapid heat-generation rate. A comparison of the solid and the dashed lines in figure 6a shows that an increase in pin length (or plate thickness) increases the computed value of the maximum shear stress when all other welding variables are kept constant. The longer pins endure larger stresses and thus experience higher maximum shear stress. The effect of welding velocity on the maximum shear stress can be observed from two types of lines in figure 6b. For a given tool shoulder radius and tool rotational speed, higher welding speed results in lower heat input per unit length, lower temperatures and higher stresses on the tool pin. A comparison of the solid and the dashed lines in figure 6c shows that an increase in axial pressure results in a slight decrease in the predicted values of maximum shear stress on the tool pin. Higher axial pressure results in a higher frictional heat-generation rate, higher temperatures and reduced stresses on the tool pin. A comparison of the solid and the dashed lines in figure 6d shows that the increase in pin radius decreases the maximum shear stress on the pin for any selected combination of tool shoulder radius and tool rotational speed, mainly because of the reduction in bending and shear stress components with an increase in pin diameter as indicated in equations (2.5), (2.6) and (2.8).
(iv) Tool durability index The shear strength of the tool material commonly used for FSW of AAs, H13 tool steel, is shown as a function of temperature in figure 7. The peak temperature for FSW of AA7075 alloy lies below 750 K; so the shear strength of the tool material does not decrease below 500 MPa. The calculated values of the tool durability index, which is defined as the ratio of the strength of the tool material and the maximum shear stress on the tool, are plotted for FSW of AA7075 in figure 8a–d. The values of the various welding variables are presented in table 4. As shown, the tool durability increases with an increase in the tool shoulder radius. A larger tool shoulder radius results in a higher temperature thus lower stresses on the tool pin resulting in a higher value of tool durability index. However, the increase in the shoulder diameter beyond a certain value results in the loss of the shoulder’s grip on the plasticized workpiece material. Therefore, appropriate care needs to be taken in the selection of shoulder diameter to avoid weld defects. With an increase in tool rotational speed, the tool durability index increases. An increase in the tool rotational speed also increases the workpiece temperature and thus decreases the stresses on the tool pin resulting in higher values of the durability index. A comparison of the solid and the dashed lines in figure 8a shows that the tool durability index decreases with an increase in pin length. The stresses on the tool increase with an increasing pin length (plate thickness) as the longer tool pin faces cooler and stronger material farther away from the tool shoulder. Proc. R. Soc. A (2012)
Downloaded from rspa.royalsocietypublishing.org on October 1, 2012
3567
Maps for friction stir welding
shear strength (MPa)
600
500
400
300
700
750 800 temperature (K)
850
Figure 7. The temperature-dependent shear strength of the H13 tool steel (Brandes & Brook 1992).
As a result, the tool durability index decreases with an increase in pin length. A comparison of the two types of lines in figure 8b shows that the tool durability index decreases with an increasing welding speed. This behaviour is consistent with the increase in the maximum shear stress on the tool pin at higher welding speeds discussed earlier. A comparison of the solid and the dashed lines in figure 8c shows that the tool durability index increases with axial pressure. Higher pressure increases heatgeneration rate as well as temperature, and decreases stresses on the tool pin. A comparison of the solid and the dashed lines in figure 8d shows the effect of increase in tool pin radius while all other welding variables are kept constant. As the radius of the tool pin increases, the stresses decrease and the tool durability index increases. The increase is consistent with a reduction in the maximum shear stress on the pin with an increase in the pin radius. This figure also shows several successful FSW experiments in the form of discrete points on the graph. During these experiments, the tool was used to weld 3.55-mm-thick AA7075 plates for the welding conditions in weld no. 1 in table 4. The tool used in these experiments successfully welded approximately 2000 mm length of workpiece material without visible signs of wear or damage on the tool. The points in figure 8d show that the FSW tool showed no sign of damage when the tool durability index was at least 4. The maps may be used to understand the effects of various variables such as the plate thickness, welding speed, tool rotational speed, shoulder radius, applied pressure and pin radius on the tool durability index for the specific workpiece and tool material indicated in this paper. Similar maps can be generated for other workpiece and tool material combinations. In all situations where the tool durability index is low, it would be worthwhile to water cool the tool or use tools with a higher shear strength. Finally, the calculations presented here do not take into account vibrations of the tools, bearings and workpieces. Tool failures due to vibrations remain an important concern, especially at the initiation of welding. Proc. R. Soc. A (2012)
Downloaded from rspa.royalsocietypublishing.org on October 1, 2012
3568
T. DebRoy et al. (a) 900
(b) 2.5
rotational speed (rpm)
800
3.5 4.5
700 4
600
5
4
9
7
5
7
9 9
500
1.5
400
7
5
4
3
300
rotational speed (rpm)
(c) 900
(d)
7
9
11
13
800 700 4
600
5
300
4
5
7
9
7
500 400
11
9
4
5
7
9
5
3
0.75
0.95 1.15 1.35 1.55 shoulder radius (cm)
1.75
0.75 0.95 1.15 1.35 1.55 1.75 shoulder radius (cm)
Figure 8. Tool durability index contours computed using the ANN model for the FSW of AA7075 as function of tool shoulder radius and tool rotational speed for various welding variables listed in table 4. (a) The effect of plate thickness (or pin length): weld no. 1, solid lines, thinner plate and no. 2 dashed lines, thicker plate. (b) The effect of welding speed: weld no. 1, solid lines, lower speed and no. 3, dashed lines, higher speed. (c) The effect of applied pressure: weld no. 1, solid lines, lower pressure and no. 4, dashed lines, higher pressure. (d) The effect of pin radius: weld no. 1, solid lines, thinner pin and no. 5, dashed lines, thicker pin.
4. Summary and conclusions During FSW of AA7075, fatigue is unlikely to be the mechanism of tool failure except for welding of 8 mm or thicker plates. Although the toughness of the tools varies, uncertainty in the toughness values does not change this finding. Bending stress, which affects the fatigue life of the tools, increases significantly with plate thickness, and somewhat less significantly with the reduction in tool shoulder radius and decrease in tool rotational speed. Computed values of peak temperature and the maximum shear stress, obtained from ANN models trained with results from a well-tested three-dimensional heat and materials flow model, were used to generate a series of maps aimed at enhancing tool durability against mechanical erosion ignoring chemical erosion. These maps examine the effects of welding velocity, tool rotational speed, tool shoulder radius, tool pin radius, pin length (or plate thickness) and axial pressure Proc. R. Soc. A (2012)
Downloaded from rspa.royalsocietypublishing.org on October 1, 2012
Maps for friction stir welding
3569
from a series of maps of an index of tool durability that is defined as the ratio of the tool shear strength to the maximum shear stress on the tool pin. An increase in tool pin radius results in a higher peak temperature and lower maximum shear and bending stresses and a higher index of tool durability. Butt welding of thicker plates (with longer pins) leads to lower peak temperature, higher shear and bending stresses and considerably lower index of tool durability. Faster welding speed has similar effect as welding thicker plates, however, to a lesser extent for the welding conditions considered in the present work. An increase in axial pressure results in a higher peak temperature, lower shear and bending stresses and a higher index of tool durability. An increase in either the tool shoulder diameter or the tool rotational speed reduces the maximum shear stress and improves tool durability. Professors Bhadeshia and DebRoy wish to thank Dr Richard Dolby, Professor Mahdi Mahfouf and Dr George Panoutsos for helpful discussions. Professors Bhadeshia and DebRoy acknowledge the award of a Distinguished Visiting Fellowship to the latter from the Royal Academy of Engineering, UK.
References Arora, A., Nandan, R., Reynolds, A. P. & DebRoy, T. 2009 Torque, power requirement and stir zone geometry in friction stir welding through modelling and experiments. Scr. Mater. 60, 13–16. (doi:10.1016/j.scriptamat.2008.08.015) Arora, A., DebRoy, T. & Bhadeshia, H. K. D. H. 2011 Back-of-the-envelope calculations in friction stir welding: velocities, peak temperature, torque and hardness. Acta Mater. 59, 2020–2028. (doi:10.1016/j.actamat.2010.12.001) Arora, A., Mehta, M., De, A. & DebRoy, T. 2012 Load bearing capacity of tool pin during friction stir welding. Int. J. Adv. Manuf. Technol. (doi:10.1007/s00170-011-3759-7) Atharifar, H. 2010 Optimum parameters design for friction stir welding using a genetically optimized neural network system. Proc. Inst. Mech. Eng. B 224, 403–418. (doi:10.1243/ 09544054JEM1467) Bhadeshia, H. K. D. H. & DebRoy, T. 2009 Critical assessment: friction stir welding of steels. Sci. Technol. Welding Joining 14, 193–196. (doi:10.1179/136217109X421300) Brandes, E. A. & Brook, G. B. (eds) 1992 Smithells metals reference book, 7th edn, pp. 8–51. Woburn, MA: Butterworth Heinemann. Chua, C. G. & Goh, A. T. C. 2003 A hybrid Bayesian back-propagation neural network approach to multivariate modelling. Int. J. Numer. Anal. Methods Geomech. 27, 651–667. (doi:10.1002/ nag.291) Colegrove, P. A. & Shercliff, H. R. 2004 Development of Trivex friction stir welding tool Part 2- two-dimensional flow modelling. Sci. Technol. Welding Joining 9, 352–361. (doi:10.1179/ 136217104225021661) Colegrove, P. A. & Shercliff, H. R. 2005 3-dimensional CFD modelling of flow round a threaded friction stir welding tool profile. J. Mater. Process. Technol. 169, 320–327. (doi:10.1016/j. jmatprotec.2005.03.015) Colegrove, P. A. & Shercliff, H. R. 2006 CFD modelling of friction stir welding of thick plate 7449 aluminium alloy. Science Technol. Welding Joining 11, 429–441. (doi:10.1179/ 174329306X107700) Fleming, P. A., Lammlein, D. H., Wilkes, D. M., Cook, G. E., Strauss, A. M., DeLapp, D. R. & Hartman, D. A. 2009 Misalignment detection and enabling of seam tracking for friction stir welding. Sci. Technol. Welding Joining 14, 93–96. (doi:10.1179/136217108X372568) Fratini, L. & Buffa, G. 2007 Continuous dynamic recrystallisation phenomena modelling in friction stir welding of aluminium alloys: a neural-network-based approach. Proc. Inst. Mech. Eng. B 221, 857–864. (doi:10.1243/09544054JEM674) Proc. R. Soc. A (2012)
Downloaded from rspa.royalsocietypublishing.org on October 1, 2012
3570
T. DebRoy et al.
Fratini, L. & Buffa, G. 2008 Metallurgical phenomena modelling in friction stir welding of aluminium alloys: analytical versus neural network based approaches. J. Eng. Mater. Technol. 130, 031001. (doi:10.1115/1.2931142) Fratini, L., Buffa, G. & Palmeri, D. 2009 Using a neural network for predicting the average grain size in friction stir welding processes. Comput. Struct. 87, 1166–1174. (doi:10.1016/j. compstruc.2009.04.008) Knott, J. F. & Withey, P. A. 1993 Fracture mechanics: worked examples. London, UK: Maney Publishing. Kumar, A. & DebRoy, T. 2007 Tailoring fillet weld geometry using a genetic algorithm and a neural network trained with convective heat flow calculations. Welding J. 86, S26–S33. Lee, C. Y., Choi, D. H., Yeon, Y. M. & Jung, S. B. 2009 Dissimilar friction stir spot welding of low carbon steel and Mg alloy by formation of IMCs. Sci. Technol. Welding Joining 14, 216–220. (doi:10.1179/136217109X400439) MacKay, D. J. C. 1992 Bayesian interpolation. Neural Comput. 4, 415–447. (doi:10.1162/neco. 1992.4.3.415) Mehta, M., Arora, A., De, A. & DebRoy, T. 2011 Tool geometry for friction stir welding – optimum shoulder diameter. Metall. Mater. Trans. A 42, 2716–2722. (doi:10.1007/s11661-011-0672-5) Mishra, S. & DebRoy, T. 2007 Tailoring gas tungsten arc weld geometry using a genetic algorithm and a neural network trained with convective heat flow calculations. Mater. Sci. Eng. 454, 477–486. (doi:10.1016/j.msea.2006.11.149) Montgomery, D. C. 2004 Design and analysis of experiments, 7th edn. London, UK: John Wiley & Sons Inc. Nandan, R., Roy, G. G. & DebRoy, T. 2006a Numerical simulation of three dimensional heat transfer and plastic flow during friction stir welding of aluminium alloys. Metall. Mater. Trans. A 37, 1247–1259. (doi:10.1007/s11661-006-1076-9) Nandan, R. Roy, G. G. Lienert, T. J. & DebRoy, T. 2006b Numerical modelling of 3D plastic flow and heat transfer during friction stir welding of stainless steel. Sci. Technol. Welding Joining 11, 526–537. (doi:10.1179/174329306X107692) Nandan, R., Roy, G. G., Lienert, T. J. & DebRoy, T. 2007 Three dimensional heat and material flow during friction stir welding of mild steel. Acta Mater. 55, 883–895. (doi:10.1016/j.actamat. 2006.09.009) Nandan, R., Lienert, T. J. & DebRoy, T. 2008 Toward reliable calculations of heat and plastic flow during friction stir welding of Ti-6Al-4V alloy. Int. J. Mater. Res. 99, 434–444. (doi:10.3139/146.101655) Okuyucu, H. Kurt, A. & Arcaklioglu, E. 2007 Artificial neural network application to the friction stir welding of aluminium plates. Mater. Des. 28, 78–84. (doi:10.1016/j.matdes.2005.06.003) Popov, E. P. 2003 Engineering mechanics of solids, 2nd edn. Upper Saddle River, NJ: Pearson Education. Rai, R., De, A., Bhadeshia, H. K. D. H. & DebRoy, T. 2011 Tools for friction stir welding. Sci. Technol. Welding Joining 16, 325–342. (doi:10.1179/1362171811Y.0000000023) Sato, Y. S. Urata, M. & Kokawa, H. 2002 Parameters controlling microstructure and hardness during friction-stir welding of precipitation-hardenable aluminium alloy 6063. Metall. Mater. Trans. A 33, 625–635. (doi:10.1007/s11661-002-0124-3) Sessler, J. G. & Weiss, V. 1963 Aerospace structural metals handbook, vol. II, p. 3207. New York, NY: Syracuse University Press. Sorensen, C. D. & Stahl, A. L. 2007 Experimental measurements and load distributions on friction stir weld pin tools. Metall. Mater. Trans. B 38, 451–459. (doi:10.1007/s11663-007-9041-6) Strijov, V. & Weber, G. W. 2010 Nonlinear regression model generation using hyperparameter optimization. Comput. Math. Appl. 60, 981–988. (doi:10.1016/j.camwa.2010.03.021) Taguchi, G. 1987 System of experimental design. White Plains, NY: Kraus. Tansel, I. N., Demetgul, M., Okuyucu, H. & Yapici, A. 2010 Optimizations of friction stir welding of aluminium alloy by using genetically optimized neural network. Int. J. Adv. Manuf. Technol. 48, 95–101. (doi:10.1007/s00170-009-2266-6) Thompson, B. & Babu, S. S. 2010 Tool degradation characterisation in the friction stir welding of hard metals. Welding J. 89, 256–261. Proc. R. Soc. A (2012)