damages on machined components. Therefore, there is a need to develop tool wear condition monitoring systems, which alert the operator to the level of tool.
Proceedings of the 7th WSEAS International Conference on Wavelet Analysis & Multirate Systems, Arcachon, France, October 13-15, 2007
Tool Life Monitoring using Coefficient of Integrated Kurtosis-based Algorithm for Z-filter (I-kaz) Technique M. Z. NUAWI, M. J. M. NOR, F. LAMIN, S. ABDULLAH, C. K. E. NIZWAN Department of Mechanical and Materials Engineering Universiti Kebangsaan Malaysia 43600, Bangi, Selangor, Malaysia zaki@en http://www.eng.ukm.my Abstract: - This paper presents a new statistical-based method of tool life monitoring for turning process, called Integrated Kurtosis-based Algorithm for Z-filter Technique, I-kaz, which was based on statistical analysis. The I-kaz method calculates the related coefficient for the measured machining signals. The input data of the I-kaz was acoustic signal that was generated during machining process, which was in the ultrasonic frequency range. Ultrasonic signal was measured as a tool of sensing element to study the flank wear on the cutting tool edge. The flank wear progression was monitored by the value of the I-kaz coefficient for a test sample. The resulting trend of I-kaz coefficient on the flank wear rate was effective that could help to predict tool life. Key-Words: - flank wear, I-kaz, machining condition monitoring, tool life, turning, ultrasonic.
1 Introduction Tool wear is a complex phenomenon occurs in different and varied ways for the metal cutting processes [1]. Generally, worn tools adversely affect the surface finish of the work piece. By continuous operation, the worn tools may fail due to the plastic deformation, mechanical breakage, cutting edge blunting, and tool brittle fracture or due to the rise in the interface temperatures. Maintaining acceptable flank wear, below the rejection criterion, is very essential to avoid excessive surface and sub-surface damages on machined components. Therefore, there is a need to develop tool wear condition monitoring systems, which alert the operator to the level of tool condition, thereby avoiding undesirable consequences [2]. Various methods for tool wear monitoring have been proposed [3-6] in the past, even though none of these methods was universally successful due to the complex nature of the machining processes. Direct measurement of tool wear using optical methods can only be applied when cutting tools are not in contact with the work piece [3]. Meanwhile, the performance of monitoring systems based on cutting force and acoustic emission are still far behind expectations, which the primary reason being its high cost and low performance ratio [4]. In order to overcome these disadvantages, ultrasound based technique was developed to monitor the tool wear condition.
In scientific visualisation, sound can be used to characterize objects’ attributes and emphasize timing of events [7]. Sound is a one-dimensional signal that can be represented as an intensity regularly sampled in time. Increasingly, facilities professionals are using ultrasonic technology in conjunction with other inspection tools. This method allows for thorough inspection of all equipment without interruption of service. The major advantage of using ultrasonic signal to monitor tool condition is that ultrasound wave is directional [8]. Ultrasound travels in a straight line and this is such a special behaviour of ultrasound signal. Besides, ultrasound provides early warning of impending mechanical failure. According to NASA research, ultrasonic bearing monitoring can warn of wear and imminent failure before the condition can be predicted from changes in vibration or temperature [8]. Furthermore, they are ideal for use in loud and noisy environment too. As the CNC machine and its environment are noisy, the frequency range of the measured signal is much higher than that of the machine vibrations and background noise. Most of the noise component does not interfere with the cutting operation. Therefore, ultrasound instrument support and enhance other predictive maintenance technologies, such as vibration analysis. Realising the advantages of ultrasound-based technique, it led to the development of an ultrasonic-
142
Proceedings of the 7th WSEAS International Conference on Wavelet Analysis & Multirate Systems, Arcachon, France, October 13-15, 2007
based tool wear monitoring method. As machining operation emit consistent sound patterns under normal operation, the method was designed to identify the tool wear patterns. These patterns can be defined and recognized; and changes in these patterns can be identified as tool begins to wear or deteriorate. This paper presents a new techinque of ultrasound-based tool wear monitoring method for turning of Aluminium alloy by considering the wear rate effect at various cutting parameter.
domain signal is decomposed into three frequency bands, which are; x-axis, which is low frequency (LF) range of 10-20 kHz, y-axis which is high frequency (HF) range of 20-50 kHz and z-axis, which is very high frequency (VF) range of 50-100 kHz. In order to measure the scatter of data distribution, the I-kaz coefficient calculates the distance of each data point from signal centroid [9]. I-kaz coefficient is defined as: I − kaz =
( )
(
)
(
1 1 1 M 4L + M 4H + M 4V N N N
)
(3)
2 Literature Background where N is the number of data and M4 are the 4th order moment of signal in LF, HF and VF range respectively.
2.1 Signal Analysis A measured signal is commonly consist of variation of amplitude, frequency, phase and energy. Signals can be divided into two main categories which are deterministic and nondeterministic. A deterministic signal can be described by a mathematical relationship between the value of the function and time. Many signals in nature exhibit random or nondeterministic characteristics which provide a challenge to analysis using signal processing techniques. In order to classify the random signals, the r-th order of moment Mr is frequently used. The r-th order of moment, Mr for the discrete signal in the frequency band can be writen as:
Mr =
1 N
∑ (x n
i =1
i
−x
)
r
(1)
where N is the number of data and r is the order of moment. Kurtosis, which is the signal 4th statistical moment, is a global signal statistic which is highly sensitive to the spikiness of the data. For discrete data sets the kurtosis value is defined as:
K=
1 nσ 4
4
n
∑ (x i =1
i
− x)
(2)
The kurtosis value is approximately 3.0 for a Gaussian distribution. Higher kurtosis values indicate the presence of more extreme values than should be found in a Gaussian distribution. Kurtosis is used in engineering for detection of fault symptoms because of its sensitivity to high amplitude events. Based on kurtosis, I-kaz method [9] provides a three dimensional graphical representation of the measured signal frequency distribution. The time
2.2
Cutting Tool Flank Wear
Cutting tools are subjected to an extremely severe rubbing process. They are in metal-to-metal contact between the chip and workpiece, under conditions of very high stress at high temperature. The situation is further aggravated due to the existence of extreme stress and temperature gradients near the surface of the tool. During machining, cutting tools remove material from the component to achieve the required shape, dimension and surface roughness. However, wear occurs during the cutting action, and it resulted in the failure of the cutting tool. When the tool wear reaches a certain extent, the tool or active edge has to be replaced to obtain the desired cutting action. The high contact stress between the tool rakeface and the chip causes severe friction at the rake face, as well as friction between the flank and the machined surface. The result is a variety of wear patterns and scars, which can be observed at the rake face and the flank face. Crater wear, flank wear, notch wear, chipping and ultimate failure are the wear patterns that may occur at the tool edge during machining process. In machining, two wear modes most frequently discussed are flank wear and crater wear. Flank wear receives much more attention because it is easier to measure and the mechanism of the material loss is though to be better understood for most machining situations [10]. Wear on the flank or relief face is called flank wear and results in the formation of a wear land. Wear land formation is not always uniform along the major and minor cutting edges of the tool. Flank wear most commonly results from abrasive wear of the cutting edge against the machined surface. Flank wear can be monitored in production by examining
143
Proceedings of the 7th WSEAS International Conference on Wavelet Analysis & Multirate Systems, Arcachon, France, October 13-15, 2007
the tool or by tracking the change in size of the tool or machined part. The typical stages of tool wear in normal cutting situation consist of three stages which are an initial rapid, a relatively steady state and the final rapid stage [11]. Stage 1 is the preliminary wear region where the cutting edge is rounding. Wear is caused by micro-cracking, surface oxidation and carbon loss layer, as well as micro-roughness at the cutting tool tip in manufacturing. For the new cutting edge, the small contact area and high contact pressure will result in high wear rate. Stage 2 is the steady wear region, where the micro-roughness is improved. In this region the wear size is proportional to the cutting time. The wear rate is relatively constant. Stage 3 is severe wear region, where the ultimate or catastrophic wear occurs. When the wear size increases to a critical value, the surface roughness of the machined surface decreases, then cutting force and temperature increase rapidly, and the wear rate increases. Then the tool loses its cutting ability. In practice, this region of wear should be avoided. Flank wear and chipping will increase the friction, so that the total cutting force will increase. The component surface roughness will be increased, especially when chipping occurs. Flank wear will also affect the component dimensional accuracy and the shape of the machined component.
3 Methodology The material chosen for the test samples was titanium alloy, 6Al-4V. The main characteristics of titanium are high strength, low density and high corrosion resistance to acid, alkali and chlorine. These special characteristics of titanium made it become the first choice in various field such as chemical industry, shipping and marine applications, automotive and biomaterial. The titanium behaviours which have chemical reaction with cutting tool at tool operation temperature, a relatively low elasticity modulus and low thermal conductivity limit its machinability. Uncoated carbide, Cubic Boron Nitride (CBN/PCBN) and Poly Crystalline Diamond (PCD) can be used to cut titanium. Uncoated carbide is suitable for low speed cutting. Otherwise, CBN/PCBN is suitable for high-speed cutting [12,13]. Therefore, as low-speed cutting was carried out, uncoated carbide cutting tool, SECOVBMT160408-F2 HX was chosen and it is sufficient to do the cutting. The machining tests were carried out on a Cincinnati Milacron 200T Turning Centre machine
144
in dry condition. In general, changes in cutting speed, feed rate and depth of cut affect the signal generated during the turning process. Those parameters influence the tool wear by a large extent. Therefore, the effect of cutting speed, feed rate and depth of cut were taken into consideration in order to study the wear pattern at the different wear rate. Table 3 presents the 18 sets of cutting parameter chosen for the test samples. Table 3: Sets of test samples used. These include cutting speed, Vc, feed rate, f and depth of cut, Dc. Cutting speed, Vc(m/min) 90 90 105 105 120 120 90 90 105 105 120 120 90 90 105 105 120 120
Feed rate, F(mm/rev) 0.2 0.25 0.2 0.25 0.2 0.25 0.2 0.25 0.2 0.25 0.2 0.25 0.2 0.25 0.2 0.25 0.2 0.25
Depth of cut, Dc(mm) 0.15 0.15 0.15 0.15 0.15 0.15 0.2 0.2 0.2 0.2 0.2 0.2 0.25 0.25 0.25 0.25 0.25 0.25
No. of test sample 18 17 14 13 16 15 1 2 8 9 7 6 10 5 11 12 4 3
Data acquisition process consists of two different data collection which are generated signal and flank wear measurement on the cutting tool edge. Microphone Gras 40BE with frequency range of 10 kHz to 100 kHz was used to measure the generated signal. Once the desired signal was measured, it was transferred to digital oscilloscope Yokogawa DL1400. Meanwhile, cutting tool was dismantled from its holder after each cutting time to observe the progression of flank wear. This was done using the optical microscope Mitutoyo and the value of flank wear was recorded. The machining operation was repeated using the same set of test sample until the value of flank wear reach the acceptable flank wear value of 0.3mm. It is a standard recommended value in defining a tool life end-point criterion based on ISO 3685:1993 [14]. Signals obtained were then being analyzed by plotting the flank wear versus number of cutting
Proceedings of the 7th WSEAS International Conference on Wavelet Analysis & Multirate Systems, Arcachon, France, October 13-15, 2007
curve. The calculation of I-kaz coefficient has been done and the relation between the I-kaz coefficient, flank wear and number of cutting has been observed.
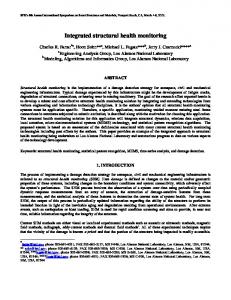
4 Result and Discussion Previous studies on uncoated and coated tools revealed that the cost of machining might be optimized using wear maps, which offered global perspectives on tool wear under different machining conditions [5]. It was shown that properly constructed wear maps enabled the judicious selection of machining conditions that would achieve an optimal balance between an acceptable rate of tool wear and material removal rate for maximum productivity. Thus, next plots were done in order to observe the trend of wear rate at the selected machining condition. Plot of I-kaz coefficient versus flank wear obtains a quadratic polynomial curve as shown in Fig. 3(a), where the I-kaz coefficient was obtained from Eq. (3). Meanwhile, flank wear versus number of cutting curve was plotted for every set of test sample. The plot result was a cubic curve as shown in Fig. 3(b). Changes on the slope explained the rate of flank wear during the machining process. This curve is dominant with typical stages of tool wear in normal cutting situation, which highlight the three stages in the escalation of wear rate; break-in period, steady state wear region and failure region [11]. At the first transition point, the build-up edge (BUE) was took place at the cutting tool edge. The flank wear value increased slowly because of the BUE formation. The BUE was grown until the wear rate escalation exceeds the second transition point, where the failure region begins. At the final rapid stage, the BUE has been removed, the cutting edge chipped and the tool should be replaced to avoid surface damage. Since the workpiece surface quality was affected by the BUE, the determination of the second transition point was essential and this can be achieved by using I-kaz coefficient analysis. As observed, the quadratic curve has a significant relation with the cubic curve for each test sample respectively. As shown in Fig. 3, A which is the maximum point of the curve can indicate the transition point of wear rate (point B) on the cubic curve. The same scenario can also be observed in other set of test samples. Fig. 4 present the same plots for set 2 of test sample.
(a)
(b)
Fig. 3: (a) I-kaz coefficient versus flank wear curve for set 10 of test sample and (b) Flank wear versus number of cutting for set 10 of test sample Based on the overall comparison, the maximum point of the quadratic curve was indicated the transition point of steady-stare wear region into failure region on the cubic curve. Thus, the critical point of wear rate can be determined and the decision of tool replacement should be done accordingly.
A
(a)
145
Proceedings of the 7th WSEAS International Conference on Wavelet Analysis & Multirate Systems, Arcachon, France, October 13-15, 2007
(b)
Fig. 4: (a) I-kaz coefficient versus flank wear curve for set 2 of test sample and (b) Flank wear versus number of cutting for set 2 of test sample
5 Conclusion This paper discussed on the tool life monitoring using I-kaz method. The resulting trend of the I-kaz coefficient analysis was efficient in determining the flank wear transition point of the failure region. For a test sample, the transition point can be monitored based on the maximum value of the I-kaz coefficient versus flank wear graph. Therefore, this method was proposed as an alternative technique for tool life prediction in machining process. By efficiently utilizing the graphical representation in a production line, an intelligent system can manage the issues concerning quality of machined product, machining parameters and tool life optimization and thus provides production guidance accordingly.
6 Acknowledgement The authors wish to express their gratitude to University Kebangsaan Malaysia and Ministry of Science, Technology and Innovation, through the fund of 03-01-02-SF0303, for supporting this reseach. References: [1] X. Li, P. K. Venuvinod, A. Djorjevich and Z. Liu, Predicting Machining Errors in Turning Using Hybrid Learning. Int J Adv Manuf Technol Vol. 18, 2001, pp. 863–872 [2] O. Garret, P. Young, K. Kevin, G. Byrne, Towards the inprovement of tool conditon monitoring systems in the manufacturing environment, Journal of Material Processing Technology. Vol. 119, 2001, pp.133-139.
[3]X. Li and Z. Yuan, Tool wear monitoring with wavelet packet transform- fuzzy clustering method, Wear, Vol.219, No.2, 1998, pp145–154. [4] J.L. Stein and K. Huh, A Design Procedure for Model-Based Monitoring Systems: Cutting Force Estimation as a Case Study, Proceedings of the Symposium on Control of Manufacturing Processes. 1991 ASME Winter Annual Meeting, Atlanta, GA. [5] S.C. Lim, C.Y.H. Lim, Effective use of coated tools - the wear-map approach. Singapore. Vol. 139, No.2-3, 2001, pp. 127-134. [6] Iwata, K. and Moriwaki, T. (1977). An application of acoustic emission to in-process sensing of tool wear. Annals of the CIRP, Vol. 26, pp 21-26. [7] NCSA Visualization Group and CERL Sound Group. Using Sound to Extract Meaning fmm Complex Data. [video] SIGGRAPH’91 Screening Room, Visualization & Technical series, 1991. [8] Alan S. Bandes, 2003. Ultrasonics: Industry’s Multipurpose Maintenance Technology, Sensor Technology and Design, UE Systems, Inc., Elmsford, NY. [9] Mohd Zaki N., Jaharah A. G. dan Mohd Jailani M. N, Determination of machine tool wear using Ikaz method. Proc. of Advanced Process and System in Manufacturing, UKM Bangi, Selangor, 2005, pp. 71-79. (In Malay) [10] Thomass R. Kurfess, George W. Woodruff. Modelling the progression of flank wear on uncoated and ceramic-coated polycrystalline Cubic Boron Nitride tools in hard turning. Jurnal of Manufacturing Science and Technology. Vol. 128, No.1, 2006, pp. 104-109. [11] C. H. Che Haron, Choon L. K., Yanuar Burhanuddin. The study of wear process on carbide cutting tool in manufacturing hardened tool steel. Proc of Advanced Process and Systems In Manufacturing, Bangi, Selangor, pp. 43-50. [12] C. H. Che Haron, A. Ginting and J. H. Goh, Tool life and surface integrity in turning titanium alloy Journal of Materials and Processing Technology, Vol. 118, 2001, pp. 231-237. [13]Ezugwu E.O., Bonney J, Yamane Y, An overview of the machinability of aeroengine alloys, Journal of Materials and Processing Technology, Vol. 134, No. 2, 2003, pp. 233-253 [14] V.A. Tipnis, M.B. Peterson, W.O. Winer, Wear Control Handbook, American Society of Mechanical Engineers, New York, 1980.
146