Available online at www.sciencedirect.com
ScienceDirect Procedia Computer Science 50 (2015) 270 – 275
2nd International Symposium on Big Data and Cloud Computing (ISBCC’15)
Tool Wear Condition Prediction Using Vibration Signals in High Speed Machining (HSM) of Titanium (Ti-6Al-4V) Alloy P Krishnakumara,*, K Rameshkumarb, K I Ramachandranc a
Assistant Professor, Department of Mechanical Engineering, Amrita Vishwa Vidyapeetham,Coimbatore-641112,India Adjunct Professor, Department of Mechanical Engineering, Amrita Vishwa Vidyapeetham,Coimbatore-641112,India c Professor, Department of Mechanical Engineering, Amrita Vishwa Vidyapeetham,Coimbatore-641112,India
b
Abstract Ti-6Al-4V is extensively used in aerospace and bio-medical applications. In an automated machining environment monitoring of tool conditions is imperative. In this study, Experiments were conducted to classify the tool conditions during High Speed Machining of Titanium alloy. During the machining process, vibration signals were monitored continuously using accelerometer. The features from the signal are extracted and a set of prominent features are selected using Dimensionality Reduction Technique. The selected features are given as an input to the classification algorithm to decide about the condition of the tool. Feature selection has been carried out using J48 Decision Tree Algorithm. Classifications of tool conditions were carried out using Machine Learning Algorithms namely J48 Decision Tree algorithm and Artificial Neural Network (ANN). From the analysis, it is found that ANN is producing comparatively better results. The methodology adopted in this study will be useful for online tool condition monitoring. © 2015 The Authors. Published by Elsevier B.V. This is an open access article under the CC BY-NC-ND license © 2015 The Authors. Published by Elsevier B.V. (http://creativecommons.org/licenses/by-nc-nd/4.0/). Peer-review under responsibility of scientific committee of 2nd International Symposium on Big Data and Cloud Computing Peer-review under responsibility of scientific committee of 2nd International Symposium on Big Data and Cloud Computing (ISBCC’15). (ISBCC’15) Keywords:Titanium alloy; High Speed machining; Machine Learning Algorithm; Tool Wear
1. Introduction Titanium alloy (Ti-6Al-4V) is one of the hard to cut material due to its low conductivity, chemical reactivity with the cutting tools, low modulus of elasticity, and work hardening characteristics. Despite of its machining issues,
* Corresponding author. Tel.: +91 9865492807. E-mail address:
[email protected]
1877-0509 © 2015 The Authors. Published by Elsevier B.V. This is an open access article under the CC BY-NC-ND license (http://creativecommons.org/licenses/by-nc-nd/4.0/). Peer-review under responsibility of scientific committee of 2nd International Symposium on Big Data and Cloud Computing (ISBCC’15) doi:10.1016/j.procs.2015.04.049
271
P. Krishnakumar et al. / Procedia Computer Science 50 (2015) 270 – 275
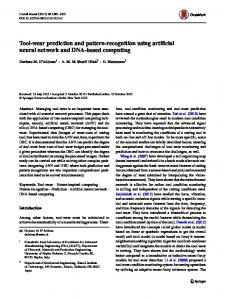
Titanium alloy is a useful material for a number of different industries, including the automotive, aerospace, and bio-medical. Wear1 of the cutting tools has an enormous impact on the ability to machine the Titanium alloy and as well as the on the manufacturing cost of the finished component. The cutting tool wear during machining Titanium alloy will progress rapidly. Tool wear condition prediction is important to ensure the required surface finish of the component and also for replacing cutting tools at the right time. It is essential to develop a Tool Condition Monitoring (TCM) system to the increase productivity and promoting automation in metal cutting process using automated machines. Many attempts have been made in the past to develop such systems using signals from various sensors such as dynamometer, accelerometer, acoustic emission, current and voltage2. But the successes of different sensor based systems are limited due to the complexity of tool wear mechanism. Among various methods, vibration based approaches are simple and effective in sensing the tool wear. Recent past, TCM systems are developed using advanced signal processing techniques and artificial intelligent models. Vibration based monitoring methods are used in conventional drill tool monitoring3. Disadvantages like, dependency of the vibration signals on work material, machining conditions and machine tool structure were reported in the literature. On-line tool breakage monitoring system and embedded tool condition monitoring4 based on vibration data were also studied and developed. Vibration signals were analyzed both in time domain and frequency domain5 to detect tool wear and breakage in machining process. To improve the performance of tool condition monitoring, more advanced methods have been developed. Neural networks6 are the most studied and gained success in practical applications, due to its capability in learning and nonlearning mapping of features and tool state. Pattern recognition methods7 such as fuzzy clustering approaches, Support Vector Machine8, Self organizing maps9 and Hidden Morkov models10 have been studied and applied to tool condition monitoring by researchers. From the literature it is found that not much work has been carryout to monitor the condition of the tool under high speed machining of Titanium alloy. Moreover, most of the studies were dealt with single point cutting tools. SVM11 technique used to monitor the machine tool condition in CNC Gear grinding machine In this study, tool wear is continuously monitored in a High Speed Machining Centre using vibration signals and machine learning algorithms for correlating tool conditions. Experiments were conducted using multipoint coated carbide tool under different machining conditions. The vibration signals were continuously captured using accelerometer. Signal processing techniques were used to extract the statistical features from the vibration signal. A decision tree algorithm (J48) is utilized for extracting dominant features. Classification of tool wear condition is carried out by considering machine learning algorithms such as Artificial Neural Network and Decision Tree algorithm. The classification efficiencies of these algorithms are compared and best feature classifier is identified. 2. Methodology The methodology adopted in this work is shown in the Figure 1. The signal from the sensor is filtered, amplified and digitized. The digitized signal is processed in a computer. Experimental Setup
Data acquisition & Signal
Statistical feature extraction
Tool Condition (3 conditions)
Fig. 1.Methodology.
Feature selection (Decision tree algorithm)
Feature classification (J48 and ANN)
272
P. Krishnakumar et al. / Procedia Computer Science 50 (2015) 270 – 275
The statistical features namely Mean, Median, Standard Error, Mode, Standard Deviation, Sample Variance, Kurtosis, Skewness, Range, Minimum, Maximum, sum and count from the signal were extracted. A set of predominant features are selected using dimensionality reduction technique. These selected features are given as an input to the classification algorithm to decide about the condition of the tool. 3. Experimental setup Experimental set-up established for tool condition monitoring is shown in the Figure 3.1. Accelerometer mounted on the spindle holder of the High Speed Machining Centre. Experiments were conducted with Titanium alloy (Ti-6Al-4V) as work piece material and 4 mm diameter solid carbide end mill cutter as a cutting tool. Experiments were designed with cutting speed ranging from 150 m/min to 350 m/min, depth of cut of 0.3 mm and feed rate of 300 mm/min. Machining parameters are shown in the Table 1. Experiments were conducted and optimum machining conditions were established with an objective of maximizing the tool life. During the machining operation, vibration signals are monitored continuously. Following three different tool conditions (stages of tool wear) based on flank wear are taken into consideration for feature selection and classification: a. Tool at good condition b. Tool at middle of its life c. Worn out tool Accelerometer HSM
Spindle and Tool
FFT Analyzer (Dactron)
DAC (RT PhotonSystem)
Feature extraction and classification Work piece Tool Condition Fig. 2.Experimental setup. Table 1.Machining parameters.
Exp.No.
Cutting Speed (m/min)
Spindle speed (rpm)
1
150
11943
2
200
15924
3*
225
17914
4
300
23885
5
325
25876
6
350
27867
Depth of Cut (mm)
Feed (mm/min)
0.3
300
* Optimum Machining Condition
The condition of the tool wear is decided based on the measured Vb value. Flank wear, Vb of 0.012 is considered as a reference value to decide the change of tool (tool worn-out condition).
P. Krishnakumar et al. / Procedia Computer Science 50 (2015) 270 – 275
4. Data acquisition and feature selection Vibration signals from accelerometer are collected through the FFT analyzer. From the vibration signal, statistical features are extracted. From the extracted features, the feature which contains large amount of information related to the condition of the tool has to be identified. Best features among all the features considered in this study are selected by using Dimensionality Reduction Technique. A decision tree algorithm12 is used for this purpose. J48 algorithm is used to produce the decision-tree. Decision trees produced by the J48 algorithms can be used for data classification. A decision tree for the feature selection is shown in Figure 3. The feature which has the highest information gain will be at the root of the tree and other dominating features in the following nodes. It is observed that the standard error is is the more significant feature among the other features. Features, which have less discerning capability, can be eliminated. Standard Error, Kurtosis, and Median were suggested as best features by the decision tree algorithm for the machining condition considered in this study. Decision Tree for the best machining condition (Cutting speed 225 m/min, feed 300 mm/min and depth of cut: 0.3 mm) is given in the Figure 3.
Fig. 3. Decision tree for feature selection.
5. Tool condition classification After selecting the dominant features, the classifications were carried out using a decision tree based J48 algorithm and ANN. The main objective of this work is to find the classification efficiencies of the algorithms and to find best feature classifier. 5.1. J48 - Decision tree algorithm The data points of selected dominant features are fed into statistical classifier, J48 decision tree algorithm for classification13. The training data set D = {d1 ,d 2 ,... ,d i } of already classified samples. The sample ‘ d i ’ consisting of ‘n’ dimensional vector ( y1,i , y 2,i , ... , yn,i ) where ‘ y i ’ represents the features of the sample, and also class in which ‘ d i ’ falls. At every node of the decision-tree, J48 algorithm selects the feature of the data that most efficiently splits its set of samples into subsets augmented in one class or the other. The decisive factor used for splitting is based on difference in entropy. The feature with the highest entropy is selected to make the decision. The result given by decision tree is shown in the Table 2. Table 2. Results - J48 Decision tree algorithm. Correctly Classified Instances Classification Efficiency Incorrectly Classified Instances
82 94.2529 % 5
Table 3.Confusion matrix. a 26 2 0
b 3 27 0
c 0 0 29
Tool condition A B C
The results are also shown in the form of confusion matrix in Table 3. In the confusion matrix ‘a’ means good condition, ‘b’ is the medium wear condition and ‘c’ denotes the worn-out condition. It is observed from the
273
274
P. Krishnakumar et al. / Procedia Computer Science 50 (2015) 270 – 275
confusion table that three data points which belongs to class ‘a’ are misclassified as ‘b’ and 2 data points which belongs to class ‘b’ are misclassified as ‘a’. The overall classification efficiency is 94.3%. 5.2. Using ANN Artificial Neural Networks (ANN) operates on the basis of biological inspiration. ANN contains input, hidden and output layers and they are interconnected. These layers contain artificial neurons which has the activation function in it. When there is more than one input to the neurons, the inputs were combined using weighted sum approach and presented as one input to the neuron. After receiving the input, depends on the activation function, the neuron will generate an output. During training the weights are adjusted by comparing with the desired output, using the known data which is fed to the network. After training the neural network the validation data is fed to the network to check whether the training given to the network is sufficient or not. Upon validation, the test data is fed to the network and the output gives the classification of the tool condition (good/ tool at mid of its life/worn out). A feed forward back propagation Neural Network model was selected in this study for classifying the vibration feature data according to the tool condition. In this study, the inputs to ANN are the dominant features selected by J48 algorithm. The features are standard error, kurtosis and median. From the available 87 data points, 61 data points (70 %) are used for training. In the remaining data points, 13 each were used for testing and cross validation. Data points were chosen randomly for training, cross validation and testing. Neurons are given with sigmoid activation functions. The output layer of the neural net contains the neurons representing the stages of tool condition such as good tool, tool at mid of it life and worn out tool. One hidden layer with 10 hidden neurons is used in this model. The architecture of the ANN is shown in the Figure 4. Input layer
Hidden Layer
Output Layer
1
Mean
Tool at Good Condition 2
1 Standard Error
1 Tool at mid of its life
3
2 Kurtosis 3
. . .
2 Worn-out Condition 3
9
10 Fig. 4. ANN Architecture.
Neural network was simulated after training the network with the input data. The number of misclassification in the training data is found to be 2. The classification efficiency is 96.7%. In the validation data set, the number of misclassification is 1 with a classification efficiency of 92.3%. Classification efficiency of 92.3% is achieved in the case of data set which is used for the testing. The overall efficiency of classification is found to be 95.4 %. 6. Results and discussions The performance of J48 algorithm and Feed Forward Back Propagation Neural Network are compared based on their classification efficiency. The overall classification efficiencies of the algorithms are shown in the Table 4. J48 and ANN are predicting the tool conditions with a classification efficiency of 94.3% and 95.4% respectively. The performance of ANN is relatively better comparing with the J48 algorithm. Out of 87 data points (features), only four input data points were misclassified by the ANN.
P. Krishnakumar et al. / Procedia Computer Science 50 (2015) 270 – 275
275
Table 4. Summary of classification efficiencies Algorithm
J48
ANN
Classification Efficiency, %
94.3
95.4
7. Conclusions In this study, an experimental set-up was established to monitor cutting tool condition in a High Speed Machining Centre using vibration signals. Decision tree based J48 algorithm and Feed Forward back propagation Neural Network are used for correlating tool conditions with the vibration signal features. Experiments were conducted using multipoint coated carbide tool under optimum machining parameters with an objective of improving the tool life. For the different tool conditions, the vibration signals are acquired using the 3 axes accelerometer. Signal is acquired continuously until the failure of the cutting tool. The statistical features of vibration signals are extracted. Tool wear and surface finish are measured at various time intervals. Three different stages of tool wear are considered and the corresponding vibration data is used in feature reduction and classification. The feature reduction is done by decision tree algorithm. J48 decision tree and ANN algorithms were used for tool condition classification. Statistical features such as standard error, median and kurtosis are prominent in classifying the condition of the cutting tool with good accuracy. The performance of J48 algorithm and Feed Forward Back Propagation Neural Network are compared based on their classification efficiency. J48 and ANN are predicting the tool conditions with a classification efficiency of 94.3% and 95.4% respectively. The performance of ANN is relatively better comparing with the J48 algorithm. Out of 87 data points (features), only four input data points were misclassified by the ANN. The performance analysis shows that the statistical feature of the vibrating signal is able to classify the tool condition with good accuracy. Acknowledgement This research is supported by Directorate of Extramural Research & Intellectual Property Rights (ER & IPR), Defence Research & Development Organization (DRDO), ERIP/ER/0803740/M/01/1194, 13.1.2010. References 1. S. Zhang, J. F. Li, J. Sun and F. Jiang. Tool wear and cutting forces variation in high-speed end-milling Ti-6Al-4V alloy. International Journal of Advanced Manufacturing Technology 2010; 46: 69–78. 2. Wang W H, Wong Y S, Hong G S, Zhu K P. Sensor fusion for on-line tool condition monitoring in milling. International Journal of Production Research. 2007; 45(21). 3. Chen J C, Chen W. A tool breakage detection using an accelerometer sensor. Journal of Intelligent manufacturing 1999; 10: 187-197. 4. Li H, Chen X, Zeng H, Li X. Embedded tool condition monitoring for intelligent machining. International Journal of Computer applications in Technology 2007; 28: 74-81. 5. Zhang J Z, Chen J C. Tool condition monitoring in an end mill operation based on the vibration signal collected through a microcontroller based DAS. International Journal of Advanced manufacturing Technology 2008; 39: 155-160. 6. Saglam H, Unuvar A. Tool condition monitoring in milling based on cutting forces by a neural network. International Journal of Production Research 2003; 41(7). 7. Li X, ZhejunY. Tool wear monitoring with wavelet packet transform-fuzzy clustering method. Wear 1998; 219 (2): 145-154. 8. Sun J, Hong G S, Wong Y S, Raghman M, Wang Z G. Effective training data selection in TCM system. International Journal of machine tool and manufacture 2006; 43 (6): 218-224. 9. Wang W H, Wong Y S, Hong G S, Zhu K P. Sensor fusion for on-line tool condition monitoring in milling. International Journal of Production Research 2007; 45(21). 10. Miao Q, Makis V. Condition monitoring and classification of rotating machinery using wavelets and HMM. Mechanical systems and signal processing 2007; 21: 840-855. 11. Peigong Wang, Qingfeng Meng, Jian Zhao, Junjie Li, Xiufeng Wang. Prediction of Machine Tool Condition Using Support Vector Machine. Journal of Physics: Conference Series 2011;305(1). 12. Quinlan, J. R. C4.5: Programs for Machine Learning. Morgan Kaufmann Publishers, 1993.