In A.F. Blackwell & E. Bilotta (Eds). Proc. PPIG 12
Pages 221-236
Tools for Observing Study Behaviour P.G.Thomas & C.B. Paine Computing Department Open University
[email protected] [email protected] Keywords: POP-II.C. types of programmer behaviour, POP-II.B. Smalltalk, POP-V.B. Observation.
Abstract This paper describes some of the research into student learning behaviour being undertaken within the AESOP project. This project analyses data gathered by our electronic observatory, a non-intrusive mechanism for recording student actions as they undertake a series of pre-defined learning tasks. We have recorded the behaviour of a number of students on our award winning introductory computing course M206, Computing: An object oriented approach as they interact with the the LearningWorks system for learning Smalltalk [Woodman et al, 1999]. In this paper we describe the overall design and use of the observatory and discuss some of the tools that have been developed to analyse the recordings. We present some conclusions based on a pilot study undertaken in 1999. Whilst we have observed a variety of behaviours, many of them are unsurprising. However, collectively they provide a useful picture of how students learn at a distance which is often at variance with the pre-conceptions of course designers and suggests how courses for the future in distance education should be structured. Introduction AESOP (An Electronic Student Observatory Project) is a system for recording, replaying and analysing user actions in LearningWorks, a Smalltalk programming environment. The Open University educational environment is one in which students study independently at a distance, off line, using software developed for an entry level, distance education course in computing - M206, Computing: An Object-Oriented Approach. The project aims to (i) investigate how students learn to program (in Smalltalk) (ii) develop software tools to help investigate how students learn to program (iii) develop software tools to help the teaching and learning process. The Electronic Observatory consists of three major software components:
• • •
a Recorder a Replayer an Analyser
As a student interacts with a LearningBook the Recorder writes a file of textual representations of events e.g. button clicks, hyperlink selections and expression evaluations. Each event is recorded with a time stamp.
The Replayer has been implemented as a LearningBook application, and sends instructions to an executing LearningWorks system. The Replayer plays back a recording so that an investigator can observe what the student did. The Analyser enables the investigator to search for patterns of behaviour across sets of recordings. A wide variety of possible analysis tools have been identified and several built (Macgregor et al 1999).This paper briefly describes the analysis tools built to date. Some early findings, based on a pilot project, are also discussed. The Student Environment The AESOP educational environment is one in which 5000 students’ study independently at a distance, off line, using software developed for an entry level, distance education course in computing. M206 Computing: An Object-Oriented Approach involves practical work using Smalltalk in the LearningWorks environment. Students are sent a CD, which contains the LearningWorks system and a collection of LearningBooks i.e. software modules of objects and classes that use a 12th Workshop of the Psychology of Programming Interest Group, Cozenza Italy, April 2000
www.ppig.org
ii
Thomas & Paine
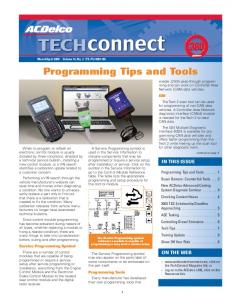
book metaphor, which form the units of practical work. Each LearningBook contains interrelated ‘Practicals’, which are intended to comprise a student ‘session’. Each page of a LearningBook is a Smalltalk application which can be a Web-style HTML page, a programming tool, or a microworld. A page may be ‘detached’ from its book. The first section always contains an HTML-browser page of practical exercises. Subsequent sections contain microworlds and programming tools. Students do not, as a part of the course, submit their work except for a small number of assignments spread over the year long duration of the course. No one knows what a student has or has not done in a LearningBook that is not part of one of the special assignments. The Time Tools For each LearningBook that a student works with, the Recorder records a series of events each with a time and date stamp, see Figure 1.
Figure 1- A fragment of a recording (displayed by the Replayer) The Analyser’s time tools were developed to investigate issues related to student study times and study patterns. It is a simple matter to calculate the total elapsed time from the moment the student opens a LearningBook (recorded as the event openUserVersion) to the final time the LearningBook is closed (event User Click ‘yes’ following the event closeNoTerminate). However, a student can interact with a given LearningBook on several separate occasions, and each time a LearningBook is opened the Recorder simply appends its information to the end of the existing recording. Hence, a single recording holds information about all uses of a LearningBook, no matter how many times the book was opened or over what period of time.
The Total Time Tool In general, the elapsed time of a recording does not correspond to the actual time spent by the student interacting with a LearningBook. A recording will include significant time differences between successive events corresponding to breaks in student activity (there is a 45-minute gap between events inspectAnswer and selectAnchor in the recording shown in Figure 1).
Clearly, the time between closing and re-opening a LearningBook is time that the student is not interacting with the LearningBook and can be subtracted from the total elapsed time to give a better estimate of the time actually spent working with a LearningBook. Since the Recorder is non-intrusive, there is no information in a recording that explicitly states why a long gap between two events has occurred. Therefore, the Total Time Tool has been designed with a time difference parameter that allows its user to investigate the effect of removing all gaps above this level from the total elapsed time. For example, it might be thought reasonable to consider differences between events of more than 10 minutes to constitute a break in study activity. Table 1 shows the results of removing gaps of different sizes from typical student recordings of the same LearningBook.
PPIG 2000, Cozenza Italy
www.ppig.org
iii
Thomas & Paine
Student
Totals Time Taken when ‘Time Difference’ is set to: No Break
1 hour
30 mins
15 mins
10 mins
5 mins
1
27h59m17s
2h5m31s
1h26m0s
1h26m0s
1h26m0s
1h26m0s
2
73h48m45s
1h10m51s
1h10m51s
1h10m51s
1h10m51s
1h10m51s
3
284h34m43s
2h52m41s
1h44m3s
1h44m3s
1h44m3s
1h18m27s
Mean
84h47m31s
1h44m16s
1h28m50s
1h28m50s
1h19m7s
1h11m16s
Table 1 - The Calculated study time for a student in LearningBook 10 with varying lengths of break time Table 1 indicates that, as the time difference parameter is reduced, the time remaining appears to converge to a value that we can take to be a good estimate of the time actually spent actively interacting with the LearningBook. Quite clearly, there can be good reasons why a particular gap should not be considered a break in study. It is quite possible, for example, that the student has reached a point at which he or she needs to examine other course material in order to proceed with the next step in the LearningBook. However, LearningBooks tend to be ‘self contained’ and do not normally require the student to interact with other materials. Figure 2 shows the user interface to the Analyser and, in particular, the Total Time Tool.
Figure 2 - User Interface to the Time Differences Tool The All Total Times Tool The All Total Time Tool is a generalisation of the Total Time Tool that enables us to examine the behaviour of all students on a given LearningBook. We have used it to examine the behaviour of students over a number of LearningBooks, and have concluded that a time difference of 10 minutes yields the most consistent view of what constitutes a break in study. The calculated times spent by students working on a particular LearningBook, having made allowance for study breaks of 10 minutes or more, have been compared with the time that the course team expect a student to spend working on that LearningBook, this is illustrated in Figure 3. The conclusion is that students spend significantly less time on studying the LearningBook than recommended by the course team.
PPIG 2000, Cozenza Italy
www.ppig.org
iv
Thomas & Paine
Figure 3 - Average calculated study time compared with recommended time set by course team. On average, students spent 58% of the recommended time studying a LearningBook. The Session Times Tool A LearningBook is made up of a collection of sessions, which means that a more refined view of student behaviour is one in which sessions are examined rather than a LearningBook as a whole. The elapsed time for a LearningBook shows that, in general, students interact with a LearningBook in several ‘sittings’. That is, they work through a LearningBook over a significant period of time, often several days as illustrated in Table 2, performing the activities in a number of discrete chunks of time (which we shall call sittings). Learning Book
Average Elapsed Time
Minimum Elapsed Time
Maximum Elapsed Time
9
1days 22hours
47mins
3days 1hour
10
3days 21hours
18hours 24mins
11days 20hours
12
2days 17hours
52mins
12days 23hours
13
2days 5hours
1hour 59mins
8days 20hours
14
1day 9hours
1hour 5mins
5days 23hours
15
16hours
47mins
4hours 1hour
16
2days 22hours
1hour 33mins
11days 5hours
20
1day 5hours
6hours 43mins
2days 5hours
Table 2 - Average elapsed time to study a LearningBook. We define a sitting as the activity between two breaks. Figure 4 shows the number of sessions per LearningBook, which correspond quite closely with the number of sittings. After analysing a range of LearningBooks for a number students we concluded that LearningBooks are studied over several days (the average is 3 days) in several sittings (the average is 4.2), and students are prepared to concentrate on practical activities for around 25 minutes at a time. It should be noted that students are instructed to read parts of the teaching text in between sessions. The recordings show that students do follow these instructions in that they tend to complete a session in one sitting. A few students take breaks within a session. It was clear that, in general, students tend to try the first session and then either give up or complete the whole LearningBook. An interesting fact emerged from this work: some students repeat some sessions. In some cases, students revisit a session in order to complete it, in other cases they repeat some of the tasks. Whether this latter action is by accident or design remains to be discovered. However, we speculate that, when a student takes a long break, and closes down the system, he or she will quickly read through sessions already studied in order to reach the part where they had previously reached (if the student remembers to save a LearningBook the system will subsequently open up where the student left-off, otherwise LearningBooks have no memory of where a student has got to). The Session Times Tool has to take this effect into account when analysing the data.
PPIG 2000, Cozenza Italy
www.ppig.org
v
Thomas & Paine
Figure 4 - Number of Sessions and number of sittings per LearningBook. Examining sessions provides a more refined view of student behaviour than looking at complete LearningBooks. However, the time spent on a session varies considerably from one student to another. In an attempt to explain this apparent discrepancy we turn our attention to the idea of refining a session into ‘tasks’ and examining how many tasks, and indeed, which tasks are completed by a student Tasks Tools Tasks Completed Tool LearningBooks and their practical activities have been so designed that students can be asked to perform ‘small grained’ programming tasks, for example, entering a fragment of Smalltalk code and asking the system to ‘evaluate’ it (the press of a single button). The Tasks Completed Tool compares the tasks that a student has completed successfully with the tasks they are asked to complete in a particular practical activity. In this context a task is anything a student is asked to do, and can include evaluating a line of code, creating a new method, amending an existing method, and inspecting variables. Each practical activity has an associated, but separate, discussion section that provides help and can be used to discover the details of the activity that should have been carried out. The tool also enables an investigator to identify at which point in a LearningBook students carry out a task, whether they complete a task in a practical, or whether they go straight to the discussion and carry out a task there. In order to specify the tasks that are contained in a LearningBook, we adopted the notion of an ideal recording – a complete attempt at the activities in a LearningBook – that could be used as a benchmark against which student attempts could be measured. An ideal recording1 was created by a member of the research team following the instructions in each practical precisely . This information was then used to create a specification of the tasks to be completed in each practical. When the tasks completed tool is selected in the Analyser a comparison is made between the specification and a student recording. The output from this tool shows the number of tasks a student was asked to complete in a practical or discussion, and the number of tasks they completed successfully. An example output from LearningBook 9, practical 2 is shown in Figure 5.
1
There is an issue as to whether an ideal recording truly represents a practical activity as it depends upon the research worker interpreting the instructions ‘correctly’. We attempted to take this variability into account by asking several workers to produce their own ideal recordings and then examined the discrepancies between them. Not only did this provide suitable ideal recordings; it also highlighted possibly ambiguous instructions that the authors of the practical activity could revise.
PPIG 2000, Cozenza Italy
www.ppig.org
vi
Thomas & Paine
___________ Chapter 09 session 1 practical 2 Number of set tasks = 5 Set tasks: *gribbit up *2 colour *gibbit right *gribbit hone *htonnoy right Number of tasks completed = 5 Tasks completed: *gribbit up *2 colour *gibbit right *gribbit hone *htonnoy right _________________
Figure 5 - Example output from the Tasks Completed Tool For each LearningBook the number of tasks completed by each student was calculated as a percentage of the number of tasks they were asked to complete. A particular difficulty with this initial approach was the fact that the tool only counts successful task completions, where success means an exact match with the ideal recording. Some tasks can be identified as completed without dispute in situations where the comparison between the student recording and the specification is made between known strings as in, for example, determining whether or not the student inspected an object. Other tasks cannot be identified as easily. These tasks include evaluations of Smalltalk expressions and the construction of Smalltalk methods, where there may be any number of legitimate differences between a student recording and the specification. The use of wildcards in the specification allow for some of these differences, including differences in white space, different argument values, and differences in the naming of instance variables. For example, if a student were asked to create an instance of the class Frog, the specification would be, *:= Frog new, making allowance for the student to use any variable to refer to their Frog instance. * is the conventional wild card symbol for ‘a string of any length’. However, this initial version of the tool is limited in the allowances that can be made for differences between the student recording and the specification. Even with uncomplicated tasks, students will devise solutions that are correct in the sense that they solve the problem posed and such solutions will not be registered by the tool. The major weakness of the initial version of the tool is that it did not identify whether any attempts were made at a task. If a student has not completed a particular task we can look at the practical in more detail to determine whether they have made any kind of attempt at the task. We improved this initial tasks completed tool to overcome some of these issues, by developing the Tasks Describer. Task Describer This second version of the Tasks Completed Tool, currently under development, looks for a specified task in a student recording, and employs a scoring system for tasks successfully completed, or tasks partially completed. This new tool identifies any attempts a student makes at a task, wherever carried out in a LearningBook, and will, it is anticipated, recognise if a student devises an alternative solution to a task. Figure 5 shows an example of the interface for the new tasks completed tool.
The user enters the number of the chapter/session/ practical /task they wish to investigate in the appropriate fields. For example, in Figure 6 the text pane shows the task description for the first task in chapter 9, session 1, practical 2. The first line is a comment reminding the developer of the task the student was asked to complete. In this simple example the students were asked to evaluate a single line of code, ‘gribbit up’. The second line displays the scores awarded for the evaluation or variations on the evaluation, in this example a student evaluating ‘gribbit up’ will be awarded 1, whereas a student evaluating ‘gribbit’ (alone or followed by something else other than up) will be awarded half.
PPIG 2000, Cozenza Italy
www.ppig.org
vii
Thomas & Paine
Figure 6 - Interface to the Tasks Describer tool The Tasks Completed Tool can be used in conjunction with the Analyser’s time tools (Thomas & Paine 2000) to look for relationships between the number of tasks a student has carried out within a LearningBook and the total time taken. Apart from the analysis tools we have built, we have also employed the use of some other tools to visually represent our data and look for patterns. Examples of these tools are described below. Searching for Patterns One ‘high-level’ aim of the project is to look for pattens of behaviour within, and across several LearningBooks. Therefore we have tried a number of approaches to searching out patterns. Two promising approches are DUPLOC (a tool developed for the visual detection of duplicated program code) and neural networks. DUPLOC DUPLOC was initially developed for the visual detection of duplicated code by Rieger & Ducasse (1999). DUPLOC reads in a number of source code files and compares them line by line using a simple string match comparison function. Comparisons can then be made between files to produce a 2D matrix, where each cell stands for a comparison between the two lines of code and contains a value unless the two lines did not match. We have applied this tool to our recordings to compare lines of text in a student recording with those in the ideal recording. Figure 7 shows a typical output from DUPLOC when applied to one of our recordings. From Figure 6 four sections in the matrix can be seen. In the ideal section and the student section each cell represents a line of text that is either an evaluation or a method. Any cells that appear off the diagonal line in these sections indicate repetitions of lines of text. There are two comparison sections, which are mirror images of each other. In the comparison sections a match between a line of code in the student recording and a line of text in the ideal recording produce a cell with a value. Any cells with values off the diagonal in this section illustrate the same line of text appearing in the student recording and the ideal recording but in a different place.
PPIG 2000, Cozenza Italy
www.ppig.org
viii
Thomas & Paine
Figure 7 - DUPLOC matrix comparing a student in LB14 with the Ideal Recording This matrix can be examined using point-and-click. Clicking on any cell opens a window, which displays the source text of the compared files. Lines of text that match are shown in red. Figure 8 shows the source text viewer comparing a student recording with the ideal recording.
Figure 8 - DUPLOC source text viewer comparing a student in LB14 with the Ideal Recording Using DUPLOC allows us to see any patterns in our data. We can immediately see if a student’s recording contains greater or fewer lines of text than the ideal recording. We can also see if a student has repeatedly evaluated a line of text. This provides us with a reference of where to look in a recording for more information. After looking at several student’s recordings over a number of LearningBooks we observed in the comparison section of the matrix that most students deviated from the ideal recording towards the end of a LearningBook., and more work needs to be done to discover why this is so The same issues are raised with DUPLOC as with the Tasks Completed Tool in that both tools only look for exact matches between the ideal recording and the student recording. Neural Networks We are also collaborationg with a group of computer science academics from Jyväskylä University, Finland. They use a particular type of neural network, a Tree-Structured Self-Organising Map (TSSOM) (Koikkalainen, 1994) and a software implementation Neural Data Analysis (NDA) Environment (Hakkinen & Koikkalainen, 1997). This software provides tools for data reduction, data manipulation, data visualisation and decision making. PPIG 2000, Cozenza Italy
www.ppig.org
ix
Thomas & Paine
The Observatory’s Analyser includes a tool to modify our recordings into the required format for analysis. The modified recordings consist of a list of events together with the corresponding student identifications. Fifty events are used, which include evaluting a Smalltalk expression, creating or amending a Smalltalk method, selecting a Hyperlink and so on. The NDA software can then be used for basic statistical analysis on these recordings. It can also be used to extract any significant information from the data; to find interesting groups or regularities, and perhaps most interestingly for us, any irregularities in recordings can be identified. Any number of student recordings within a LearningBook can be compared and analysed, as well comparing a students work across a number of LearningBooks. The NDA also provides strong visualisation tools to display our results. To date we have not found any significant patterns that were not expected but need to examine a larger data set that will be generated as a result of this year’s experiment. Developing an automatic coaching system One of the types of information captured by the Recorder is the occurrence of programming errors. Whenever a student asks the LearningWorks system to evaluate a Smalltalk expression there is always the possibility of error. Such errors are communicated to the user via dialog windows containing error messages. In some circumstances the evaluated expression also contains an error message and indicates where in the text the error was detected. All this information is stored by the recorder and is available for analysis. In the early LearningBooks, the activities that students are asked to do are highly structured and the scope for error is greatly constrained. However, some errors do occur, and a few do so with sufficient frequency that warrant further action to be taken. Since a recording contains information about what the student did prior to receiving an error message and, more crucially, what action the student took in reacting to the error message, we can build up a database of scenarios that can be used to inform the student of likely solutions to the problem of rectifying the error. Therefore, we are developing a coaching system that will draw on these scenarios to offer additional help to the student when an error is detected by the system. Interestingly, analysing what students have done in response to an error message has provided a great deal of insight into how particular error messages are perceived. In some cases it has been abundantly clear that some error messages give a totally wrong impression to the student of what the cause of the error actually is. For example, one student asked for the following expression to be evaluated: hoverFrog1 right: 3 hover: goUp: 3 The syntax of this expression is wrong and the system provides an error message in the body of the evaluated text: hoverFrog1 right: 3 hover: Argument expected ->goUp: 3
The student’s immediate reaction was to edit goUp and replace it by upby and received the same error message: hoverFrog1 right: 3 hover: Argument expected ->upby: 3
We have seen this kind of behaviour on several occasions and have deduced that the appearance of the ‘arrow’, ->, at the end of the error message text leads the student to believe that the error is in the term that is pointed at (goUp and upby). In fact, the actual error is (as the error message says) a missing argument for hover: Therefore, whilst the error message itself indicates the correct nature of the problem, the arrow has distracted the student’s attention. This line of investigation suggests that it may be possible to extract information about the nature of errors automatically and feed it into the software coaching system. Summary We have built a number of tools for analysing the data captured by our Electronic Observatory, a non-intrusive automatic recorder of student behaviour. We have been examining various aspects of student behaviour primarily in relation to the time taken to perform a set of activities. We have also been experimenting with a variety of pattern matching mechanisms to look for patterns of behavior within the recordings. The recordings have revealed useful information about errors which will form the basis of an electronic coaching system.
PPIG 2000, Cozenza Italy
www.ppig.org
x
Thomas & Paine
Current Work The initial trial last year involved around 30 students, and we focused on 10 of the 25 course LearningBooks. The recorder and analyser have been refined for massive data collection this year. We already have around 350 student volunteers and we have begun the collection of recordings and started some of them. We are collecting recordings from all of the 25 LearningBooks. At the time of writing we are concentrating on the development of the Task Describer Tool, as described above. We are continuously modifying the analysis software, and deveoping new tools. Acknowledgements The majority of the coding of the tools described in this paper were developed by Malcolm Macgregor. References Hakkinen, E. & Koikkalainen, P. (1997) The Neural Data Analysis environment. Proceedings of WSOM 1997: Workshop on Self-Organising Maps. Helsinki University, Espoo, Finland. Koikkalainen P. (1994b) Progress with Tree-Structured Self-Organising Map. Proceedings of 11th European Conference on Artificial Intelligence (pp. 211-215). John Wiley & Sons: Amsterdam, The Netherlands. Macgregor, M.,Thomas, P.G. & Woodman, M (1999) Recording User Actions in a Smalltalk Programming Environment. TOOLS USA Thomas, P.G. & Paine, C. (2000) How students learn to program: observations of study time behaviour. Research report: 2000/02. Computing Department : Open University. Thomas, P.G. & Paine, C. (2000) How students learn to program: observations of practical work. Research report: 2000/3. Computing Department : Open University. Thomas, P.G. & Paine, C. (2000) Data collection techniques used to study programming - and AESOP. Research report: 2000/4. Computing Department : Open University. Rieger, M. Ducasse, S. (1999) Visual Detection of Duplicated Code. http://www.iam.unibe.ch/~rieger/duploc/documentation.html Woodman, M. Griffiths, R., Macgregor, M., Holland, S., & Robinson, H. (1999) Exploiting Smalltalk Modules In A Customisable Programming Environment. Proceedings of ICSE 21, International Conference on Software Engineering. Los Angeles.
PPIG 2000, Cozenza Italy
www.ppig.org