the Benedict-Webb-Rubin (BWR) equation-of-state (EOS) compressibility ...... Pan, Z., Fitzgerald, J. E., Sudibandriyo, M., Gasem, K. A. M., and Robinson,.
Adsorption of Pure Methane, Nitrogen, and Carbon Dioxide and Their Mixtures on San Juan Basin Coal
Topical Report
January, 2001 – March, 2002
K. A. M. Gasem R. L. Robinson, Jr. S.R. Reeves Contract No. DE-FC26-00NT40924
May, 2002 Oklahoma State University School of Chemical Engineering Stillwater, Oklahoma 74078-0537 and Advanced Resources International 9801 Westheimer, Suite 805 Houston, TX 77042
U.S. Department of Energy Disclaimer This report was prepared as an account of work sponsored by an agency of the United States Government. Neither the United Sates Government nor any agency thereof, nor any of their employees, makes any warranty, express or implied, or assumes any legal liability or responsibility for the accuracy, completeness, or usefulness of any information, apparatus, product, or process disclosed, or represents that its use would not infringe privately owned rights. Reference herein to any specific commercial product, process, or service by trade name, trademark, manufacturer, or otherwise does not necessarily constitute or imply its endorsement, recommendation, or favoring by the United States Government or any agency thereof. The views and opinions of authors expressed herein do not necessarily state or reflect those of the United Sates Government or any agency thereof. Oklahoma State University Disclaimer The Principal Investigators agreed to undertake this research on a best effort basis. Neither Oklahoma State University and the Principal Investigators, nor any of their employees, make any warranty, express or implied, or assumes any legal liability or responsibility for the accuracy, completeness, or usefulness of any information, apparatus, product, or process disclosed or represents that its use would not infringe privately owned rights.
Advanced Resources International Disclaimer The material in this Report is intended for general information only. Any use of this material in relation to any specific application should be based on independent examination and verification of its unrestricted applicability for such use and on a determination of suitability for the application by professionally qualified personnel. No license under any Advanced Resources International, Inc., patents or other proprietary interest is implied by the publication of this Report. Those making use of or relying upon the material assume all risks and liability arising from such use or reliance.
2
Abstract The major objectives of this project were to (a) measure the adsorption behavior of pure methane, nitrogen, CO 2 and their binary and ternary mixtures on wet Tiffany coal at 130°F and pressures to 2000 psia; (b) correlate the equilibrium adsorption isotherm data using the extended Langmuir model, the Langmuir model, the loading ratio correlation and the Zhou-Gasem-Robinson equation of state; and (c) establish sorption-time estimates for the pure components. Specific accomplishments are summarized below regarding the complementary tasks involving experimental work and data correlation. §
Representative coal samples from BP Amoco Tiffany Injection Wells #1 and #10 were prepared, as requested. The equilibrium moisture content and particle size distribution of each coal sample were determined. Compositional coal analyses for both samples were performed by Huffman Laboratories, Inc.
§
Pure gas adsorption for methane on wet Tiffany coal samples from Injection Wells #1 and #10 was measured separately at 130°F (327.6 K) and pressures to 2000 psia (13.7 MPa). The average expected uncertainty in these data is about 3% (9 SCF/ton). Our measurements indicate that the adsorption isotherms of the two coal samples exhibit similar Langmuir-type behavior. For the samples from the two wells, a maximum variation of about 5% in the amount adsorbed is observed at 2000 psia.
§
Gas adsorption isotherms were measured for pure methane, nitrogen and CO2 on a wet, mixed Tiffany coal sample. The coal sample was an equalmass mixture of coals from Well #1 and Well #10. The adsorption measurements were conducted at 130°F at pressures to 2000 psia. The adsorption isotherms have average expected experimental uncertainties of 3% (9 SCF/ton), 6% (8 SCF/ton), and 7% (62 SCF/ton) for methane, nitrogen, and CO2, respectively.
§
Adsorption isotherms were measured for methane/nitrogen, methane/CO 2 and nitrogen/CO 2 binary mixtures on wet, mixed Tiffany coal at 130o F and pressures to 2000 psia. These measurements were conducted for a single molar feed composition for each mixture. The expected uncertainties in the amount adsorbed for these binary mixtures vary with pressure and composition. In general, average uncertainties are about 5% (19 SCF/ton) for the total adsorption; however, the expected uncertainties in the amount of individual-component adsorption are significantly higher for the less-adsorbed gas at lower molar feed concentrations (e.g., nitrogen in the 20/80 nitrogen/CO 2 system).
§
Adsorption isotherms were measured for a single methane/nitrogen/CO 2 ternary mixture on wet, mixed Tiffany coal at 130 o F and pressures to 2000 psia. The nominal molar feed composition was 10/40/50. The average expected uncertainty for the total adsorption and CO 2 adsorption is about 5%
3
(16 SCF/ton). However, the low adsorption of nitrogen and methane in this ternary yield average experimental uncertainties of 14% (9 SCF/ton) and 27% (9 SCF/ton), respectively. §
Limited binary and ternary gas-phase compressibility factor measurements at 130°F and pressures to 2000 psia involving methane, nitrogen, and CO 2 were conducted to facilitate reduction of our ternary adsorption data. These newly acquired data (and available data from the literature) were used to improve the Benedict-Webb-Rubin (BWR) equation-of-state (EOS) compressibility factor predictions, which are used in material balance calculations for the adsorption measurements. In general, the optimized BWR EOS represents the experimental compressibility factor data within 0.5% AAD.
§
The Langmuir/loading ratio correlation (LRC) and the Zhou-Gasem-Robinson (ZGR) two-dimensional EOS were used to analyze the newly acquired adsorption data. Model parameters were obtained for the systems studied.
§
The LRC and ZGR EOS were used to correlate the adsorption data for methane, nitrogen, and CO 2 and their mixtures on wet Tiffany coal. The model parameters were determined by minimizing the sum of squares of weighted errors in the calculated amounts of gas adsorbed. The results demonstrate the ability of the LRC and ZGR EOS to represent the total pure, binary and ternary systems within their expected experimental uncertainties. Specifically, representations with average absolute percentage errors (AAD) of 1-3% (2-15 SCF/ton), 1-8% (1-25 SCF/ton), and 2-10% (7-37 SCF/ton) were obtained for the pure, total binary, and total ternary adsorption isotherms, respectively. However, the quality of fit for the individual– component adsorption varies significantly, ranging from 3% for the moreadsorbed methane or CO 2 to 32% for the less-adsorbed nitrogen.
§
The LRC and ZGR EOS are capable of predicting binary adsorption isotherms based solely on pure-fluid adsorption parameters within twice their experimental uncertainties (1-50 %AAD, 5-40 SCF/ton). In comparison, the ternary predictions based on pure-fluid parameters yield three times the experimental uncertainties (4-56 %AAD, 2-60 SCF/ton). The quality of the model predictions indicate that although the two models are capable of predicting total adsorption isotherms adequately, they predict individualcomponent adsorption in mixtures poorly, especially when dealing with the less-adsorbed component of the mixture.
§
Sorption-time estimates for pure methane, nitrogen, and CO 2 were represented with average errors of about 8%.
4
TABLE OF CONTENTS Page Abstract .........................................................................................................3 A. Executive Summary .................................................................................10 B. Introduction .............................................................................................12 C. Experimental Work ..................................................................................12 1. Experimental Facility ...........................................................................12 2. Experimental Methods and Procedures ................................................12 (a) Adsorption Measurements ..........................................................12 (b) Determination of Coal Particle Size Distribution............................17 (c ) Determination of Coal Moisture Content ......................................18 (d) Sorption-Time Measurements for Pure Gases..............................18 D. Data Correlation ......................................................................................19 (a) Langmuir/Loading Ratio Correlation ............................................20 (b) ZGR Equation of State ...............................................................21 E. Results and Discussion............................................................................22 1. Experimental Data...............................................................................22 (a) Comparison of Tiffany Coal Samples...........................................22 (b) Adsorption Isotherms..................................................................22 (c ) Sorption-Time Estimates for Pure Gases ....................................25 2. Data Correlation and Model Evaluation.................................................26 (a) Adsorption Isotherms..................................................................26 (b) Sorption-Time Estimates for Pure Gases .....................................29 F. G. H. I.
Conclusions.............................................................................................30 References .............................................................................................32 Tables ....................................................................................................33 Figures...........................................................................................................50
5
List of Tables Page Table 1. Compositional Analyses of Tiffany Coal Samples*.......................................... 33 Table 2. Tiffany Coal Particle Size Distribution.............................................................. 33 Table 3. Vitrinite Reflectance Analysis*......................................................................... 33 Table 4. Pure Methane Adsorption on Wet Tiffany Well #1 Coal at 130 °F: 5.6% Moisture Content............................................................................................. 34 Table 5. Pure Methane Adsorption on Wet Tiffany Well #10 Coal at 130 °F: 16.5% Moisture Content............................................................................................. 35 Table 6. Pure Methane Adsorption on Wet Tiffany Mixed Coal Sample at 130 °F: 11.7% Moisture Content ................................................................................. 36 Table 7. Pure Nitrogen Adsorption on Wet Tiffany Mixed Coal Sample at 130 °F: 11.7% Moisture Content ................................................................................. 36 Table 8. Pure CO 2 Adsorption on Wet Tiffany Mixed Coal Sample at 130 °F: 11.7% Moisture Content............................................................................................. 37 Table 9. Methane/Nitrogen Adsorption on a Wet Tiffany Mixed Coal Sample at 130 oF: 10.5% Moisture Content..................................................................... 38 Table 10. Methane/CO2 Adsorption on a Wet Tiffany Mixed Coal Sample at 130 oF: 11.4% Moisture Content ................................................................................. 39 Table 11. Nitrogen/CO 2 Adsorption on a Wet Tiffany Mixed Coal Sample at 130 oF: 10.4% Moisture Content ................................................................................. 40 Table 12. Adsorption of a 10/40/50 Mole % Methane/Nitrogen/CO2 Feed Mixture on a Wet Tiffany Mixed Coal Sample at 130 oF: 10.5% Moisture Content ........ 41 Table 12. (Continued) Adsorption of a 10/40/50 Mole % Methane/Nitrogen/CO 2 Feed Mixture on a Wet Tiffany Mixed Coal Sample at 130 oF: 10.5% Moisture Content ............................................................................................................ 42 Table 13. Desorption Time for Methane on Wet Tiffany Well #1 Coal Sample at 130 oF ........................................................................................................... 43 Table 14. Desorption Time for Methane on Wet Tiffany Well #10 Coal Sample at 130 oF ............................................................................................................. 43 Table 15. Desorption Time for Nitrogen on Wet Tiffany Mixed Coal Sample at 130 oF ......................................................................................................... 43 Table 16. Adsorption Time for CO2 on Wet Tiffany Mixed Coal Sample at 130oF........ 44 Table 17. Langmuir Model Representation of Adsorption on Wet Tiffany Coals at 130 oF ............................................................................................................. 44 Table 18. LRC Model Representation of Adsorption on Wet Tiffany Coals at 130 oF... 44
6
Table 19. LRC Model Representation of Adsorption on Wet, Mixed Tiffany Coals at 130 oF (common η) ......................................................................................... 45 Table 20. ZGR Equation-of-State Representation of Adsorption on Wet, Mixed Tiffany Coals at 130 oF................................................................................................ 45 Table 21. LRC Model Representation of Binary Adsorption on Wet Tiffany Coals at 130 oF.............................................................................................................. 45 Table 22. LRC Model Predictions of Binary Adsorption on Wet Tiffany Coals at 130 oF ........................................................................................................... 46 Table 23. LRC Model Representation of Ternary Adsorption on Wet Tiffany Coals at 130 oF.............................................................................................................. 46 Table 24. LRC Model Predictions of Ternary Adsorption on Wet Tiffany Coals at 130 oF ......................................................................................................... 47 Table 25. ZGR EOS Representation of Mixtures on Tiffany Mixed Coal at 130 °F....... 48 Table 26. Sorption Fractional Uptake Correlation........................................................... 49 Table 27. Sorption-Time Estimates on Wet Tiffany Coal Samples at 130 oF for 63% Desorption....................................................................................................... 49
7
List of Figures Page Figure 1: Schematic Diagram of Adsorption Apparatus ................................... 51 Figure 2: Tiffany Well #1 Coal Particle Size Distribution.................................. 52 Figure 3: Tiffany Well #10 Coal Particle Size Distribution................................ 53 Figure 4: Tiffany Well #1 and Well #10 Coal Particle Size Distributions ............ 54 Figure 5: Pure Methane Absolute Adsorption on Tiffany Coal Samples at 130°F................................................................................... 55 Figure 6: Pure Gas Gibbs Adsorption on Tiffany Coals at 130°F ..................... 56 Figure 7: Pure Gas Absolute Adsorption on Tiffany Coals at 130°F ................. 57 Figure 8: Pure Nitrogen Absolute Adsorption on Tiffany Mixed Coal Sample at 130°F....................................................................... 58 Figure 9: Pure CO 2 Absolute Adsorption on Tiffany Mixed Coal Sample at 130°F................................................................................... 59 Figure 10: CO2 Absolute Adsorption on Tiffany Mixed Coal Sample Using Different Adsorbed-Phase Densities........................................... 60 Figure 11: Gibbs Adsorption of a 50/50 Mole % Methane/Nitrogen Feed Mixture on a Wet Tiffany Mixed Coal Sample at 130°F ................ 61 Figure 12: Absolute Adsorption for 50/50 Mole % Methane/Nitrogen Feed Mixture on a Wet Tiffany Mixed Coal Sample at 130°F ................ 62 Figure 13: Gibbs Adsorption of a 40/60 Mole % Methane/CO 2 Feed Mixture on a Wet Tiffany Mixed Coal Sample at 130°F ................ 63 Figure 14: Absolute Adsorption for 40/60 Mole % Methane/CO 2 Feed Mixture on a Wet Tiffany Mixed Coal Sample at 130°F ................ 64 Figure 15: Gibbs Adsorption of a 20/80 Mole % Nitrogen/CO 2 Feed Mixture on a Wet Tiffany Mixed Coal Sample at 130°F ................ 65 Figure 16: Absolute Adsorption for 20/80 Mole % Nitrogen/CO 2 Feed Mixture on a Wet Tiffany Mixed Coal Sample at 130°F ................ 66 Figure 17: Gibbs Adsorption of a 10/40/50 Mole % Methane/Nitrogen/ CO2 Feed Mixture on a Wet Tiffany Mixed Coal Sample at 130°F................................................................................... 67 Figure 18: Absolute Adsorption for 10/40/50 Mole % Methane/Nitrogen/ CO2 Feed on a Wet Tiffany Mixed Coal Sample at 130°F ............ 68 Figure 19: Fractional Uptake of Methane Desorption on Tiffany Well #1 Coal at 130°F ........................................................................... 69
8
Figure 20: Fractional Uptake of Methane Desorption on Tiffany Well #10 Coal at 130°F ........................................................................... 70 Figure 21: Fractional Uptake of Nitrogen on Tiffany Mixed Coal at 130°F......... 71 Figure 22: Fractional Uptake of CO 2 Adsorption on Tiffany Mixed Coal at 130°F....................................................................................... 72 Figure 23: Model Predictions of Absolute Adsorption for 50/50 Mole % Methane/Nitrogen Feed Mixture on a Wet Tiffany Mixed Coal Sample at 130°F ............................................................... 73 Figure 24: Model Predictions on Absolute for 40/60 Mole % Methane/CO 2 Feed Mixture on a Wet Tiffany Mixed Coal Sample at 130°F........ 74 Figure 25: Model Predictions of Absolute Adsorption for 20/80 Mole % Nitrogen/CO 2 Feed Mixture on a Wet Tiffany Mixed Coal Sample at 130°F....................................................................... 75 Figure 26: Model Predictions of Absolute Adsorption for 10/40/50 Mole % Methane/Nitrogen/CO 2 Feed on a Wet Tiffany Mixed Coal Sample at 130°F....................................................................... 76 Figure 27: Desorption Curve for Methane on Tiffany Well #1 Coal at 130°F....................................................................................... 77 Figure 28: Desorption Curve for Methane on Tiffany Well #10 Coal at 130°F....................................................................................... 78 Figure 29: Desorption Curve for Nitrogen on Tiffany Mixed Coal at 130°F........ 79 Figure 30: Adsorption Curve for CO 2 on Tiffany Mixed Coal at 130°F .............. 80 Figure 31: Liberated Gas from Tiffany Coal Samples: 2000 to 14.7 psia ......... 81
9
A. Executive Summary The major objectives of this project were to (a) measure the adsorption behavior of pure methane, nitrogen, CO 2 and their binary and ternary mixtures on wet Tiffany coal at 130°F and pressures to 2000 psia; (b) correlate the equilibrium adsorption isotherm data using the extended Langmuir model, the Langmuir model, the loading ratio correlation and the Zhou-Gasem-Robinson equation of state; and (c) establish sorption-time estimates for the pure components. Specific accomplishments are summarized below regarding the complementary tasks involving experimental work and data correlation. Experimental Work §
Representative coal samples from BP Amoco Tiffany Injection Wells #1 and #10 were prepared, as requested. The equilibrium moisture content and particle size distribution of each coal sample were determined. Compositional coal analyses for both samples were performed by Huffman Laboratories, Inc.
§
Pure gas adsorption for methane on wet Tiffany coal samples from Injection Wells #1 and #10 was measured separately at 130°F (327.6 K) and pressures to 2000 psia (13.7 MPa). The average expected uncertainty in these data is about 3% (9 SCF/ton). Our measurements indicate that the adsorption isotherms of the two coal samples exhibit similar Langmuir-type behavior. For the samples from the two wells, a maximum variation of about 5% in the amount adsorbed is observed at 2000 psia.
§
Gas adsorption isotherms were measured for pure methane, nitrogen and CO2 on a wet, mixed Tiffany coal sample. The coal sample was an equalmass mixture of coals from Well #1 and Well #10. The adsorption measurements were conducted at 130°F at pressures to 2000 psia. The adsorption isotherms have average expected experimental uncertainties of 3% (9 SCF/ton), 6% (8 SCF/ton), and 7% (62 SCF/ton) for methane, nitrogen, and CO2, respectively.
§
Adsorption isotherms were measured for methane/nitrogen, methane/CO 2 and nitrogen/CO 2 binary mixtures on wet, mixed Tiffany coal at 130o F and pressures to 2000 psia. These measurements were conducted for a single molar feed composition for each mixture. The expected uncertainties in the amount adsorbed for these binary mixtures vary with pressure and composition. In general, average uncertainties are about 5% (19 SCF/ton) for the total adsorption; however, the expected uncertainties in the amount of individual-component adsorption are significantly higher for the less-adsorbed gas at lower molar feed concentrations (e.g., nitrogen in the 20/80 nitrogen/CO 2 system).
§
Adsorption isotherms were measured for a single methane/nitrogen/CO 2 ternary mixture on wet, mixed Tiffany coal at 130 o F and pressures to 2000
10
psia. The nominal molar feed composition was 10/40/50. The average expected uncertainty for the total adsorption and CO 2 adsorption is about 5% (16 SCF/ton). However, the low adsorption of nitrogen and methane in this ternary yield average experimental uncertainties of 14% (9 SCF/ton) and 27% (9 SCF/ton), respectively. §
Limited binary and ternary gas-phase compressibility factor measurements at 130°F and pressures to 2000 psia involving methane, nitrogen, and CO 2 were conducted to facilitate reduction of our ternary adsorption data. These newly acquired data (and available data from the literature) were used to improve the Benedict-Webb-Rubin (BWR) equation-of-state (EOS) compressibility factor predictions, which are used in material balance calculations for the adsorption measurements. In general, the optimized BWR EOS represents the experimental compressibility factor data within 0.5% AAD.
Data Correlation §
The Langmuir/loading ratio correlation (LRC) and the Zhou-Gasem-Robinson (ZGR) two-dimensional EOS were used to analyze the newly acquired adsorption data. Model parameters were obtained for the systems studied.
§
The LRC and ZGR EOS were used to correlate the adsorption data for methane, nitrogen, and CO 2 and their mixtures on wet Tiffany coal. The model parameters were determined by minimizing the sum of squares of weighted errors in the calculated amounts of gas adsorbed. The results demonstrate the ability of the LRC and ZGR EOS to represent the total pure, binary and ternary systems within their expected experimental uncertainties. Specifically, representations with average absolute percentage errors (AAD) of 1-3% (2-15 SCF/ton), 1-8% (1-25 SCF/ton), and 2-10% (7-37 SCF/ton) were obtained for the pure, total binary, and total ternary adsorption isotherms, respectively. However, the quality of fit for the individual– component adsorption varies significantly, ranging from 3% for the moreadsorbed methane or CO 2 to 32% for the less-adsorbed nitrogen.
§
The LRC and ZGR EOS are capable of predicting binary adsorption isotherms based solely on pure-fluid adsorption parameters within twice their experimental uncertainties (1-50 %AAD, 5-40 SCF/ton). In comparison, the ternary predictions based on pure-fluid parameters yield three times the experimental uncertainties (4-56 %AAD, 2-60 SCF/ton). The quality of the model predictions indicate that although the two models are capable of predicting total adsorption isotherms adequately, they predict individualcomponent adsorption in mixtures poorly, especially when dealing with the less-adsorbed component of the mixture.
§
Sorption-time estimates for pure methane, nitrogen, and CO 2 were represented with average errors of about 8%.
11
B. Introduction The specific objectives of the adsorption measurements and correlations for BP Amoco Tiffany coal were to: §
Prepare representative coal samples from Injection Well #1 and Injection Well #10.
§
Determine (a) equilibrium moisture content, (b) particle size distribution, (c) compositional analyses, and (d) vitrinite reflectance analysis for each coal sample.
§
Measure the adsorption behaviors of pure methane, nitrogen, CO 2 and their binary and ternary mixtures on a Tiffany equal-mass, mixed-coal sample from Injector Wells #1 and #10 at 130°F and pressures to 2000 psia. The nominal molar feed compositions for the methane/nitrogen, methane/CO 2, and nitrogen/CO 2 binary mixtures were specified at 50/50, 40/60, and 20/80, respectively. The nominal molar feed composition for the methane/nitrogen/CO 2 ternary mixture was 10/40/50.
§
Correlate the equilibrium adsorption isotherm data using the extended Langmuir model, the Langmuir model, the loading ratio correlation and the Zhou-Gasem-Robinson equation of state.
§
Establish sorption-time estimates for the pure components.
C. Experimental Work 1. Experimental Facility The experimental apparatus was developed in previous work for Amoco Corporation and the Oklahoma Center for the Advancement of Science and Technology. As a precursor to the present data acquisition, the apparatus was thoroughly re-tested and revised as necessary. The equipment is described in detail elsewhere [1,2]. Recently, we enhanced our experimental facility to include the ability to measure adsorption kinetics for systems encountered in coalbed methane production and sequestration of CO2. Brief descriptions of experimental methods and procedures are given in the following section. 2. Experimental Methods and Procedures (a) Adsorption Measurements Our experimental technique employs a mass balance method, utilizing volumetric accounting principles. The experimental apparatus, shown schematically in
12
Figure 1, has been used successfully in previous measurements [1, 2]. Brief descriptions of the experimental apparatus and procedures follow. The entire apparatus (both Pump and Cell sections) is maintained in a constant temperature air bath. The equilibrium cell (EC, Figure 1) is filled with the coal to be studied, and the cell is placed under vacuum prior to gas injection. The void (gas) volume, V void, in the equilibrium cell is then determined by injecting a known quantity of helium from a calibrated injection pump. Since helium is not adsorbed, the void volume can be determined from measured values of the temperature, pressure and amount of helium injected into the cell. The void volume equations are V void = n He (ZHeRT /P) cell (1)
n He = (PV/ZHeRT) pump (2) In these equations, nHe is the number of moles of helium injected into the cell, V is the volume of gas injected from the pump, ZHe is the compressibility factor of helium, R is the universal gas constant, T is the temperature, P is the pressure, and the subscripts "cell" and "pump" refer to conditions in the cell and pump sections of the apparatus, respectively. The amount of gas (methane, for example) adsorbed at a given pressure can be calculated based on the preliminary calibrations done above. First, a given quantity of methane, ninj, is injected into the cell. This amount is determined by an equation analogous to Equation 2, above. A magnetic recirculating pump is used to circulate methane over the adsorbent until equilibrium is reached, where no further methane is adsorbed. The amount of unadsorbed methane, nunads , is then determined based on the fact that any unadsorbed methane will remain in the void volume (determined from the helium calibration). The expression for this quantity is n unads = (PVvoid /Z methaneRT) cell (3) where the pressure P is measured after equilibrium is reached in the cell. In addition, we estimate the amount of gas dissolved in water, ndis, using correlations for gas solubility [2] . The amount of adsorbed methane, nads , is then calculated by difference as
n ads = n inj - n unads − n dis (4) These steps are repeated at sequentially higher pressures to yield a complete adsorption isotherm. In mixture studies, a gas mixture of known composition is injected, so the total amount of each gas fed into the cell is known. The amount of unadsorbed gas at each pressure is calculated by Equation 3 with Zmethane replaced by Zmix, the gas
13
mixture compressibility factor. The composition of the gas mixture in the void volume is determined by chromatographic analysis using a microliter-size sample captured in a sampling valve (SV1). This permits the total amount of unadsorbed gas to be apportioned among the various components according to their mole fractions in the gas. Equation 4 can be then applied to each component in the gas mixture. For methane/nitrogen/CO 2 mixtures, the mixture Z factors (Zmix) are determined accurately from the BWR EOS, as described below. The estimated uncertainties in each of the experimentally measured quantities are as follows: temperature 0.2°F, pressure 1.0 psia, injected gas volumes 0.02 cc, bulk gas-phase composition 0.001 in mole fraction. The expected uncertainties in the amount adsorbed are estimated using error propagation in all the measured variables and confirmed by replicate runs. Compressibility Factors As indicated by Equations 1-3, accurate gas-phase compressibility (Z) factors are required for methane, nitrogen and carbon dioxide and their mixtures to properly analyze our experimental adsorption data. The compressibility factors for pure methane, nitrogen and CO 2 were determined from highly accurate equations of state [3-5]. However, a careful evaluation of the current literature led us to conclude that an adequate predictive capability for the mixture Z factors does not exist. Therefore, we elected to develop such a capability using the BenedictWebb-Rubin (BWR) equation of state. Specifically, we used available pure-fluid and binary mixture data to refit the BWR equation and improve its accuracy significantly; in general, the new BWR EOS parameters yield deviations in the Z factor within 0.2%. This allowed us to address our compressibility factor needs for binary adsorption mixtures. To facilitate our ternary adsorption measurements, we conducted a limited number of binary and ternary compressibility factor measurements involving methane, nitrogen, and CO 2 at 130°F and pressures to 2000 psia. These newly acquired data and available data from the literature were used to improve the BWR EOS compressibility factor predictions. In general, the optimized BWR EOS represents the compressibility factor data within 0.5% AAD [11]. Relationship between Gibbs and Absolute Adsorption By definition, Gibbs adsorption considers the gas-phase volume as the sum of the gas (Vgas ) and adsorbed phase (Vads ) volumes (ignoring the reduction in gasphase volume due to presence of the adsorbed phase.) Expressing Gibbs adsorption in terms of vapor volume (Vgas ) and adsorbed-phase volume (Vads ), and using the specific molar volume (vgas and vads ), we obtain:
Vgas + Vads n Gibbs = ninj − (5) ads v gas
14
For absolute adsorption, the amount adsorbed within the equilibrium cell is given as:
Vgas n Abs (6) ads = ninj − v gas By combining Equations 5 and 6, the Gibbs adsorption expression can be rewritten as:
Vads Abs n ads = n Gibbs + (7) ads v gas Since
Vads = n Abs ads v ads
and
v ads =
1 ρ ads
Then
n
Abs ads
n Gibbs ads .(8) = ρ gas 1 − ρ ads
where ρ is density. At low pressures, the density-ratio correction is negligible, but at higher pressures it becomes significant. A common approximation for the density of an adsorbed phase is to use the liquid density at the atmospheric pressure boiling point, as done by Yee [6]. However, more accurate estimates for the adsorbed-phase density are required when the adsorbed-phase density approaches the bulk gas density. For multicomponent systems, the adsorbed-phase density, ?ads , in Equation 8 is replaced with the mixture adsorbed-phase density, which is assumed to be the adsorbed mole fraction weighted average of the pure-component phase volumes (1/ ρ ads,i ), i.e.:
ρ ads =
1 (9) x iAbs ∑ρ ads,i
Component Absolute Adsorption The component mole fraction in the adsorbed phase, x iAbs , is calculated based on the following derivation. Note that abbreviated subscripts are used for volumes to simplify documentation (g=gas, a=ads, and c=void). 15
n inj (i) =
Vg vg
yi +
Va Abs x i (10) va
Since
Vc = Vg + Va = Vvoid and substituting for n Abs ads then Gibbs (Vc − Va ) n ads n inj (i) = yi + v a v g 1 − v g
x Abs (11) i
Gibbs n V V n inj (i) = c y i − a y i + ads va vg vg 1 − v g
x Abs (12) i
or
Noting that
n Gibbs = ads
Va va
v a Va Va , − 1 − = v g v a v g
which upon rearrangement leads to
Va n Gibbs = ads v g va 1 − vg
− n Gibbs ads
1 = 1 − v a v g
v a Gibbs v g Gibbs n ads − 1 n ads = v a 1 − v g
Therefore, Equation 12 becomes
v a V vg n inj (i) − c y i = − vg 1 − v a v g
n Gibbs Gibbs n ads y i + ads x iAbs (13) va 1 − v g 16
or v ninj(i) − Vc y i 1 − v a = x Abs (14) − y i a nGibbs i v ads v g v g g
By definition
x
Gibbs i
nGibbs (i) = adsGibbs n ads
Then
n inj (i) − Vc y i v g Gibbs xi = n Gibbs ads Then Equation 14 can be written as
va 1 − = x iAbs − y i v a x Gibbs i vg vg
(15)
For a binary system, Equation 15 becomes two equations:
v v x 1Gibbs = x 1Abs + (x1Gibbs − y 1 ) a1 x 1Abs + a2 x 2Abs (16) vg v g and
v v x Gibbs = x Abs + (x Gibbs − y 2 ) a1 x 1Abs + a2 x Abs 2 2 2 2 (17) vg v g Given the Gibbs adsorbed-phase compositions ( x 1Gibbs, x Gibbs ) and the 2 experimental gas-phase compositions (y 1, y 2 ), absolute adsorbed-phase compositions are obtained by solving Equations 16 and 17 simultaneously. Once these compositions are obtained, the absolute adsorption of each individual component is calculated as follows: Abs n ads (i) = x iAbs n Abs ads (18)
(b) Determination of Coal Particle Size Distribution A sieve analysis was use to determine the macro-particle size distribution. A series of meshes was selected: They were No. 3.5, 8, 10, 12, 20, 30, 40, 50 and 17
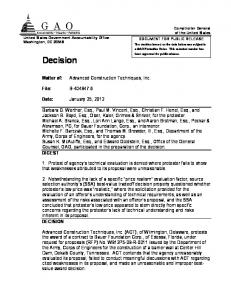
60 with respective openings of 5.66, 2.38, 2.00, 1.70, 0.85, 0.60, 0.425, 0.300, 0.250 mm. The analysis was performed on a pre-weighed in-situ coal sample. The sieves were stacked in order of mesh size. After sufficiently shaking the sample, we measured the weight of the contents remaining in each sieve to determine the respective proportion of the coal particle size distribution. (c ) Determination of Coal Moisture Content A pre-weighed, as-received wet coal sample was placed into a pre-weighed container. The container was subjected to a continuous vacuum in a 215-220°F oven. Vacuum was applied overnight to remove moisture. After the moisture was removed, the container was re-weighed, and the difference was assumed to be from the moisture loss. Another wet sample was placed on a flat pan in a 35.0°C air atmosphere at 9799% relative humidity. The sample weight was determined periodically to gauge the constancy of weight, which indicates the approach of the sample to equilibrium moisture content. Once a constant sample weight was achieved, the sample was assumed to be at its “equilibrium moisture content” or EMC. The equilibrium sample was then placed in a continuous vacuum at 215-220°F. The moisture loss determined by weight difference was used to calculate the EMC. For the Tiffany samples considered in this study, the moisture content of the as-received samples was found to be higher than the EMC. (d) Sorption-Time Measurements for Pure Gases To facilitate sorption-time measurements, an analog acquisition card was installed in our pressure console. Thus, a graphic representation of how pressure varies with time can be displayed in real time using conventional Excel tools. Temperature was also measured by a thermocouple and sent to an analog converter and then to the analog computer acquisition board. A desorption step is initiated by reducing the equi librium pressure of the adsorbed gas. This adsorption pressure reduction is accomplished by opening a valve connecting the equilibrium cell (where the coal sample is in contact with the adsorbate) to the injection pump, which is set at lower pressure. The valve between the cell and injection pump is opened as quickly as possible to simulate a step change in pressure. The coal sample then desorbs its gas, and the pressure rises from the initial desorption pressure (P0) to a new equilibrium pressure (Pf). The pressure at any given time (Pt) is monitored and recorded along with time (t) by the data acquisition module. Thus, the sorption-time estimates are generated from the desorption-time increment involving P0 and Pf, as depicted by the illustration below. The pressure fractional uptake, Λ, is defined as:
18
Λ = ( Pt − P0 ) /(Pf − P0 ) (19) Here P0 is the initial desorption pressure, Pf is the final desorption pressure, and Pt is the pressure at time t. Typically, a scaled-time plot produces a generalizeable desorption profile for different equilibrium pressures.
An Illustration for the Pressure Profile of a Desorption Sequence
10
Psys
P sys : System Pressure Prior to Desorption Po : Initial Desorption Pressure Pf : Final Desorption Pressure
8
Pressure
6
Pf
4
2
Po____ 0
-2 -100
-50
0
50
100
150
200
Time
An alternative representation for the adsorption kinetics may be expressed in terms of sorption fractional uptake, defined as:
Θ = (ωt − ω0 ) /(ωf − ω0 ) = ( VSCF t − VSCF 0 ) /(VSCF f − VSCF 0 ) (20) where ω is the amount of gas adsorbed, and VSCF is the corresponding volume at the standard conditions. If a Langmuir-type model is used to correlate the equilibrium sorption data, then Equation 20 can be rewritten as: 1 + BPf (21) Θ = Λ 1 + BP t
where B is the Langmuir constant regressed from sorption experimental data. D. Data Correlation The newly acquired adsorption data on the Tiffany coal samples were correlated using (a) the extended Langmuir model, (b) the loading ratio correlation, and (c)
19
the Zhou-Gasem-Robinson (ZGR) two-dimensional equation of state. Following is a brief description of the models used. An assessment for the quality of their representation and prediction of the present pure and mixture Tiffany coal data is presented in Section E. (a) Langmuir/Loading Ratio Correlation Historically, simple models have been used to represent the behavior of pure and mixed gas adsorption on coal. The extended Langmuir model is used almost exclusively in literature studies [e.g., 6], although the Ideal Adsorbed Solution (IAS) model has also been employed [7, 8]. Both of these models work well for essentially ideal adsorbed solutions, but neither is capable of handling nonidealities in the adsorbed phase with any accuracy. The extended Langmuir model is shown below as an illustration of the simple modeling approach used in most previous studies. For mixtures, it takes the form θi =
ωi B i Py i = (22) L i 1 + ∑ B j Py j j
where ω i is the amount of component "i" adsorbed (SCF of "i" adsorbed per ton of coal), Li and Bi are Langmuir constants for "i", P is pressure, and yi is the mole fraction of "i" in the gas phase. This relation allows mixture adsorption to be predicted from pure-component data, since values of Li and Bi may be determined from the pure-component form of Equation 22. For pure-fluid adsorption, Equation 22 reduces to the Langmuir model:
θ=
ω BP = (23) L 1 + BP
The combined Langmuir-Freundlick adsorption isotherm, expressed in terms of ω i, yields the loading ratio correlation (LRC) for mixtures: θi =
ωi ( B i Py i ) ηi = (24) L i 1 + ∑ (B j Py j ) η j j
The additional parameter (ηi) in the LRC lends the Langmuir model more flexibility. Although the simplicity of Langmuir models is attractive, our data show that they are inadequate to represent the behavior of mixtures of the gases CO 2, methane, and nitrogen. In fact, previously we found errors greater than 100% when the extended Langmuir model was applied to our data on the adsorption of nitrogen from nitrogen + CO 2 mixtures [2].
20
(b) ZGR Equation of State Simulations of coalbed gas recovery and CO 2 sequestering require reliable, yet simple, analytic models beyond Langmuir-type correlations. Equation-of-state (EOS) frameworks offer an attractive potential for such requirements. A general two-dimensional EOS can be written as follows [9]:
[
]
αω2 A 1 − (βω)m = ωRT (25) π + 2 1 + Uβω + W (βω) where A is the specific surface area, π is the spreading pressure, ω is the specific amount adsorbed, and α, β and m are model parameters. The model coefficients, U, W, and m must be specified to obtain a specific form of the 2-D EOS for application. For example, an analog of the van der Waals (VDW) EOS is obtained by setting m = 1 and U = W = 0; similarly for the Soave-RedlichKwong (SRK) (m = U = 1 and W = 0); the Peng-Robinson (PR) (m = 1, U = 2, and W = -1); and the Eyring (m = 1/2 and U = W = 0) EOS. This general 2-D EOS can be used to investigate EOS behaviors by specifying various combinations of model coefficients. Selection of the model coefficient m is the most important among the EOS model coefficients, because it has a significant effect on the shape of the pure adsorption isotherm. If U and W are equal to zero, then by setting m to values of ∞, 1, and 1/2, we obtain the 2-D ideal gas law, the VDW EOS, and the Eyring EOS, respectively. Actually, the pure gas isotherms vary considerably in shape and we have found that it is sometimes desirable to select an m value even smaller than 1/2 to describe pure isotherms. We have determined that an equation with m = 1/3 and U = W = 0 (the ZGR EOS) is promising [9]. The 2-D EOS can be applied to adsorbed phases containing mixtures by utilizing the traditional mixing rules (where x is the mole fraction in the adsorbed phase):
α = ∑∑ x i x j α ij (26) i
j
β = ∑∑ x i x jβ ij (27) i
j
along with the non-traditional combination rules [9], α ij = (1 − Cij )(α i + α j ) / 2 β ij = (1 + Dij ) β iβ j
(28)
where Cij and Dij are the EOS binary interaction parameters. 21
E. Results and Discussion 1. Experimental Data (a) Comparison of Tiffany Coal Samples Coal characterization measurements are presented in Tables 1-3 and Figures 24. Table 1 presents the compositional analyses for coal samples from Wells #1 and #10. Table 2 and Figures 2-4 present the coal particle size distribution for the two samples. The analyses indicate that the two coal samples are similar in composition and particle size distribution. The density of the compact solid coal is called the coal helium density, in reference to the helium displacement measurements used to determine the adsorbent density [10]. We have measured the coal helium densities for Well #1, Well #10, and the mixed sample. They are 1.73, 1.57, and 1.67±0.07 g/cc, respectively. The equilibrium moisture content of Well #1 coal sample is 3.8±0.2% and the equilibrium moisture content of Well #10 coal sample is 3.7±0.2%. Vitrinite reflectance analyses conducted by National Petrographic Services indicate that the present Tiffany coal samples are medium volatility bituminous coal. As summarized in Table 3, Wells #1 and 10 have average oil-based vitrinite reflectance values of 1.31 and 1.35, respectively. Initial methane adsorption isotherms were measured separately for Wells #1 and #10. Results are presented in Tables 4 and 5 (on moisture-free and ash-free bases) and Figure 5. They indicate that the adsorption capacities of samples from the two wells are comparable with a maximum variation of 5% in the amount adsorbed at 2000 psia. Because of the similarity in the methane adsorption behavior for Tiffany Well #1 and Well #10 coal samples, and upon agreement with BP Amoco personnel, coal samples from the two wells were mixed on an equal-mass basis. Large chunks of coal (dime-size) were broken up and the coal mixture was gently shaken to ensure a final homogenous mixture. The coal samples were placed into a tightlycapped jar. Helium was injected into the jar to prevent oxidation of the coal. (b) Adsorption Isotherms Pure Gas Adsorption Gas adsorption measurements for pure methane, nitrogen and CO 2 were conducted on wet Tiffany coal samples at 130 oF and pressures to 2000 psia. Our error analysis indicates that the average uncertainties for the methane, nitrogen, and CO 2 adsorption measurements are approximately 3% (9 SCF/ton), 6% (8 SCF/ton) and 7% (62 SCF/ton), respectively. These estimates, which are 22
depicted as error bars in some of the figures, were generated by error propagation of uncertainties in all measured quantities. The repeated isotherms confirm the estimated precision of the measurements. The adsorption data are presented in Tables 4-8 and Figures 5-10. Figure 6 presents the Gibbs adsorption isotherms for methane, nitrogen, and CO2, respectively. The absolute adsorption data for these gases are presented in Figures 7-10. In this study, unless otherwise noted, we use the adsorbed-phase density approximation suggested by Yee [6]. For nitrogen, methane, and CO 2, densities of 0.808, 0.421, and 1.18 g/cm3, respectively, were used to convert the Gibbs to absolute adsorption. Tables 4 and 5 present isotherms for methane on Well #1 and Well #10 coal samples, respectively. Replicate runs were conducted to confirm our measurements. These measurements show good agreement between the replicate runs, which yield an expected uncertainty of about 5%. A four-point adsorption isotherm was measured on the Tiffany mixed coal sample, as presented in Table 6. As expected, the mixed coal sample produced an intermediate adsorption capacity; i.e., it shows less adsorption than the Well #1 coal sample and more than the Well #10 sample. The replicate runs for methane (Figure 5 and Tables 4-6) show good agreement. The average expected uncertainty for these measurements is approximately 3% (9 SCF/ton), as depicted by the error bars in Figure 5. (Notice that error bars are included only for one run). The adsorption isotherm for pure nitrogen on the mixed Tiffany coal sample is presented in Table 7 and Figure 8. As indicated by Figure 8, no significant differences exist between the replicate runs. The average expected uncertainty for these measurements is approximately 6% (8 SCF/ton). Similarly, adsorption isotherm measurements for pure CO 2 on wet Tiffany mixed coal sample are given in Table 8 and Figure 9. The replicate runs show reasonable agreement with an average expected uncertainty of about 7% (62 SCF/ton). Both methane and nitrogen adsorption measurements on Tiffany coal indicate lower adsorption capacity than the adsorption on the Fruitland coal reported previously [1]. The measurements on Tiffany coal are about one half that on Fruitland coal at the same conditions. This difference might be due to variations in coal composition. Ash content in Tiffany coal is about twice that of the Fruitland coal. In contrast, the carbon content in Tiffany coal is about two thirds that in Fruitland coal. Nevertheless, the new measurements agree with the previous ones in the relative amounts of nitrogen, methane and CO 2 adsorbed, which are in the approximate ratio of 1 : 2.7 : 5 at 1000 psia. As previously reported [1], a slightly different moisture content in each measurement set indicates that water content values beyond the equilibrium water content have no significant effect the adsorption behavior. In contrast, the 23
adsorbed-phase density estimates may affect the calculated absolute adsorption isotherm. Figure 10 illustrates the effect of variation in the adsorbed-phase density on the CO 2 absolute adsorption. Here, three estimates are used: (1) the triple point liquid density (1.18 g/cm3), (2) the ZGR model estimate (1.25 g/cm3), and (3) a graphical estimate based on the Gibbs adsorption isotherm (1.40 g/cm3). Differences in the calculated adsorption increase with pressure, rising to as much as 15% at 2000 psia. Binary Mixture Adsorption Adsorptions isotherms were measured for methane/nitrogen, methane/CO 2 and nitrogen/CO 2 on wet, mixed Tiffany coal at 130 oF and pressures to 2000 psia. The measurements were conducted at one feed composition for each mixture. The expected uncertainties in the amount adsorbed for these binary mixtures vary with pressure and composition. In general, percent average uncertainties are below 5% (19 SCF/ton) for total adsorption; however, the expected uncertainties in the amount of individual-component adsorption are significantly higher for the less-adsorbed gas at lower molar feed concentrations (e.g., nitrogen in the 20/80 nitrogen/CO 2 system). Mixture absolute adsorption estimates were calculated assuming ideal-solution additive volumes in the condensed phase (i.e., the mixture volume is the molefraction-weighted average of the pure component volumes). The traditional values of 0.808 g/cm3, 0.421 g/cm3, and 1.18 g/cm3, were used to estimate the adsorbed-phase density of methane, nitrogen, and CO 2, respectively. Table 9 and Figure 11 present the experimental data for methane/nitrogen adsorption at the nominal molar feed composition of 50% methane. In general, the average expected uncertainties in the amount of individual-component adsorption are 7% (13 SCF/ton) for methane, and 17% (8 SCF/ton) for nitrogen. The total adsorption has estimated uncertainties of 7% (15 SCF/ton). Figure 12 presents the absolute adsorption for this binary system, including predictions from the LRC and ZGR models. As shown in Figures 11 and 12, methane is more strongly adsorbed than nitrogen. Table 10 and Figure 13 present the experimental data of methane/CO 2 adsorption at a nominal molar feed composition of 40% methane. The average expected uncertainties in the amount of individual-component adsorption are 7% (10 SCF/ton) for methane, and 6% (17 SCF/ton) for CO 2. The total adsorption has estimated uncertainties of 4% (20 SCF/ton). Figure 14 presents the absolute adsorption of this system, which indicates that the amount of CO 2 adsorbed is almost three times that observed for methane. Table 11 and Figure 15 present the experimental data of nitrogen/CO 2 adsorption at the nominal molar feed composition of 20% nitrogen. A small amount of nitrogen is adsorbed at this feed composition. This results in higher uncertainties for the nitrogen component adsorption, which could be around 29% (8 SCF/ton). 24
In comparison, the CO 2 component adsorption has estimated uncertainties 6% (23 SCF/ton), and the total adsorption has estimated uncertainties of 5% (22 SCF/ton). Figure 16 presents the absolute adsorption of this binary system, which indicates that the amount of CO 2 adsorbed is almost 20 times that observed for nitrogen. Ternary Mixture Adsorption The ternary adsorption of methane/nitrogen/CO 2 on wet, mixed Tiffany coal at 130 oF and pressures to 2000 psia was conducted at 10/40/50 mole % feed composition. Table 12 and Figure 17 present the excess Gibbs adsorption data for this mixture, and Figure 18 depicts the absolute adsorption isotherms. The average expected uncertainty for the total adsorption and CO 2 adsorption is about 5% (17 SCF/ton). However, the low adsorption of nitrogen and methane in this ternary yielded experimental uncertainties of 14% (9 SCF/ton) and 27% (9 SCF/ton), respectively. The absolute adsorption data for this ternary were generated using the same procedure used for the binary mixtures. (c ) Sorption-Time Estimates for Pure Gases Tables 13-16 present the desorption data for pure methane, nitrogen and CO 2, respectively. The tables provide a record for a number of desorption runs for each gas off the Tiffany coal samples, where values for the initial desorption pressure, final desorption pressure and the time of desorption are given. In addition, information is shown for the 90% pressure fractional uptake, Λ; and the 63% sorption fractional uptake, Θ. Figure 19 presents three methane desorption runs for the Well #1 coal sample. Similarly, Figure 20 presents two methane desorption runs for Well #10 coal sample. The results for three nitrogen runs and six CO 2 desorption runs off the Tiffany mixed coal sample are given in Figures 21 and 22, respectively. Other runs for the various gases, which are not included, show the same trend. For the Well #1 coal sample, the sorption time at 90% pressure uptake for methane varies from 8 minutes to 140 minutes depending on the pressure. For the Well #10 coal sample, the 90% sorption time for methane varies from 4 minutes to 50 minutes depending on the pressure. Accordingly, methane desorption on Well #10 coal is faster than on Well #1 coal. Moreover, desorption at higher pressures is faster than desorption at lower pressures. Similar trends for the effect of pressure on sorption time are observed for nitrogen and CO2 on the Tiffany mixed coal sample.
25
2. Data Correlation and Model Evaluation (a) Adsorption Isotherms The data correlation and model evaluation effort undertaken here addresses two important issues: (a) the ability of the LRC and ZGR EOS to correlate or represent the acquired adsorption data, and (b) the ability of the two models to predict the binary and ternary mixture adsorptions. Thus, beyond establishing the model precision in summarizing existing data, we are also interested in evaluating the efficacy of such models in using pure and/or binary measurements to provide accurate predictions for ternary and other multicomponent mixtures. Accordingly, in the following discussion two case studies are considered. First, we evaluate model representations of the Tiffany adsorption data, where the model parameters (L, B, and η for the LRC; α, β, Cij, Dij for ZGR EOS) are regressed to correlate the data considered and to establish the quality of precision attainable for the present models. Next, we examine binary model predictions based on pure-fluid parameters, and ternary predictions based on pure or a combination of pure and binary parameters. The following weighted-error objective function was used to regress model parameters: ωcalc − ωijexp t ij SS = ∑∑ t σ exp i j ij
2
i=1, NPTS; j=1, NC (29)
Here, j and i are component and data point indices, respectively, NC the total number of components in the mixture, NPTS the total number of data points, and t σ exp is the expected experimental uncertainty for the individual data point. The ij root-mean-square error (RMSE) and the %AAD for the individual isotherms, calculated as NPTS
RMSE =
∑ (ω
calc i
t 2 − ωexp ) i
i
NPTS NPTS
%AAD = 100 ∑ i
t ω calc − ωexp i i t ωexp i
were used to express the quality of fit in our model evaluations. expressions were used for the overall fit.
26
Similar
Pure Adsorption Tables 17-20 present a summary of our model evaluation results for the three models used to correlate the present adsorption data for methane, nitrogen, and CO2. The model parameters, shown in Tables 17-20, were determined by minimizing the sum of squares of weighted errors in the calculated adsorption, ω, for the pure gas of interest (Equation 29). Table 17 presents the results for the Langmuir model. AADs of 2 to 4% (4-17 SCF/ton) were obtained for the systems considered. Table 18 presents the results for the LRC using system-specific pressure exponents (ηi). The results indicate that the LRC produces better quality fit than the Langmuir correlation for the three gases studied. This in part reflects the added flexibility gained by the additional parameter ηi in the regressions. AADs of 1 to 2% (2-12 SCF/ton) were observed for the systems considered. When a common pressure exponent (ηi) was forced on the model, a value of 0.90 was obtained. Table 19 presents the results of this LRC using the common exponent, which yielded an AAD of 1-2% (2-12 SCF/ton). Table 20 presents a summary of our model evaluation results for ZGR EOS. These results reveal the ability of the ZGR EOS to represent the adsorption of CO2, methane and nitrogen on Tiffany coals within their expected experimental uncertainties. Similar to the LRC results, fits with 2 to 3% AAD (3-15 SCF/ton) were obtained. Figures 7-10 illustrate the abilities of the LRC and ZGR models to describe the present pure-fluid adsorption data. Binary Mixture Adsorptions Figures 12, 14, and 16 present the LRC representations of the binary absolute adsorption data. The LRC parameters generated for these mixtures and the model statistics are given in Table 21. In general, AADs of 1-10% (1-19 SCF/ton) are observed for the individual-component adsorption. However, an AAD of 32% (11 SCF/ton) was obtained for the nitrogen adsorption in the nitrogen/CO 2 mixture adsorption. Table 22 summarizes the results for the LRC predictions based on pure-gas adsorption data. As shown in this table, the LRC model predicts the methane/nitrogen and methane/CO 2 binary adsorptions within the experimental uncertainties (2-21%, 5-42 SCF/ton) using pure-fluid adsorption parameters; however, the model predictions for the nitrogen/CO 2 binary are less accurate (AAD of 39% or 14 SCF/ton for the nitrogen adsorption). Moreover, variation of the pressure exponent η does not significantly change the results. Figures 23-25 illustrate the quality of the LRC predictions for the binary mixtures.
27
Table 25 presents a summary of the evaluation results for ZGR EOS, where various binary parameter regressions have been considered. The results indicate that using two interaction parameters (Cij and Dij) leads to the best overall fit for the Tiffany coal adsorption data. Representations within the expected experimental uncertainty (AAD of 3-15%, 3-33 SCF/ton) are obtained for the three binaries. Figures 12, 14, and 16 illustrate the abilities of the ZGR EOS to describe the present binary mixture adsorption data. In most cases, the ZGR and LRC give comparable results, with slightly better statistics for the LRC. In addition, Table 25 summarizes the results for the ZGR predictions based on pure-gas adsorption data. As shown in this table and Figures 23-25, the ZGR EOS predicts the binary adsorption isotherms of methane/nitrogen and methane/CO 2 within twice the experimental uncertainty (about 1-27%, 5-35 SCF/ton). Significantly higher deviations, however, are observed for the lessadsorbed nitrogen (up to 49% AAD, 13 SCF/ton) in the nitrogen/CO 2 binary. Ternary Mixture Adsorption Figure 18 presents the LRC representations of the ternary adsorption data. The LRC parameters generated for this mixture and the model statistics are given in Table 23. AAD of 3-12% (4-17 SCF/ton) are observed for the individual adsorption, and 3% (16 SCF/ton) for the total adsorption. The results suggest that the quality of fit is directly related to the amount adsorbed. The predictive capability of the LRC is examined in Figure 26 and Table 24. In this case, the LRC model parameters obtained from the pure adsorption were used to predict the ternary mixture adsorption on wet Tiffany coal. Poor model predictions were obtained for this ternary when only pure-adsorption data are utilized in model optimization. AAD of 5-45% (2-55 SCF/ton) were observed for the individual-component isotherms. This translates roughly to prediction errors within one to four times the expected experimental uncertainty. Variation in the pressure exponent ? did not alter the results significantly. Table 25 presents a summary the evaluation results for ZGR EOS, which indicate the ability of the ZGR EOS to predict the methane/nitrogen/CO 2 ternary adsorption isotherms within three times their expected experimental uncertainties (4-56% AAD, 5-52 SCF/ton). The ZGR representations using binary interaction parameters (Cij, Dij) are comparable to those obtained by the LRC using the same amount of input data. The ZGR binary interaction parameters generated for this mixture are also given in Table 25. The predictive capability of the ZGR EOS is examined in Figure 26 and Table 25. The ZGR predictions based on pure ( αi, βi, ln ki) and binary (Cij, Dij) parameters are within three times the experimental uncertainty (10-32% AAD, 549 SCF/ton). However, the results indicate that for the present mixtures little improvement is realized by predicting the individual-component ternary isotherms
28
based on parameters generated from both pure and binary adsorption data. Further, the quality of the model predictions indicate that although the LRC and ZGR EOS are capable of predicting total adsorption isotherms adequately, they predict the individual-component isotherms poorly, especially when dealing with the less-adsorbed component of the mixture. In fact, diminishing the influence of the less-adsorbed components on the parameter regressions, by using a leastsquares (un-weighted) objective function, improves the ternary model predictions based on pure and binary data. These results suggest significant model improvements are required to realize the expected benefit of improving multicomponent predictions using binary adsorption measurements. (b) Sorption-Time Estimates for Pure Gases An empirical correlation was used to represent the sorption fractional uptake, Θ: Θ=
βt α 1 + βt α
(30)
where α = (aP 2 + bP + 0.5)c
The coefficients β, a, b and c are regressed from sorption time data [8]. For the systems considered in this study, Equation 30 represents the sorption-time estimates on average within 8%. Table 26 lists the regressed parameters for the gases considered, and Figures 27-30 present the correlated sorption curves for methane, nitrogen and CO 2, respectively. Table 27 and Figure 31 present time estimates for liberated gas off the Tiffany coal samples. The plot indicates that CO 2 has the fastest sorption time followed by nitrogen and methane. Moreover, the sorption time for the three gases is within 12 minutes for 63% adsorbed-gas liberation.
29
F. Conclusions §
Characterizations of BP Amoco Tiffany coal samples from Injection Wells #1 and #10 were done. Results for (a) particle size distribution, (b) composition, (c) equilibrium moisture content, and (d) vitrinite reflectance indicate similarity of the two samples.
§
The vitrinite reflectance analysis indicates that the samples represent medium volatility bituminous coals.
§
Adsorption isotherms for pure methane on the two wet Tiffany coal samples (Wells #1 and #10) at 130°F and pressures to 2000 psia confirmed the similarity of the two samples.
§
Adsorption isotherms were then measured for pure methane, nitrogen and CO2 on a mixed Tiffany coal sample. The coal sample was an equal-mass mixture of coals from Well #1 and Well #10. The adsorption measurements were conducted at 130°F and pressures to 2000 psia. The adsorption capacity of the mixed sample is intermediate to that observed for Well #1 and Well #10 samples. The pure adsorption data have average expected experimental uncertainties of 3% (9 SCF/ton), 6% (8 SCF/ton) and 7% (62 SCF/ton) for methane, nitrogen, and CO 2, respectively.
§
Sorption times were measured for pure methane, nitrogen and CO 2. The measurements were correlated using a Langmuir-type equation, which yielded average errors within 8%.
§
Binary adsorption of methane/nitrogen, methane/CO 2 and nitrogen/CO 2 on a wet Tiffany mixed coal at 130 oF and pressures to 2000 psia were measured at one feed composition for each mixture. The expected uncertainties in the amount adsorbed for these binary mixtures vary with pressure and composition. In general, percent average uncertainties are about 7% (19 SCF/ton) for total adsorption; however, the expected uncertainties in the amount of individual-component adsorption are significantly higher, especially at lower feed gas mole fractions (i.e., nitrogen in the nitrogen/CO 2 system at 20/80 mole % feed composition).
§
Ternary adsorption was measured for methane/nitrogen/CO 2 on a wet Tiffany mixed coal at 130 oF and pressures to 2000 psia for a 10/40/50 mole % feed composition. The average expected uncertainty for the total adsorption and CO2 adsorption is about 5% (17 SCF/ton). However, the low adsorption of nitrogen and methane in this ternary yielded experimental uncertainties of 14% (9 SCF/ton) and 27% (9 SCF/ton), respectively.
§
Our newly acquired compressibility factor measurements for mixtures of methane/nitrogen/CO 2 allowed us to optimize the BWR EOS to predict accurately the Z factors required for use in reduction of our mixture adsorption data.
30
§
The total adsorption data can be correlated within their experimental uncertainties by the loading ratio correlation (LRC) and the 2D Zhou-GasemRobinson (ZGR) equation of state (EOS).
§
The present results suggest that both the LRC and ZGR EOS are capable of predicting binary adsorption isotherms based on pure-fluid adsorption parameters within twice their experimental uncertainties. In comparison, the ternary predictions based on pure-fluid parameters yield three times the experimental uncertainties. Further, for the present system, little improvement is realized by predicting the individual-component ternary isotherms based on parameters generated from both pure and binary adsorption data.
§
The quality of the model predictions indicate that although the LRC and ZGR EOS are capable of predicting the total adsorption adequately, they predict the individual-component adsorption poorly, especially when dealing with the less-adsorbed component of the mixture. This suggests significant model improvements are required to realize the full benefit of improving multicomponent predictions using input from binary adsorption measurements.
31
G. References 1. Hall, F. E., Zhou, Chunhe, Gasem, K. A. M., and Robinson, Jr., R. L., Adsorption of Pure Methane, Nitrogen, and Carbon Dioxide and their Binary Mixtures on Wet Fruitland Coal, SPE Paper 29194, presented at the 1994 Eastern Regional Conference & Exhibition, Charleston, West Virginia, November 8-10, 1994. 2. Hall, F. E., Adsorption of Pure and Multicomponent Gases on Wet Fruitland Coal, M. S. Thesis, Oklahoma State University, December 1993. 3. Span, R. and Wagner, W., A New Equation of State for Carbon Dioxide Covering the Fluid Region from the Triple Point Temperature to 1100 K at Pressures up to 800 MPa, J. Phys. Chem. Ref. Data, 25, 1509-1590 (1996). 4. International Thermodynamic Tables of the Fluid State-5 Methane, Angus, S., Armstrong, B., de Reuck, K.M., IUPAC Chemical Data Series No.16, (1976). 5. International Thermodynamic Tables of the Fluid State-6 Nitrogen, Angus, S., Armstrong, B., de Reuck, K.M., IUPAC Chemical Data Series No.20, (1977). 6. Arri, L. E., and Yee, D., Modeling Coalbed Methane Production with Binary Gas Sorption, SPE Paper 24363, presented at the SPE Rocky Mountain Regional Meeting, Casper, Wyoming, May 18-21, 1992. 7. Myers, A. L., and Prausnitz, J. M., Thermodynamics of Mixed-Gas Adsorption, AIChE J. 11 121-129 (1965). 8. Stevenson, M. D., Pinczewski, W. V., Somers, M. L., and Bagio, S. E., Adsorption/Desorption of Multicomponent Gas Mixtures on Coal at In-Seam Conditions, SPE Paper 23026, presented at the SPE Asia-Pacific Conference, Perth, Western Australia, November 4-7, 1991. 9. Zhou, C., Gasem, K. A. M., and Robinson, Jr., R. L., Predicting Gas Adsorption Using Two-Dimensional Equations of State, I&EC Research 33 1280-1289 (1994). 10. Malbrunot, P., Vidal, D., and Vermesse, J., Storage of Gases at Room Temperature by Adsorption at High Pressure, Applied Thermal Engineering 16 375-382 (1996). 11. Pan, Z., Fitzgerald, J. E., Sudibandriyo, M., Gasem, K. A. M., and Robinson, Jr., R. L., Measurement and Correlation of Methane/Nitrogen/Carbon Dioxide Compressibility Factors, Journal of Thermodynamics, to be submitted, 2002.
32
H. Tables Table 1. Compositional Analyses of Tiffany Coal Samples* Analysis
Well #1
Well #10
Well #1 Dried Basis
Well #10 Dried Basis
Dry Loss % 6.85 18.33 Carbon % 44.51 46.35 47.78 56.75 Hydrogen % 3.20 4.30 2.62 2.77 Oxygen % 11.85 20.51 6.19 5.16 Nitrogen % 0.86 0.83 0.92 1.02 Sulfur % 0.53 0.42 0.57 0.52 Ash % 46.30 38.99 49.71 47.74 Proximate Volatile Matter % 14.41 12.54 15.48 15.35 Fixed Carbon % 32.43 30.14 34.82 36.91 *Analysis was conducted on a mass basis by Huffman Laboratories, Inc., 4630 Indiana Street, Golden, CO 80405. Table 2. Tiffany Coal Particle Size Distribution Size Range (mm) From To 0.00 0.25 0.25 0.30 0.30 0.425 0.425 0.60 0.60 0.85 0.85 1.70 1.70 2.00 2.00 2.38 2.38 5.66 5.66 ∞
Well #1 (% mass) 4.0 4.5 7.5 10.9 13.9 45.7 2.5 6.2 4.7 0.0
Well #10 (% mass) 5.0 1.4 3.3 8.2 15.0 41.0 5.6 4.3 15.6 0.6
Table 3. Vitrinite Reflectance Analysis* Well #1 Well #10 1.31 1.35 1.19-1.43 1.21-1.50 50 50 Medium Volatility Medium Volatility Bituminous Coal Bituminous Coal *Analysis was conducted by National Petrographic Service, Inc., 5933 Bellaire Blvd. Suite 108, Houston, TX 77081. Average VRO Range Grain Count Rank
33
Table 4. Pure Methane Adsorption on Wet Tiffany Well #1 Coal at 130 °F: 5.6% Moisture Content Run 1 (Moisture Free Basis) Pressure (psia) 62.0 139.3 298.3 485.0 655.5 898.3 1057.1 1235.1 1446.4 1728.1 1960.3
Run 2 (Moisture Free Basis)
Gibbs Absolute Adsorption Adsorption (SCF/ton) (SCF/ton) ∗ 43.2 43.5 79.7 80.8 138.6 142.8 176.9 186.0 205.9 220.6 234.1 258.0 246.1 276.6 254.7 292.9 260.5 308.1 264.2 324.9 267.8 340.5
Pressure (psia) 322.5 657.3 1129.1 1840.3
Run 1 (Moisture and Ash Free Basis) Pressure Gibbs Absolute Adsorption Adsorption (psia) (SCF/ton) (SCF/ton) 62.0 85.9 86.5 139.3 158.4 160.7 298.3 275.6 284.0 485.0 351.8 369.8 655.5 409.4 438.6 898.3 465.5 513.0 1057.1 489.3 550.1 1235.1 506.4 582.4 1446.4 518.0 612.7 1728.1 525.3 646.0 1960.3 532.5 677.0
∗
Gibbs Adsorption (SCF/ton) 141.7 199.7 245.7 260.8
Absolute Adsorption (SCF/ton) 146.4 214.0 278.7 325.9
Run 2 (Moisture and Ash Free Basis) Pressure Gibbs Absolute Adsorption Adsorption (psia) (SCF/ton) (SCF/ton) 322.5 281.8 291.1 657.3 397.1 425.5 1129.1 488.5 554.2 1840.3 518.6 648.1
1 mmol/g = 758.98 SCF/ton
34
Table 5. Pure Methane Adsorption on Wet Tiffany Well #10 Coal at 130 °F: 16.5% Moisture Content Run 1 (Moisture Free Basis) Pressure (psia) 81.2 191.1 375.5 591.6 809.1 1018.2 1194.5 1393.2 1599.8 1807.4 1975.9
Run 2 (Moisture Free Basis)
Gibbs Absolute Adsorption Adsorption (SCF/ton) (SCF/ton) 48.8 49.1 94.1 95.9 145.5 151.1 189.8 201.9 219.3 239.2 230.2 257.6 238.6 273.0 241.9 284.1 243.5 294.1 246.9 307.1 250.6 319.4
Pressure (psia) 251.1 681.6 1137.8 1665.4
Run 1 (Moisture and Ash Free Basis) Pressure Gibbs Absolute Adsorption Adsorption (psia) (SCF/ton) (SCF/ton) 81.2 93.4 94.1 191.1 180.0 183.6 375.5 278.4 289.2 591.6 363.2 386.3 809.1 419.6 457.6 1018.2 440.5 492.8 1194.5 456.6 522.3 1393.2 462.9 543.6 1599.8 465.9 562.8 1807.4 472.5 587.6 1975.9 479.5 611.1
Gibbs Adsorption (SCF/ton) 108.3 199.0 232.8 238.0
Absolute Adsorption (SCF/ton) 111.0 213.8 264.4 290.4
Run 2 (Moisture and Ash Free Basis) Pressure Gibbs Absolute Adsorption Adsorption (psia) (SCF/ton) (SCF/ton) 251.1 207.2 212.6 681.6 380.8 409.2 1137.8 445.4 506.1 1665.4 455.5 555.7
35
Table 6. Pure Methane Adsorption on Wet Tiffany Mixed Coal Sample at 130 °F: 11.7% Moisture Content (Moisture Free Basis) Pressure (psia)
Gibbs Adsorption (SCF/ton)
Absolute Adsorption (SCF/ton)
255.9 824.9 1210.2 1796.9
114.0 223.1 247.4 254.8
117.0 243.9 283.6 316.6
Table 7. Pure Nitrogen Adsorption on Wet Tiffany Mixed Coal Sample at 130 °F: 11.7% Moisture Content Run 1 (Moisture Free Basis) Pressure (psia) 126.8 222.7 418.3 615.7 808.7 1008.9 1211.4 1404.6 1615.8 1817.6 1994.8
Run 2 (Moisture Free Basis)
Gibbs Absolute Adsorption Adsorption (SCF/ton) (SCF/ton) 23.5 23.7 35.2 35.9 54.3 56.4 67.8 71.7 81.7 88.0 91.9 100.8 99.8 111.6 108.4 123.4 118.9 138.1 125.8 148.9 132.5 159.5
Pressure (psia) 106.6 202.9 406.0 602.7 795.6 1000.2 1202.5 1410.9 1604.9 1806.2
36
Gibbs Adsorption (SCF/ton) 18.0 29.4 51.0 66.0 82.0 93.4 102.1 111.2 119.0 124.5
Absolute Adsorption (SCF/ton) 18.1 29.9 52.9 69.7 88.1 102.3 113.9 126.6 138.0 147.2
Table 8. Pure CO 2 Adsorption on Wet Tiffany Mixed Coal Sample at 130 °F: 11.7% Moisture Content Run 1 (Moisture Free Basis) Pressure (psia) 69.5 204.5 400.7 624.3 813.3 1010.0 1209.1 1402.1 1590.5 1784.6 1976.5
Run 2 (Moisture Free Basis)
Gibbs Absolute Adsorption Adsorption (SCF/ton) (SCF/ton) 149.6 150.6 273.1 278.8 362.8 378.8 408.0 439.4 422.3 469.5 423.0 490.6 403.6 496.8 372.3 501.2 335.2 520.2 303.4 555.7 271.0 560.1
Pressure (psia) 97.3 526.8 1028.3 1504.0 1956.1
37
Gibbs Adsorption (SCF/ton) 175.1 383.0 417.2 357.1 281.5
Absolute Adsorption (SCF/ton) 176.7 406.6 486.1 515.4 575.6
Table 9. Methane/Nitrogen Adsorption on a Wet Tiffany Mixed Coal Sample at 130 oF: 10.5% Moisture Content Pressure (psia)
Adsorption (SCF/ton dry coal)
Gibbs 118.5 220.1 400.0 611.6 813.8 1005.9 1208.5 1409.7 1609.6 1812.8 2010.8
45.9 79.2 120.0 155.5 180.4 199.1 212.7 223.8 233.7 241.5 251.5
Total Methane Nitrogen Absolute Gibbs Absolute Gibbs Absolute Methane Feed Composition: 50.0% 46.4 36.9 37.1 9.0 9.3 80.8 63.8 64.5 15.3 16.3 124.7 98.4 100.6 21.6 24.1 165.1 126.6 130.9 28.9 34.1 195.7 152.1 159.1 28.3 36.6 220.4 167.3 177.1 31.8 43.3 240.7 183.2 196.2 29.4 44.5 258.7 193.4 209.5 30.4 49.3 276.6 203.6 223.8 30.1 52.8 292.5 207.8 231.9 33.7 60.6 311.6 216.4 244.9 35.1 66.7
* - Based on absolute adsorption
38
Phase Compositions (Mole Fraction Methane) Gas
Adsorbed*
0.432 0.436 0.444 0.454 0.456 0.461 0.464 0.467 0.469 0.473 0.474
0.799 0.798 0.806 0.793 0.813 0.804 0.815 0.810 0.809 0.793 0.786
Table 10. Methane/CO 2 Adsorption on a Wet Tiffany Mixed Coal Sample at 130 oF: 11.4% Moisture Content Pressure (psia)
Adsorption (SCF/ton dry coal)
Gibbs 105.3 210.0 402.4 601.4 820.7 1010.0 1214.0 1409.3 1609.3 1806.7 2034.8
136.1 209.7 288.6 334.6 361.7 374.4 379.1 376.8 370.4 361.5 344.0
Total Methane Carbon Dioxide Absolute Gibbs Absolute Gibbs Absolute Methane Feed Composition: 41.4% 137.5 35.9 36.7 100.2 100.9 214.1 49.6 52.0 160.1 162.1 301.1 67.7 73.8 220.9 227.2 357.0 70.7 81.7 263.9 275.4 397.0 76.0 92.7 285.8 304.4 422.2 75.4 97.6 299.0 324.6 441.7 79.2 107.7 299.9 334.0 454.6 80.6 115.4 296.2 339.1 464.6 82.6 124.2 287.8 340.3 473.1 85.4 134.2 276.1 338.9 474.7 90.2 146.7 253.7 328.0
* - Based on absolute adsorption
39
Phase Compositions (Mole Fraction Methane) Gas
Adsorbed*
0.541 0.530 0.500 0.488 0.473 0.465 0.455 0.449 0.443 0.438 0.432
0.267 0.243 0.245 0.229 0.234 0.231 0.244 0.254 0.268 0.284 0.309
Table 11. Nitrogen/CO 2 Adsorption on a Wet Tiffany Mixed Coal Sample at 130 oF: 10.4% Moisture Content Pressure (psia)
Adsorption (SCF/ton dry coal)
Gibbs 91.8 196.3 402.7 602.9 824.4 1011.5 1213.7 1407.7 1604.3 1805.2 2004.2
143.1 230.7 324.7 371.4 398.4 405.4 403.4 395.2 376.1 352.6 336.8
Total Nitrogen Carbon Dioxide Absolute Gibbs Absolute Gibbs Absolute Nitrogen Feed Composition: 20.1 % 144.4 4.3 4.8 138.7 139.6 235.1 6.6 8.0 224.1 227.1 338.4 6.5 10.5 318.2 327.9 396.3 6.9 13.6 364.5 382.8 438.1 5.5 15.5 392.9 422.6 458.7 9.9 22.7 395.5 436.0 472.8 8.5 24.7 394.9 448.2 481.5 8.7 28.3 386.5 453.2 479.3 6.5 29.5 369.5 449.8 473.7 5.4 31.9 347.2 441.8 478.6 4.2 34.9 332.6 443.7
* - Based on absolute adsorption
40
Phase Compositions (Mole Fraction Nitrogen) Gas
Adsorbed*
0.363 0.325 0.289 0.268 0.253 0.241 0.233 0.227 0.223 0.219 0.216
0.033 0.034 0.031 0.034 0.035 0.050 0.052 0.059 0.062 0.067 0.073
Table 12. Adsorption of a 10/40/50 Mole % Methane/Nitrogen/CO 2 Feed Mixture on a Wet Tiffany Mixed Coal Sample at 130 oF: 10.5% Moisture Content Pressure (psia)
102.3 199.3 393.1 612.6 807.2 1008.8 1206.4 1410.7 1607.6 1808.6 2005.4
Adsorption (SCF/ton dry coal)
Gibbs 95.4 158.9 239.4 291.6 319.5 337.1 345.1 349.8 346.9 344.2 342.7
Total Absolute 96.2 161.7 248.1 308.8 345.4 372.7 390.5 406.1 413.0 420.4 429.4
Methane Gibbs Absolute 9.1 9.2 13.3 13.6 18.1 19.1 20.8 22.7 21.9 24.8 21.7 25.7 22.0 27.1 20.7 27.0 21.6 28.9 22.8 31.2 25.2 34.5
41
Nitrogen Gibbs Absolute 14.6 15.1 19.4 21.0 23.4 28.2 26.9 36.0 30.1 43.2 30.6 48.2 31.5 53.4 30.9 57.6 32.3 63.2 34.0 69.4 35.6 75.6
Carbon Dioxide Gibbs Absolute 71.7 71.9 126.2 127.0 197.9 200.8 243.8 250.1 267.6 277.4 284.8 298.8 291.7 310.0 298.2 321.5 293.0 320.8 287.3 319.8 281.9 319.2
Table 12. (Continued) Adsorption of a 10/40/50 Mole % Methane/Nitrogen/CO 2 Feed Mixture on a Wet Tiffany Mixed Coal Sample at 130 oF: 10.5% Moisture Content Pressure (psia)
102.3 199.3 393.1 612.6 807.2 1008.8 1206.4 1410.7 1607.6 1808.6 2005.4
Phase Compositions (Mole %)
Gas 0.107 0.112 0.112 0.111 0.111 0.110 0.109 0.109 0.107 0.106 0.105
Methane Adsorbed* 0.095 0.084 0.077 0.074 0.072 0.069 0.069 0.067 0.070 0.074 0.081
Gas 0.543 0.537 0.514 0.491 0.476 0.464 0.455 0.448 0.442 0.436 0.432
* - Based on absolute adsorption
42
Nitrogen Adsorbed* 0.157 0.130 0.114 0.116 0.125 0.129 0.137 0.142 0.153 0.165 0.176
Carbon Dioxide Gas Adsorbed* 0.350 0.748 0.352 0.786 0.374 0.810 0.398 0.810 0.414 0.803 0.426 0.802 0.436 0.794 0.443 0.792 0.451 0.777 0.457 0.761 0.463 0.743
Table 13. Desorption Time for Methane on Wet Tiffany Well #1 Coal Sample at 130 oF Equilibrium Pressures (psia) Initial Desorption System From To 1958.2 1697.1 1722.8 1722.8 1496.9 1519.4 1519.4 1288.7 1310.6 1310.6 1098.4 1115.7 1115.7 894.4 911.8 911.8 682.3 704.6 704.6 484.3 505.6 283.9 43.1 87.1
Time at Λ=0.9 (min)
Time at Θ=0.63 (min)
7.5 11.1 17.4 21.8 28.2 44.0 56.3 169.0
0.6 0.9 1.4 1.7 2.2 3.5 4.5 14.6
Table 14. Desorption Time for Methane on Wet Tiffany Well #10 Coal Sample at 130 oF Time at Λ=0.9 (min)
Equilibrium Pressures (psia) Initial Desorption System From To 1976.4 1650.0 1678.2 1678.2 1351.0 1377.2 1377.2 1071.5 1098.7 649.1 430.4 460.1 460.1 242.4 324.7 324.7 142.4 238.1
4.4 8.0 8.8 8.4 26.1 40.3
Time at Θ=0.63 (min) 0.3 0.6 0.7 0.7 2.3 3.7
Table 15. Desorption Time for Nitrogen on Wet Tiffany Mixed Coal Sample at 130 oF Time at Λ=0.9 (min)
Equilibrium Pressures (psia) Initial Desorption System From To 1954.4 1304.4 1310.1 1310.1 716.0 728.7 728.7 325.0 332.2 332.2 40.7 42.3
22.0 30.0 60.0 60.0
43
Time at Θ=0.63 (min) 4.0 5.6 7.2 12.0
Table 16. Adsorption Time for CO 2 on Wet Tiffany Mixed Coal Sample at 130oF Equilibrium Pressures (psia) Initial Adsorption System From To 3.0 159.2 69.5 69.5 462.0 400.7 400.7 662.0 624.3 624.3 834.0 813.3 813.3 1031.0 1010.0 1010.0 1233.0 1209.1
Time at Λ=0.9 (min)
Time at Θ=0.63 (min)
39.5 27.6 22.0 15.6 10.7 8.4
2.9 2.5 2.2 2.0 1.8 1.6
Table 17. Langmuir Model Representation of Adsorption on Wet Tiffany Coals at 130 oF Pure Gas CH 4 (Well #1) CH 4 (Well #10) CH 4 (Mixed Coal) N 2 (Mixed Coal) CO 2 (Mixed Coal)
L (SCF/ton) 432.0 417.5 434.9 266.9 590.9
B×1000 ( psia −1 ) 1.6107 1.5654 1.5074 0.6303 4.5121
η
RMSE (SCF/ton)
%AAD
1.0 1.0 1.0 1.0 1.0
4.2 2.6 7.2 3.9 16.6
1.9 1.1 2.6 3.5 2.0
Table 18. LRC Model Representation of Adsorption on Wet Tiffany Coals at 130 oF Pure Gas CH 4 (Well #1) CH 4 (Well #10) CH 4 (Mixed Coal) N 2 (Mixed Coal) CO 2 (Mixed Coal)
L (SCF/ton) 509.0 440.7 491.8 416.3 631.2
B×1000 ( psia −1 ) 1.1089 1.3946 1.1113 0.2708 3.9299
44
η
RMSE (SCF/ton)
%AAD
0.89 0.96 0.91 0.87 0.91
2.9 2.8 7.4 2.2 12.4
0.8 0.9 2.3 2.1 1.8
Table 19. LRC Model Representation of Adsorption on Wet, Mixed Tiffany Coals at 130 oF (common η) Pure Gas CH4 N2 CO2
L (SCF/ton) 504.4 364.6 634.8
Bx1000 (psia-1) 1.0854 0.3512 3.8024
η 0.90 0.90 0.90
RMSE (SCF/ton) 7.6 2.4 12.2
%AAD 2.3 2.3 1.8
Table 20. ZGR Equation-of-State Representation of Adsorption on Wet, Mixed Tiffany Coals at 130 oF Pure Gas CH 4 N2 CO 2
α
β
− ln k
144770 193160 74425
1.0140 1.3926 0.6069
2.84 4.29 1.26
RMSE (SCF/ton) 8.1 1.7 15.4
%AAD 3.0 2.3 2.1
Table 21. LRC Model Representation of Binary Adsorption on Wet Tiffany Coals at 130 oF L (SCF/ton)
Bx1000 (psia-1)
η
RMSE (SCF/ton)
%AAD
CH4 N2 Total CH4 - CO2:
435.8 366.6
1.522 0.337
0.96 0.89
16.6 5.8 20.9
9.7 9.0 8.2
CH4 CO2 Total N2 - CO2: N2 CO2 Total Pure: CH4 N2 CO2
435.8 702.6
1.522 2.868
0.96 0.80
12.0 17.0 5.5
7.3 4.2 1.2
366.6 702.6
0.337 2.868
0.89 0.80
11.3 36.2 26.2
31.6 6.7 4.7
435.8 366.6 702.6
1.522 0.337 2.868
0.96 0.89 0.80
8.3 2.9 12.6
3.3 2.7 2.1
Mixture CH4 - N2:
45
Table 22. LRC Model Predictions of Binary Adsorption on Wet Tiffany Coals at 130 oF Mixture
η= 1 (Langmuir) RMSE %AAD (SCF/ton)
Regressed η RMSE %AAD (SCF/ton)
η= 0.90 RMSE %AAD (SCF/ton)
CH4 - N2: 29.5 3.8 30.2
15.8 6.2 12.2
15.5 4.0 16.2
9.0 8.3 6.4
23.2 3.8 21.7
12.0 9.3 8.2
CH4 CO2 Total
36.5 39.1 4.9
25.9 9.0 1.2
31.3 42.5 11.2
21.1 10.1 1.9
31.4 44.1 12.8
21.0 10.5 2.2
N2 - CO2: N2 CO2 Total
15.2 27.7 15.9
44.9 5.2 3.5
14.1 35.6 22.7
38.9 5.9 3.8
13.7 33.1 21.1
37.3 5.7 3.8
CH4 N2 Total CH4- CO2:
Table 23. LRC Model Representation of Ternary Adsorption on Wet Tiffany Coals at 130 oF Individual Adsorption CH4 N2 CO2 Total
L (SCF/ton) 478.2 212.8 631.2
η
Bx1000 (psia-1) 1.8205 2.0495 4.4225
0.97 1.30 1.05
46
RMSE (SCF/ton) 4.2 8.1 12.8 1.7
%AAD 9.0 11.7 3.3 0.5
Table 24. LRC Model Predictions of Ternary Adsorption on Wet Tiffany Coals at 130 oF Individual Adsorption
L BX1000 RMSE η (SCF/ton) (psia-1) (SCF/ton) Parameters based on pure data
% AAD
η= 1 (Langmuir) CH4
434.9
1.507
1.0
5.9
20.7
N2 CO2 Total
266.9 590.9
0.630 4.512
1.0 1.0
29.8 49.6 14.9
47.8 13.2 2.9
η Regressed CH4
491.8
1.111
0.91
2.1
5.3
N2 CO2 Total
416.3 631.2
0.271 3.930
0.87 0.91
29.6 61.4 30.5
46.1 17.7 6.7
0.90
2.2
5.2
28.2 54.7 24.9 Parameters based on pure and binary data
44.5 15.8 5.4
η= 0.90 CH4 N2 CO2 Total
504.4
1.085
364.6 634.8
0.351 3.802
0.90 0.90
CH4
435.8
1.522
0.96
4.6
16.6
N2 CO2 Total
366.6 702.6
0.337 2.868
0.89 0.80
25.1 43.9 26.1
45.8 12.0 6.0
47
Table 25. ZGR EOS Representation of Mixtures on Tiffany Mixed Coal at 130 °F Mixture
CH 4 / N2 CH 4 / CO 2 N2 / CO 2
Cij 0.000 0.000 0.000
CH 4 / N2 CH 4 / CO 2 N2 / CO 2
Cij -0.090 -0.125 -0.140
N2 / CO 2
Cij 0.000 0.000 0.000
CH 4 / N2 CH 4 / CO 2 N2 / CO 2
Cij -0.060 -0.098 -0.011
CH 4 / N2 CH 4 / CO 2
Mixture
Cij = Dij =0 Total ω1 ω2 11.9 10.0 11.5 27.0 10.4 1.4 48.7 4.9 3.5 Regressed Cij (Dij=0) Dij Total ω1 ω2 0.000 10.6 7.3 7.6 0.000 8.4 10.6 6.1 0.000 16.0 4.1 3.2 Regressed Dij (Cij=0) Dij Total ω1 ω2 -0.068 10.6 7.1 7.5 -0.090 7.7 11.0 6.6 -0.108 14.5 4.3 3.5 Regressed Cij and Dij Dij Total ω1 ω2 -0.023 10.6 7.2 7.5 -0.019 8.2 10.7 6.2 -0.100 14.6 4.3 3.4 Predicted Ternary Dij 0.000 0.000 0.000
CH 4 / N2 / CO 2
CH 4 / N2 / CO 2
ω1 18.0
CH 4 / N2 / CO 2
ω1 18.3
CH 4 / N2 / CO 2
ω1 18.6
ω1 20.5 30.2 13.1
ω2 6.7 35.0 25.4
Total 26.3 5.4 15.6
ω1 18.8 11.2 3.9
ω2 3.9 32.9 20.9
Total 17.5 25.4 17.7
ω1 18.4 9.6 3.3
ω2 3.8 34.7 21.8
Total 16.9 28.6 19.0
ω1 18.7 10.9 3.4
ω2 3.8 33.2 21.7
Total 17.3 26.1 18.9
RMSE (SCF/ton coal)
%AAD ω1 21.6
RMSE (SCF/ton coal)
%AAD
From pure data Cij = Dij =0 Total ω2 ω3 ω1 55.9 17.6 4.3 4.9 Cij from Binary (Dij=0) Total ω2 ω3 ω1 32.8 17.4 9.3 4.6 Dij from Binary (Cij=0) Total ω2 ω3 ω1 31.6 17.7 9.7 4.8 Cij and Dij from Binary Total ω2 ω3 ω1 31.9 17.6 9.6 4.8
48
ω2 29.2
ω3 51.5
Total 18.1
ω2 17.1
ω3 48.1
Total 35.2
ω2 16.1
ω3 49.6
Total 37.9
ω2 16.4
ω3 49.1
Total 37.1
Table 26. Sorption Fractional Uptake Correlation α = (aP2+bP+0.5)c (-5.530×10⁻⁸×P2+2.960×10⁻⁴×P+0.5)(1.030)
Pure Gas CH 4 (Well #1) CH 4 (Well #10) N 2 (Mixed Coal) CO 2 (Mixed Coal)
(1.251x10⁻⁸×P2+7.397x10⁻⁴×P+0.5)(1.327) (0.5)×1.700 1.264×10⁻⁷×P2+9.497x10⁻⁵×P+0.5)(1.066)
β 0.4570 0.3912 0.2833 0.6404
%AAD 4.1 6.4 7.2 2.2
Table 27. Sorption-Time Estimates on Wet Tiffany Coal Samples at 130 oF for 63% Desorption Starting Desorption Pressure (psia) 2000 1800 1600 1400 1200 1000 800 600 400 200
Methane on Well #1 (min)
Methane on Well #10 (min)
Nitrogen on Mixed Coal (min)
CO2 on Mixed Coal (min)
9.3 9.4 9.5 9.6 9.8 9.9 10.2 10.5 10.9 11.6
8.4 8.4 8.5 8.5 8.5 8.6 8.6 8.7 8.8 9.0
8.2 8.2 8.2 8.2 8.2 8.2 8.2 8.2 8.2 8.2
4.7 4.7 4.7 4.7 4.7 4.7 4.7 4.7 4.8 4.8
49
This page intentionally left blank.
50
Figure 1. Schematic Diagram of Adsorption Apparatus
He Motor
GC
N2 CH 4
SV2 CO 2
V2
T1 1
V7
V3
Ruska Pump
V8
SV1
V12 V9
P1
MP
V4
T2
EC
V
DW
V10 P2
V5
Vacuum
FILTER
V11 SV
V6 Vent
Cell Section
Pump Section
51
Figure 2. Tiffany Well #1 Coal Particle Size Distribution
50.0 45.0
Mass percentage (%)
40.0 35.0 30.0 25.0 20.0 15.0 10.0 5.0 0.0 0.0
0.25
0.3
0.425
0.6
0.85
1.7
Particle size (mm)
52
2.00
2.38
5.66
Figure 3. Tiffany Well #10 Coal Particle Size Distribution
45.0 40.0
Mass percentage (%)
35.0 30.0 25.0 20.0 15.0 10.0 5.0 0.0 0.0
0.25
0.3
0.425
0.6
0.85
1.7
Particle size (mm)
53
2.00
2.38
5.66
Figure 4. Tiffany Well #1 and Well #10 Coal Particle Size Distributions
50.0 45.0
Well #1 Well #10
Mass percentage (%)
40.0 35.0 30.0 25.0 20.0 15.0 10.0 5.0 0.0 0.0
0.25
0.3
0.425
0.6
0.85
1.7
Particle size (mm)
54
2.00
2.38
5.66
Figure 5. Pure Methane Absolute Adsorption on Tiffany Coal Samples at 130 ºF
400.0
CH4 on Well #1
Absolute Adsorption (SCF/ton)
350.0
CH4 on Well #10 CH4 on Mixed Coal
300.0 250.0
200.0 150.0
100.0 50.0
0.0 0
200
400
600
800
1000
Pressure (psia)
55
1200
1400
1600
1800
2000
Figure 6. Pure Gas Gibbs Adsorption on Tiffany Coals at 130 ºF 600.0 N2 on Mixed Coal CH4 on Well #1 CH4 on Well #10
Gibbs Adsorption (SCF/ton)
500.0
CH4 on Mixed Coal CO2 on Mixed Coal 400.0
300.0
200.0
100.0
0.0 0
200
400
600
800
1000
Pressure (psia)
56
1200
1400
1600
1800
2000
Figure 7. Pure Gas Absolute Adsorption on Tiffany Coals at 130 ºF
700.0 N2 on Mixed Coal CH4 on Well #1 CH4 on Well #10 CH4 on Mixed Coal CO2 on Mixed Coal LRC Model ZGR Model
Absolute Adsorption (SCF/ton)
600.0
500.0
400.0
300.0
200.0
100.0
0.0 0
200
400
600
800
1000
1200
Pressure (psia)
57
1400
1600
1800
2000
Figure 8. Pure Nitrogen Absolute Adsorption on Tiffany Mixed Coal Sample at 130 ºF
180.0
N2 on Mixed Coal
Absolute Adsorption (SCF/ton)
160.0
Langmuir LRC Model
140.0
ZGR Model
120.0 100.0 80.0 60.0 40.0 20.0 0.0 0
200
400
600
800
1000
Pressure (psia)
58
1200
1400
1600
1800
2000
Figure 9. Pure CO2 Absolute Adsorption on Tiffany Mixed Coal Sample at 130 ºF
700.0
CO2 on Mixed Coal Langmuir
Absolute Adsorption (SCF/ton)
600.0
LRC Model ZGR Model
500.0
400.0
300.0
200.0
100.0
0.0 0
200
400
600
800
1000
Pressure (psia)
59
1200
1400
1600
1800
2000
Figure 10. CO2 Absolute Adsorption on Tiffany Mixed Coal Sample Using Different Adsorbed-Phase Densities
Aboslute Adsorption (SCF/ton)
700
600
500
400
Adsorbed Phase Density (g/cc)
1.18 Saturated liquid density at triple point 1.25 ZGR estimate 1.40 Graphical estimate
300
200
100
0 0
200
400
600
800
1000
1200
Pressure (psia)
60
1400
1600
1800
2000
Figure 11. Gibbs Adsorption of a 50/50 Mole % Methane/Nitrogen Feed Mixture on a Wet Tiffany Mixed Coat Sample at 130 ºF
300.0
Total CH4
Gibbs Adsorption (SCF/ton)
250.0
N2 200.0
150.0
100.0
50.0
0.0 0
200
400
600
800
1000
1200
Pressure (psia)
61
1400
1600
1800
2000
2200
Figure 12. Absolute Adsorption for 50/50 Mole % Methane/Nitrogen Feed Mixture on a Wet Tiffany Mixed Coal Sample at 130 oF 400.0
Total CH4
Absolute Adsorption (SCF/ton)
350.0
N2 300.0
ZGR Model LRC Model
250.0 200.0 150.0 100.0 50.0 0.0 0
200
400
600
800
1000
1200
Pressure (psia)
62
1400
1600
1800
2000
2200
Figure 13. Gibbs Adsorption of a 40/60 Mole % Methane/CO 2 Feed Mixture on a Wet Tiffany Mixed Coal Sample at 130 oF 500.0
Total
450.0
CO2
Gibbs Adsorption (SCF/ton)
400.0
CH4
350.0 300.0 250.0 200.0 150.0 100.0 50.0 0.0 0
200
400
600
800
1000
1200
Pressure (psia)
63
1400
1600
1800
2000
2200
Figure 14. Absolute Adsorption for 40/60 Mole % Methane/CO 2 Feed Mixture on a Wet Tiffany Mixed Coal Sample at 130 o F 600.0
Total
Absolute Adsorption (SCF/ton)
CO2 500.0
CH4 ZGR Model
400.0
LRC Model
300.0
200.0
100.0
0.0 0
200
400
600
800
1000
1200
Pressure (psia)
64
1400
1600
1800
2000
2200
Figure 15. Gibbs Adsorption of a 20/80 Mole % Nitrogen/CO2 Feed Mixture on a W e t T i f f a n y M i x e d C o a l S a m p l e a t 1 3 0 oF 500.0
Total
450.0
CO2
Gibbs Adsorption (SCF/ton)
400.0
N2
350.0 300.0 250.0 200.0 150.0 100.0 50.0 0.0 0
200
400
600
800
1000
1200
Pressure (psia) 65
1400
1600
1800
2000
2200
Figure 16. Absolute Adsorption for 20/80 Mole % Nitrogen/CO 2 Feed Mixture on a Wet Tiffany Mixed Coal Sample at 130 oF 600.0
Total
Absolute Adsorption (SCF/ton)
CO2 500.0
N2 ZGR Model
400.0
LRC Model
300.0
200.0
100.0
0.0 0
200
400
600
800
1000
1200
Pressure (psia)
66
1400
1600
1800
2000
2200
Figure 17. Gibbs Adsorption of a 10/40/50 Mole % Methane/Nitrogen/CO 2 Feed o
Mixture on a Wet Tiffany Mixed Coal Sample at 130 F 400.0
Total CO2
Gibbs Adsorption (SCF/ton)
N2 CH4
300.0
200.0
100.0
0.0 0
200
400
600
800
1000
1200
Pressure (psia) 67
1400
1600
1800
2000
2200
Figure 18. Absolute Adsorption for 10/40/50 Mole % Methane/Nitrogen/CO2 Feed o
on Wet Tiffany Mixed Coal Sample at 130 F 600.0
Total CO2
Absolute Adsorption (SCF/ton)
500.0
N2 CH4
400.0
LRC Model
300.0
200.0
100.0
0.0 0
200
400
600
800
1000
1200
Pressure (psia)
68
1400
1600
1800
2000
2200
Figure 19. Fractional Uptake of Methane Desorption on Tiffany Well #1 o Coal at 130 F 1
Pressure Fractional Uptake (Λ)
0.9 0.8 0.7
Pressure from 484.3 psia to 505.6 psia
0.6
Pressure from 894.4 psia to 911.8 psia
0.5 Pressure from 1288.7 psia to 1310.6 psia
0.4 0.3 0.2 0.1 0 0.0
10.0
20.0
30.0
40.0
50.0
Time (min)
69
60.0
70.0
80.0
90.0
100.0
Figure 20. Fractional Uptake of Methane Desorption on Tiffany o Well #10 Coal at 130 F 1
Pressure Fractional Uptake (Λ )
0.9 Pressure From 1685.2psia to 1377.2psia
0.8 0.7
Pressure From 1983.6psia to 1685.2psia 0.6 0.5 0.4 0.3 0.2 0.1 0 0.0
5.0
10.0
15.0
Time (min)
70
20.0
25.0
30.0
Figure 21. Fractional Uptake of Nitrogen on Tiffany Mixed Coal o at 130 F
1.0 0.9
Pressure Fractional Loading (Λ)
0.8 0.7 0.6
Pressure from 325.0 psia to 332.2 psia and pressure from 40.7 psia to 42.3 psia
0.5
Pressure from 716 psia to 728.7 psia 0.4 0.3 0.2 0.1 0.0 0.0
10.0
20.0
30.0
40.0
50.0
Time (min)
71
60.0
70.0
80.0
90.0
100.0
Figure 22. Fractional Uptake of CO2 Adsorption on Tiffany Mixed Coal at 130°F 1.0 0.9
Pressure Fractional Loading ( Λ)
0.8
Pressure from 0.0 psia to 69.5 psia
0.7
Pressure from 69.5 psia to 400.7 psia
0.6
Pressure from 400.7 psia to 624.3 psia
0.5 Pressure from 624.3 psia to 813.3 psia Pressure from 813.3 psia to 1010.1 psia Pressure from 1010.1 psia to 1233.0 psia
0.4 0.3 0.2 0.1 0.0 0
10
20
30
40
50
Time (min)
72
60
70
80
90
100
Figure 23. Model Predictions of Absolute Adsorption for 50/50 Mole % o Methane/Nitrogen Feed Mixture on a Wet Tiffany Mixed Coal Sample at 130 F 400.0
Total
Absolute Adsorption (SCF/ton)
350.0
CH4 N2
300.0
ZGR Model LRC Model
250.0
200.0
150.0
100.0
50.0
0.0 0
500
1000
Pressure (psia) 73
1500
2000
Figure 24. Model Predictions of Absolute Adsorption for 40/60 Mole % Methane/CO2 o
Feed Mixture on a Wet Tiffany Mixed Coal Sample at 130 F
Absolute Adsorption (SCF/ton)
600.0
Total CO2
500.0
CH4 ZGR Model
400.0
LRC Model 300.0
200.0
100.0
0.0 0
200
400
600
800
1000
1200
Pressure (psia)
74
1400
1600
1800
2000
2200
Figure 25. Model Predictions of Absolute Adsorption for 20/80 Mole % Nitrogen/CO2 Feed Mixture on a Wet Tiffany Mixed Coal Sample at 130 oF 600.0 Total CO2
Absolute Adsorption (SCF/ton)
500.0
N2 ZGR Model LRC Model
400.0
300.0
200.0
100.0
0.0 0
200
400
600
800
1000
1200
Pressure (psia)
75
1400
1600
1800
2000
2200
Figure 26 Model Predictions of Absolute Adsorption for 10/40/50 Mole % o Methane/Nitrogen/CO2 Feed on a Wet Tiffany Mixed Coal Sample at 130 F 600.0
Total CO2
Absolute Adsorption (SCF/ton)
500.0
CH4 N2 400.0
ZGR LRC
300.0
200.0
100.0
0.0 0
200
400
600
800
1000
1200
Pressure(psia)
76
1400
1600
1800
2000
2200
77
Figure 28. Desorption Curve for Methane on Tiffany Well #10 Coal o at 130 F 1 0.9 Data for Multiple Pressure Regimes
Fractional Uptake, Θ
0.8 0.7 0.6 0.5 0.4 0.3 0.2 0.1 0 0.0
1.0
2.0
3.0
4.0
5.0 α
6.0 α
Time (min )
78
7.0
8.0
9.0
10.0
Figure 29. Desorption Curve for Nitrogen on Tiffany Mixed Coal o at 130 F 1.0 Data for Multiple Pressure Regimes
0.9
Fractional Update, Θ
0.8 0.7 0.6 0.5 0.4 0.3 0.2 0.1 0.0 0.0
5.0
10.0
α
α
Time (min)
79
15.0
20.0
25.0
Figure 30. Adsorption Curve for CO2 on Tiffany Mixed Coal at 130 oF 1.0 Data for Multiple Pressure Regimes
0.9
Fractional Uptate ( Θ)
0.8 0.7 0.6 0.5 0.4 0.3 0.2 0.1 0.0 0.0
2.0
4.0
6.0
8.0
10.0
Timeα (min)α
80
12.0
14.0
16.0
18.0
20.0
Figure 31. Liberated Gas from Tiffany Coal Samples: 2000 to 14.7 psia 450
CO2 on mixed coal Nitrogen on mixed coal Methane on Well #1 coal
Liberated Adsorbed Gas (SCF/ton)
400
Methane on Well #10 Coal 350 300 250 200 150 100 50 0 0.0
0.1
1.0
10.0
Time (min)
81
100.0
1000.0