email. ABSTRACT. Multi-touch tabletops and desktop computers offer different ..... âI need to cross eight streets this way before I turn rightâ. [Counting, Relative].
Touch, Click, Navigate: Comparing Tabletop and Desktop Interaction for Map Navigation Tasks Authors Institution Address email ABSTRACT
Multi-touch tabletops and desktop computers offer different affordances for interaction with digital maps. Previous research suggests that these differences may affect how a person navigates in the world. To test this idea we randomly assigned 22 participants to one of two conditions. Participants used the interfaces to complete a series of tasks in which they interacted with a digital map of a fictitious city and then attempted to navigate through a corresponding virtual world. However, based on participant performance, we find no evidence that interface type affects navigation ability. We discuss map navigation strategies across the two conditions and analyze multitouch gestures used by participants in the tabletop condition. Finally, based on these analyses, we consider implications for the design of interactive map interfaces. Author Keywords
Map interfaces; spatial ability; navigation; multi-touch tabletops; interactive surfaces; gestures. ACM Classification Keywords
H.5.2 Information interfaces and presentation (e.g., HCI): User Interfaces - Input devices and strategies (e.g., mouse, touchscreen), Interaction styles. INTRODUCTION
As multi-touch tabletops make their way into public spaces such as museums, hotels, and travel agencies [1, 13, 14, 19], we expect that digital map applications specifically designed for interactive tabletops will become increasingly common. These tabletop interfaces will likely differ from more general-purpose map applications (e.g. maps on mobile devices) in several key ways. First, they will be situated in a specific location and context. As such, the maps provided to users might be confined to a specific geographical area such as a theme park or a historical district. Second, the interfaces will be tailored for collaborative, walk-up-and-use scenarios. Finally, they will be customized for that given location, showing maps of both indoor and outdoor spaces, and providing information Permission to make digital or hard copies of all or part of this work for personal or classroom use is granted without fee provided that copies are not made or distributed for profit or commercial advantage and that copies bear this notice and the full citation on the first page. To copy otherwise, or republish, to post on servers or to redistribute to lists, requires prior specific permission and/or a fee. ITS’12, November 11–14, 2012, Cambridge, Massachusetts, USA. Copyright 2012 ACM 978-1-4503-1209-7/12/11...$10.00.
on specific points of interest. For example, maps might show wait times for rides at an amusement park, menus for restaurants near a hotel, or flight status information at an airport. For these reasons tabletop map interfaces might be thought of as specialized information kiosks. Previous studies of geographical map interfaces have considered design challenges such as economizing limited screen real estate on mobile phones [23], supporting social navigation through connected devices [3], combining mobile devices and public displays [5, 24], and providing location context through augmented reality [23]. Some studies have also considered the use of maps on large interactive surfaces such as multi-touch tabletops and display walls [9, 10]. The current study considers user interaction with tabletop map interfaces as compared to more traditional kiosk-style interaction (e.g. mouse or trackball). We are interested in two questions related to tabletop map interfaces. First, what advantages, if any, does tabletop interaction offer for way-finding activities? And, second, in what ways do people interact with kiosk-style maps—what way-finding strategies do they use and what kinds of multitouch gestures do they employ? To begin to explore these questions, we conducted a controlled study in which individual participants completed map navigation tasks in one of two conditions: using a desktop computer with mouse input (Figure 1a) and using an interactive tabletop with touch input (Figure 1b). BACKGROUND Map Interaction and Interfaces
The ways in which people interact with maps have been well studied in the fields of Applied Geography, Geographic Information Systems, and, more recently, Human-Computer Interaction. However, most work on map interaction and navigation has focused on how interaction varies when the visual appearance of the map is altered. Such alterations include changing the colors [22], the amount of information displayed [8], and the types of information displayed [18]. Relatively little work has focused on how changing the type of interaction affects people’s use of digital maps. Work in the area of mobile navigation systems [12, 23, 26] has focused mainly on maximizing the limited real estate available on a mobile
Figure 1a. In the desktop condition participants interacted with a map on a desktop computer with a standard keyboard and mouse. display. Other research has considered the use of maps on large interactive surfaces [9, 10]. Forlines et al. [10] presented a multi-display system built on Google Earth with each display augmented with a different layer of information. Their design aimed to support multi-user interaction in a co-located environment. Research comparing input-type (e.g. direct touch vs. mouse input) for map interaction is limited. The current study addresses open questions involving the effect of input type on map navigation performance of single-user interactions. Mouse vs. Touch Input Comparisons
In recent years, the use of direct-touch interactive surfaces has grown to include many different applications. Accordingly, several studies have explored the benefits of touch compared to mouse input [11, 15, 16, 21, 27]. Forlines et al. [11] compared mouse vs. touch input on tabletop displays for both unimanual and bimanual tasks. Their results indicate that users in the touch condition perform better for bimanual tasks. However, for singleuser, unimanual input, users may benefit more from a single-mouse. Kin et al. [16] found that participants using direct-touch input performed better on a multi-target selection task than those using mouse input. In a study of a collaborative learning task, Shaer et al. [27] found that tabletop interaction had several advantages compared to a multi-mouse desktop condition. Tan et al. [28] compared users’ ability to recall the positions of objects on a screen using a touch compared to mouse input. They found a 19% increase in spatial recall for users with touch input based on error rate of placed objects. However, they found no significant difference between conditions in the percent of objects correctly identified and time spent on learning and recall. They also found that, while men performed significantly better than women in the mouse condition, there was no significant difference in the touch condition. This suggests that the kinesthetic cues offered by touch input might narrow the gender gap for spatial tasks. Likewise, Robinson et al.’s
Figure 1b. In the tabletop condition, participants interacted with a map using multi-touch input on an interactive tabletop computer. work on virtual world navigation provides evidence that a slight alteration in the interface (field of view in their case) could have a significant effect on users’ ability to navigate [8]. In that same vein, altering the input type (tabletop vs. desktop) might have an effect on how well users are able to navigate. In this study we aim to investigate whether these results also apply to users of touch-based map interfaces. Multi-Touch Gestures
There is a growing body of research that provides design insight for a variety of direct touch interfaces. Wu and Balakrishnan [33] presented a set of multi-touch gestures for interactive tabletops. They implemented interaction techniques employing single-finger, two-finger, and multifinger gestures. Their evaluations of these techniques suggest that learning and applying these gestures effectively required only limited practice. Wobbrock et al. [32] presented a set of user-defined gestures based on users’ agreement over a thousand of gestures. Their findings show that users rarely care about the number of fingers touching the display, and that they prefer unimanual rather than bimanual interactions. They also suggest including desktop widgets along with touch input to support ease of use. Based on this work, Morris et al. [20] compared the previously created user-defined and researcher-defined surface gestures [32] to better understand users’ preferences. Their findings indicate that physically and conceptually simpler gestures were highly preferred to more complex gestures. For example, users preferred single-finger gestures over multi-finger or wholehand gestures and unimanual gestures over bimanual ones. Most recently, Urakami [29] studied the differences between novice and expert users’ choice of gestures for a tabletop map application. Their observational data suggest that the choice of gestures was affected by the users’ experience and, to some degree, by the size of the manipulated object and nature of the command. Furthermore, their findings show that surface gestures should focus on the motion pattern of the hand or fingers
and not depend on the use of specific hand shapes or fingers. Due to the appearance of tabletop displays in public spaces, several studies have explored both multi-user user gestures and gestures in the wild. Ryall et al. [25] conducted longitudinal observations of tabletop users in four contexts and discovered a number of common behavior patterns. More recently, Hinrichs and Carpendale [13 13] conducted a field study at the Vancouver Aquarium rium investigating visitor gestures on two tabletop exhibits. They compared gesture types for children and adults, and reported on a variety of gestures for different actions. tions. Their findings indicate that the choice of gesture depends not only on the specific action, but also on interaction context and social context. To our best knowledge, there is very little research on exploring the gestures used in the context of map interaction on tabletops. RESEARCH QUESTIONS
We imagine that tabletop map interfaces in real real-world settings will often be used simultaneously by multiple people (as in [19]). ]). However, in this study, we are interested in comparing the effects of tabletop and desktop interfaces on map navigation performance. As such such, we chose to focus on individual users in a controlled laboratory setting guided by the following research questions: RQ1. What strategies do people use to support navigation when interacting with kiosk-style style digital maps? RQ2. What type of the multi-touch touch gestures do users employ while interacting with tabletop map applications? RQ3. Do individuals who interact ct with the map in a tabletop condition perform better on the subsequent navigation tasks than users in a desktop condition? STUDY DESIGN
We conducted a between-subject study with two conditions: mouse input with a desktop display (Figure 1a) and touch input on a tabletop display (Figure 1b) 1b). We selected a between-subject design to keep participant time commitments manageable. We measured participant map interaction time and navigation time.. We also video recorded participants during the study to understand their map interaction and way-finding finding strategies at a more detailed level. After interacting with the map, pparticipants navigated in a corresponding virtual world with a three threedimensional, first-person view. All participants used a desktop computer to navigate igate in the virtual world (Figure 2). Participants
For this study, we recruited 22 participants aged 18 to 70 years (M=25, SD=12.8). ). We randomly assigned participants to one of the study conditions (11 desktop and 11 tabletop). In the tabletop condition there here were 5 women and 6 men (average age 29, SD=17.46),, and in the desktop condition there were 7 women and 4 men (average age 20.9, SD=2.39). The participants were recruited from the local university community, and 19 of them m were students.
Participants were paid $10 to take part in the study, which took around one hour to complete. complete We also conducted a pilot study with 10 people using a set of simpler tasks (for both map interaction and navigation tasks).
Figure 2. First-person person perspective of navigating through the virtual world,, built with Microsoft XNA Game Studio. Apparatus
The study was conducted with two devices. The desktop computer had an 18.5×11.5 11.5 inch monitor (1680×1050 pixels). This device was used for navigation in the virtual world (for both conditions) onditions) and also the desktop map condition. For the tabletop map condition, we used a firstfirst generation Microsoft Surface with a 25×19 inch display (1024×768 pixels). Procedure
At the beginning of the experiment, we asked participants to complete a simple practice task to become familiar with the map interface and with navigating in the corresponding virtual world. Once completed, we asked the participants to accomplish three increasingly difficult tasks, each consisting of two sub-tasks:: (a) map interaction interact and (b) virtual world navigation. For both map interaction and virtual world navigation, we asked participants to think out loud while they were working. All sessions were video recorded. All tasks were completed in a fictitious city called Laketown. For each task, we first gave the users a note card with a specified start and end point and then instructed them to locate each point on the map and find a route between those points in the order specified. specified For example, the note card for the first task read:: “Here Here is a map of a fictitious city. You will have up to ten minutes to study this map to learn the way to get from the southwest corner of the dome to the dinosaur.” dinosaur After verbal confirmation of completion of this phase (or up to 10 minutes interaction with the map), map) participants then navigated in a virtual world from the start point to the end point (Figure 2), relying on their memory alone to find the route. Participants entered the virtual world at the start point but did not know which direction they the were facing,
requiring them to use streets and landmarks to orient themselves. Navigation Tasks
The first task (A) involved traveling from a start point to an end point with a minimal number of intermediate turns. The end point for this task was a highly recognizable landmark (a dinosaur statue). The second task (B) was similar to the first task, but it involved more turns. Too make it slightly more difficult, the landmark at the end point (a lighthouse) was harder to identify than in the first task task—there were three lighthouses in the virtual world, all similar in appearance. Finally, the third task (C) asked participants to find two intermediate points in addition to an end point. The intermediate points were specific houses located in a group of similar looking ooking buildings. Our results show that mean participant navigation times increased from one task to the next, suggesting that the tasks were increasingly difficult.
testing, we developed our world ld in Alice as in Czerwinski et al. [7], but the final world was too large for fluid use in Alice. After completing all three tasks,, the participants took a standard mental rotation test to assess spatial reasoning abilities [30]. The participants then completed a brief experience questionnaire in which they reported their previous experience with different input techniques, virtual worlds, maps and navigation. 400
Tabletop
Desktop
300 200 100
Map Interaction
The digital map was presented on a tabletop (for touch condition) and a desktop esktop (for mouse condition). On the tabletop, participants could use one or more fingers to pan the map and two or more fingers to zoom and rotate the map (using standard pinch gestures). Zooming revealed more detailed information on the map. The names of buildings and landmarks did not appear at the lowest level of zoom, meaning that users must zoom in to complete each task. Tapping and double tapping were not mapped to any action in the tabletop interface. On the desktop, participants could click and dr drag to pan the map and use the scroll wheel to zoom in and out out. To rotate the map, participants had to hold down the control key while manipulating the scroll wheel. As was the case in the tabletop interface, single and double clicks in the desktop conditionn were not mapped to any interface action. Each condition also included a panel with standard button widgets to pan, zoom, and rotate the display (inset, Figure 1a). We instructed participants on how to use the interface, and we provided a practice task prior rior to the start of task A. Virtual World Interaction
The navigation subtask was conducted within a virtual world corresponding to the map (Figure 2). Participants were given a first-person person perspective as if the user were walking through the world: “This computer shows the same fictitious city that you saw on the map in 3D. D. You are "standing" on the southwest side of the dome now. Usee the arrow keys to "walk" to the dinosaur. Let us know when you get to the end point point. You will have up to ten minutes.” All participants used a desktop computer to navigate in the virtual world using arrow keys on a standard keyboard. The up and down arrow keys were mapped to forward and backward motion respectively (with constant velocity and instant acceleration). The left and nd right arrow keys allowed for turning in place at a constant angular velocity. We built the world using Microsoft XNA Game Studio. In pilot
0 Task 1 A
Task 2 B
Task 3 C
Figure 3.. Mean map interaction time in seconds for the three tasks with standard error shown.
400
Tabletop
Desktop
300 200 100 0 Task 1 A
Task 2B
Task 3 C
Figure 4. Mean navigation time in seconds for the three tasks with standard error shown. RESULTS
To answer our research questions, we analyzed both quantitative and qualitative data. In this section, we first report our quantitative results, which address our third research question (RQ3). ). Afterwards, we consider RQ1 and RQ2 using qualitative data from video recordings. Quantitative Results
To determine whether individuals in the tabletop map condition performed better on the navigation tasks, we considered participants’ map ap interaction time, navigation completion time, age, and spatial ability scores. Interaction times were determined by measuring the time between the user’s first interaction with the interface interfa (click, touch, etc.) and his or her verbal confirmation of completion. One participant in each condition did not complete the third task.. Additionally, we lost video data for one participant in the desktop condition for the second task (task B). These three data points were omitted from our analysis.
Spatial Ability
The average spatial ability score for the tabletop condition was 10.1 (SD=4.99) while the average score for the desktop condition was 8.73 (SD=4.29). There was no significant difference between spatial scores between the two conditions, t(20) = 0.69, p = 0.34. We also found little to no correlation between spatial ability and navigation performance (ρ = -0.3 for task A; -0.18 for task B; and 0.02 for task C). Unlike previous studies [2, 6, 8, 17, 28], we also found no significant difference between sex and spatial ability, t(20) = 1.64, p = 0.117. The average score for women was 8.0 (SD=4.1) while the average score for men was 11.1 (SD=4.8). Map Interaction Time
Figure 3 shows mean map interaction time for the three tasks for the two conditions. There was no significant difference between the conditions for any of the tasks. For task A: t(20) = 0.153, p = 0.88; task B: t(20) = 1.49, p = 0.15; and task C: t(19) = 0.434, p = 0.67. Navigation Performance
Figure 4 shows mean navigation times for the three tasks. Again, there was no significant difference between the conditions for any of the tasks. For task A: t(20) = 1.03, p = 0.34; task B: t(19) = 0.12, p = 0.9; and task C: t(18) = 0.99, p = 0.33. We also constructed a composite performance score for each participant consisting of individual average completion time across the three tasks. Using this composite score as a dependent variable, we performed an ANCOVA with spatial ability and age as covariates. This test revealed no main effect of interface type (F(1,18) = 1.23, p = 0.28), spatial ability (F(1,18) = 0.96, p = 0.34), or age (F(1,18) = 1.59, p = 0.23). There was also no interaction between condition and spatial ability (F(1,18) = 0.43, p = 0.52), and condition and age (F(1,18) = 3.29, p = 0.09). We also found no significant effect of sex on navigation performance. Using sex as the independent variable, women had an overall average completion time of 203 (SD=92.97), while men had an average completion time of 154.9 (SD=84.9), t(20) = 1.26, p = 0.22. Qualitative Results on Way Finding Strategies
Qualitative data were obtained from video recordings of both the users’ map interaction and virtual world navigation. We coded the video recordings for users’ map interaction styles and navigation strategies. Map interaction style refers to the way in which participants used the map interface, while navigation strategy refers to the way in which participants navigated in the virtual world on the desktop computer. Tables 1 and 2 summarize the codes for map interaction styles and navigation strategies, respectively. Map Interaction Styles
Independent of input type, most users (86.6%) either traced street paths with their finger (or mouse) or dragged the map along their route from point A to point B. We define tracing as following a route without touching the screen or directly interacting with the interface in anyway.
Meanwhile, dragging a route involved directly touching/clicking the screen and dragging the map. Tracing was more frequent in the mouse condition, while dragging was more frequent with the touch condition. This is likely because there is no equivalent of “mouse-over” input for the Microsoft Surface. Counting the streets occurred when users either directly touched/clicked the screen or held their finger close to the screen while counting streets or intersections. There were 7 desktop users (63.6%) who counted streets in one or more tasks, while only one tabletop user counted streets. Almost half of the participants (45%) traced a route using the panel, which mostly happened at the end of a task. Map Interaction Styles Drag Route
Dragging the interface along a route
Trace Route
Tracing finger/mouse along a route
Panel Route
Using the panel to trace a route
Visual Trace
Tracing a route by looking at the map (no finger/mouse tracing)
Counting
Counting streets, intersections, or buildings
Table 1. Codes for map interaction styles Navigation Strategies
Participants used a variety of strategies to navigate in the virtual world for different tasks (see Table 2). Strategies for navigating in the virtual world did not appear to be related to the condition in which users interacted with the map. We observed that 21 of 22 participants used at least one of these two strategies: landmark and cardinal directions. Most users (86%) used one or more landmarks on the map to find their ways, which were mostly natural landmarks (e.g., a city park, the lake, or a green path). There were also some specific buildings on the map used as a landmark (e.g., a cathedral and a pyramid). 19 of 22 users (86%) used cardinal directions in which they were heading as one of their main strategies (e.g., North, or West). Some instances of using these two strategies are: • “I just go west until the end of the city park” [Cardinal, Landmark] • “I need to turn left, when I get to the north of the little bay area” [Cardinal, Relative, Landmark] • “So I need to go north first for six blocks” [Cardinal, Counting] Participants who combined both landmark and cardinal direction strategies seemed especially successful. Almost half of the users (45%) counted the number of streets, intersections, or buildings between landmarks. For example: • “I need to cross eight streets this way before I turn right” [Counting, Relative] There were also a few users (27%) who used experiences from prior tasks to guide their navigation:
• “Oh, I see the dome, so I know I’m heading to the north” [Landmark, Cardinal, Previous Experience] Navigation Strategies Cardinal
Using cardinal direction words (e.g. North)
Landmark
Using landmarks on the map
Counting
Counting streets, intersections, or buildings
Relative
Using the words such as left, right, next to, and between.
Prev. Experience
Words about experiences with prior tasks
Table 2. Codes for navigation strategies Qualitative Results on User Gestural Interactions
Analyzing our video data, we observed a variety of gestures for the three actions supported by our tabletop map: drag, zoom in/out, and rotate. Drag
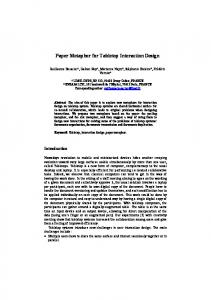
Due to the nature of tasks (locating points of interest and finding a route), dragging the map was the most common action used by the participants. Most users relied on singlefinger, one-handed gestures to drag the map. The choice of finger was not limited to index or middle fingers—one participant dragged the map with his pinky finger (Figure 5e). The simultaneous use of both hands for drag occurred occasionally in two cases: (a) as a trouble-shooting use after one or several unsuccessful dragging with one hand, and (b) when users had less previous experience with direct touch interfaces. We found a number of other gestures that participants used for drag, which we have not seen reported in the literature. This set of gestures is reported below. Zoom In/Out
Participants occasionally zoomed in to see more details on the map and find a specific point, and zoomed out to have an overview of the whole map to find or review a route between those points. To zoom in and out 82% of participants made use of a two-finger pinch using either thumb/index fingers or thumb/middle fingers. Some participants (64%) also made use of a bimanual pull apart gesture and, in a few instances, a single-handed splay gesture (18% of users). Wobbrock et al. [32] found the same set of user-defined gestures for enlarge/shrink actions. However, we also observed users employing the less common fingers for the pinch gesture, such as index/middle fingers (Figure 5c) or thumb/pinky fingers. Zooming was the most difficult action for participants on the tabletop, and participants who reported having little experience with touch input devices most commonly used the button panel to zoom instead of touch. In other cases, participants had to try a variety of gestures to succeed. Some users also tried to tap on the map in order to zoom in, which was not supported by the system. One participant even gave up using the touch-mode after tapping on the surface a few times to zoom in, and used the button panel instead for all the three tasks. This observation suggests
that users will try to tap on the display when they are struggling to understand the interface, possibly due to prior experience with touch or mouse input devices. Rotate
We only observed unwanted rotations as a result of dragging the map or zooming in/out. Consequently, users rotated the map to its default state (i.e. the facing-North state). The most common rotation gestures included touching the map with two fingers and rotating the wrist (64% of users), and touching the map with one finger from each hand and rotating the fingers relative to one another (55% of users). Participants used a variety of fingers for these two gestures. Some interesting gestures include rotating the wrist with index/middle fingers touching, and rotating thumb finger of left hand relative to index finger of right hand. Hinrichs et al. [13] found that the most common rotation gesture for a media item is rotating the wrist using all five fingertips, but we did not see any instance of this gesture in our study. Other Interesting Gestures
Much of gesture variety that we observed has been reported in previous studies [13, 32, 33]. However, we also observed a number of new gestures that we have not seen reported elsewhere. We believe some of these gestures resulted, in part, from the nature of the map interaction task, and the differences between whole screen and media object interaction. Let Your Fingers Do the Walking
This gesture was used by one participant while tracing a route on the map, which involves dragging the map by walking on it, using two (index/middle) or three (index/middle/ring) fingers of one hand and moving the fingers back and forth after each other (Figure 5a). Itsy-Bitsy Spider and Bimanual Drag
Hinrichs et al. [13] reported that people mostly applied single-handed gestures for drag, and that only a few bimanual instances occurred in which four or five fingers were used. However, we observed some tabletop participants who frequently used one finger from each hand to drag the display (18% of users). Specifically, they dragged their fingers one by one to “walk” across the map, both to locate points of interest and to find routes, which we refer to as the “itsy-bitsy spider” gesture (see Figure 5b). Similarly, we observed two other participants using one finger from each hand (most commonly the index finger) to simultaneously drag the map (Figure 5f). We speculate that because users are interacting with a map that covers the entire display (rather than smaller media objects), the resulting gesture sets are correspondingly different. Doggie Paddle
One participant used a bimanual whole hand gesture to drag the map (see Figure 5d). He used both his hands simultaneously to drag the surface, but many times, it was an unsuccessful gesture. The user was 70 years old and he reported having very little previous experience with direct
touch input. We noted that he switched to a single-finger gesture a few times, but interestingly only for troubleshooting. Pinky Drag
Existing studies suggest that users rarely care about the number of fingers they use for tabletop interaction [32]. We also observed that the users tended to use different fingers for different instances of an action, such as dragging with pinky finger (see Figure 5e). In this instance, one user had found the start and end points and was retracing the route. During this process he frequently switched from finger to finger including his pinky in an improvisational manner.
(a)
(b)
(c)
(d)
(e)
(f)
(
(
Figure 5. Some gestures used in the tabletop map condition: (a) walk with three fingers; (b) itsy-bitsy spider drag; (c) index/middle pinch; (d) doggie paddle drag; (e) pinky drag; and (f) bimanual drag. Influence of Prior Experience on Gesture Choices
Previous studies suggest that users’ choice of gestures is affected by experience with touch-input devices [20, 29]. We examined this effect by comparing gestures that novices and experienced users applied on the tabletop while interacting with the map. We determined user experience level based on self-report data from a pre-test questionnaire. In the touch condition, four participants reported that they frequently or very frequently used touch input devices; six reported that they rarely or never used a touch device; and one participant reported occasional use. Comparing user interaction based on experience level, we observed that more experienced users applied a variety of multi-finger gestures, while novices tended to use simpler gestures with a single finger. This is in agreement with Urakami’s [29] observation that experts used two-finger gestures more often than did novices. Urakami’s findings also suggest that novices prefer using bimanual gestures for interacting with the entire map, while experts prefer unimanual gestures. While our study involved a small number of participants, we did observe that more
experienced users were able to skillfully interact with the system using only one hand. We also observed that less experienced users tended to keep their hands off the table while rehearsing and memorizing the route, while more experienced users tended to keep their hands on the table while rehearsing the route, often making continuous small adjustments in the process. Button Panel Use
The button panel added an additional input option for users. Panel use occurred in two cases: (a) voluntary use and (b) trouble-shooting use in response to difficulty using touch input. Not surprisingly, less experienced participants used the button panel for trouble-shooting more often than those with more experience. However, voluntary panel use was also more common for less experienced users, suggesting that the panel use is, in some cases, a more comfortable choice for novices and may lead to a better user performance. For example, one participant struggled with the touch-input. She gradually increased the number of times she used the panel, from an exclusive troubleshooting use (task A) to an exclusive voluntary use (task C). Her navigation performance enhanced accordingly from getting completely lost (task A) to accomplishing the task with just a few wrong turns (task C). We observed that the most common use of button panel overall was for the action of zooming in and out. Many users even started each task by zooming in with the button panel, and then later switched to direct gesture interaction to zoom. These observations were similar across experience level. The use of button panel for dragging occurred mostly for trouble-shooting. DISCUSSION
Although our results provide some insight into the relationship between map interaction, input type, and navigation, many factors remain unclear. Among our open questions are: Why there was no correlation between spatial ability and navigation performance? Why did some users outperform others? And what factors contributed to success? These factors could be differences in familiarity and comfort with the interface type, differences in navigation ability not accounted for with the spatial ability test, choice of navigation and orientation strategies, and differences in route choice. Quantitatively, the fact that there were no significant differences in navigation performance between the two conditions suggests that designers might concentrate on others aspects of map design, rather than input type. In addition, the fact that spatial ability did not correlate with navigation performance suggests that other skills and strategies might be more important for navigation. On the qualitative side, there were some prominent patterns in users’ map interactions. Notably, people frequently trace and drag routes along the map, count street intersections, and keep the map at a fixed orientation. Current map interfaces provide users with a pre-traced route (typically a
colored line between points A and B), but there seems to be something gained by users tracing the route themselves. For non-mobile maps, adding the ability for users to trace their own route in either touch or mouse conditions might enhance the user experience. In this study, we explored gestures in the context of map interaction on tabletops. Comparing our findings with the gestures reported in the literature [13, 32, 33], we found several new gestures. We think participants used these new gestures for several reasons. First, the map took up the entire screen, while other media objects have usually smaller sizes. Second, the nature of task (i.e. using a map to navigate) might result in certain types of gestures, such as using fingers to walk along a route (see Figure 5a and 5b), that simply don’t make sense when manipulating a picture, movie, or drawing object on the table. We observed a variety of multi-touch gestures that participants used for drag, zoom, and rotate operations. Participants with more direct touch interface experience tended to use their dominant hand while interacting with the surface and used a greater variety of fingers and touchpoints. Less-experienced users gravitated toward using single-finger gestures, which is in agreement with Ryall et al.’s [25] observation that users, at first, tend to use singlefinger gestures, simulating the mouse or stylus inputs. In addition, novice users employed less effective gestures such the doggie paddle gesture (see Figure 5d). Novices and users with less touch-input experience may not be comfortable using the touch-mode and may not be familiar with all gestures supported by the system (e.g., the tapping instances that we saw for zooming in). Marshall et al. [19] examined the in-the-wild use of multi-touch tabletops; their study showed that when users approach a tabletop their first touch tended to be a single tap or a double tap. They also suggested that users would give up quickly if they weren’t able to receive an immediate feedback from the first touch interactions. In all, our observations in this study support difficulty of designing crowd interaction [4] tabletop interfaces for public spaces. Subtle touch feedback such as those suggested by Wigdor et al. [31] might also improve the understandability of the interface for novices. In addition to touch input, we provided the participants with a button panel that they used voluntarily or for trouble-shooting. We think having an additional input option in the digital map interfaces has benefits for users’ performances (similar to the conclusion of Wobbrock et al. [32]). An additional option for the digital map users is the ability to pin points and locations on the map. In some cases users, who found start and end points, had to search for those points a second time. Being able to pin the points could decrease the users’ map interaction time and could possibly enhance their overall performance. This feature is provided by standard digital map interfaces that offer direction services (e.g. Google maps). However, placing pins on
points of interest might also be useful in kiosk-style map applications, suggesting intriguing opportunities for augmenting tabletop interfaces with tangible interaction. CONCLUSION AND FUTURE WORK
The current study offers some insight into the relationship between spatial ability, map interaction, and input type. Map interaction styles on tabletops and desktops were similar. And, despite our hypothesis, there was no significant difference in performance between users in the two conditions. Additionally, spatial ability did not predict navigation performance. Instead users seemed to rely on a variety of other skills to complete the navigation tasks. Tabletop users employed a variety of gestures to interact with the map, some of which have not been previously reported. This suggests that there may be task-dependent differences in users’ gesture choices. In other words, interacting with a map is different than manipulating media objects on the display, which makes gestures such as walking on the table with two fingers more convenient and intuitive. More research is needed to explore the underlying principles of gestures that can be applied to a map application on a tabletop, which enables developing a more user-friendly system. In the future we hope to extend our study to real-world settings with multi-user collaborative interactions on tabletop and desktop map interfaces. We are mostly interested in exploring the effects of collaboration on users’ navigation performance and the way-finding strategies in both conditions. ACKNOWLEDGMENTS
Omitted for blind review. REFERENCES
1. Antle, A.N., Bevans, A., Tanenbaum, J., Seaborn K., and Wang, S. Futura: Design for collaborative learning and game play on a multi-touch digital tabletop. In Proc. TEI’11, ACM Press (2011), 93-100. 2. Astur, R.S., Ortiz, M.L., and Sutherland, R.J. A characterization of performance by men and women in a virtual Morris water task: A large and reliable sex difference. Behav. Brain Research, 93 (1998), 185-190. 3. Bilandzic, M., Foth, M., and De Luca, A. CityFlocks: Designing social navigation for urban mobile information systems. In Proc. DIS’08, ACM Press (2008), 174-183. 4. Block, F., Wigdor, D., Phillips, B. C., Horn, M. S., Shen, C. FlowBlocks: A multi-touch UI for crowd interaction. To appear in Proc. UIST’12, ACM Press (2012). 5. Boring, S., Jurmu, M., and Butz, A. Scroll, tilt or move it: Using mobile phones to continuously control pointers on large public displays. In Proc. OZCHI’09, ACM Press (2009), 161-168.
6. Chai, X. J., Jacobs, L. F. Effects of cue types on sex differences in human spatial memory. Behav. Brain Research 208, 2 (2010), 336-342. 7. Chase, W.G. Spatial representation of taxi drivers. In R. Rogers & J.A. Sloboda (eds.), The acquisition of symbolic skills, Plenum Press (1983), 391-405. 8. Czerwinski, M., Tan, D.S., and Robertson, G.G. Women take a wider view. In Proc. CHI’02. ACM Press (2002), 195-202. 9. Forlines, C., Shen, C. DTLens: Multi-user tabletop spatial data exploration. In Proc. UIST’05, ACM Press (2005), 119-122. 10. Forlines, C., Esenther, A., Shen, C., Wigdor, D., Ryall, K. Multi-user, multi-display interaction with a singleuser, single-display geospatial application. In Proc. UIST’06. ACM Press (2006), 273-276. 11. Forlines, C., Wigdor, D., Shen, C., and Balakrishnan, R. Direct-touch vs. mouse input for tabletop displays. In Proc. CHI’07. ACM Press (2007), 647-656. 12. Hang, A., Rukzio, E., and Greaves, A. Projector phone: A study of using mobile phones with integrated projector for interaction with maps. In Proc. MobileHCI’08. ACM Press (2008), 207-216. 13. Hinrichs, U. and Carpendale S. Gestures in the wild: Studying multi-touch gesture sequences on interactive tabletop exhibits. In Proc. CHI’11, ACM Press (2011), 3023-3032. 14. Hornecker, E. “I don’t understand it either, but it is cool”: Visitor interactions with a multi-touch table in a museum. In Proc. Tabletop’08 ,IEEE (2008), 121-128. 15. Hornecker, E., Marshall, P., Dalton, N.S., and Rogers, Y. Collaboration and interference: Awareness with mice or touch input. In Proc. CSCW’08, ACM Press (2008), 167-176. 16. Kin, K., Agrawala, M., and DeRose, T. Determining the benefits of direct-touch, bimanual, and multifinger input on a multitouch workstation. In Proc. Graphics Interface’09, ACM Press (2009), 119-124. 17. Lawton, C.A. Gender differences in way-finding strategies: Relationship to spatial ability and spatial anxiety. Sex Roles 30 (1994), 765-779. 18. MacEachren, A.M. How Maps Work, Guilford Press, New York NY, 1995. 19. Marshall, P., Morris, R., Rogers, Y., Kreitmayer, S., and Davies, M. Rethinking ‘multi-user’: An in-the-wild study of how groups approach a walk-up-and-use tabletop interface. In Proc. CHI’11, ACM Press (2011), 3033-3042.
20. Morris, M. R., Wobbrock, J. O., and Wilson, A. D. Understanding users’ preferences for surface gestures. In Proc. Graphics Interface’10, ACM Press (2010), 261-268. 21. Müller-Tomfelde, C. and Schremmer, C. Touchers and mousers: Commonalities and differences in co-located collaboration with multiple input devices. In Proc. CHI’08, ACM Press (2008), 1149-1152. 22. Robinson, A. H. The look of maps: An examination of cartographic design. Wisconsin Press (1952). 23. Rohs, M., Schöning, J., Raubal, M., Essl, G., and Krüger, A. Map navigation with mobile devices: Virtual versus physical movement with and without visual context. In Proc. ICMI’07, ACM Press (2007), 146-153. 24. Rukzio, E., Müller, M., and Hardy, R. Design, implementation and evaluation of a novel public display for pedestrian navigation: the rotating compass. In Proc. CHI’09, ACM Press (2009), 113-122. 25. Ryall, K., Morris, M., Everitt, K., Forlines, C., Shen, C. Experiences with and observations of direct-touch tabletops. In Proc. Tabletop’06, IEEE (2006), 89-96. 26. Schöning, J., Rohs, M., Kratz, S., Löchtefeld, M., and Krüger, A. Map torchlight: A mobile augmented reality camera projector unit. In Proc. CHI’09, ACM Press (2009), 3841-3845. 27. Shaer, O., Strait, M., Valdes, C., Feng, T., Lintz, M., and Wang, H. Enhancing genomic learning through tabletop interaction. In Proc. CHI’11, ACM Press (2011), 2817-2826. 28. Tan, D. S., Stefanucci, J. K., Proffitt, D. R., and Pausch, R. Kinesthetic cues aid spatial memory. In Ext. Abstracts CHI’02, ACM Press (2002), 806-807. 29. Urakami, J. Developing and testing a human-based gesture vocabulary for tabletop systems. Human Factors (2012) doi:10.1177/0018720811433052. 30. Vandenberg, S.G. and Kuse, A.R. Mental rotations, a group test of three-dimensional spatial visualization. Perceptual and Motor Skills 47, 2 (1978), 599-604. 31. Wigdor, D., Williams, S., Cronin, M., Levy, R., White, K., Mazeev, M., and Benko, H. Ripples: Utilizing percontact visualizations to improve user interaction with touch displays. In Proc. UIST’09. ACM Press (2009), 312. 32. Wobbrock, J.O., Morris, M.R., and Wilson, A.D. Userdefined gestures for surface computing. In Proc. CHI’09, ACM Press (2009), 1083-1092. 33. Wu, M. and Balakrishnan, R. Multi-finger and whole hand gestural interaction techniques for multi-user tabletop displays. In Proc UIST’03, ACM Press (2003).