A large number of statistical data sets have been published on the web by various ... users consistent access to all data sources in the repository through queries using well-defined standards. ... . 2014.
Toward a framework for statistical data integration Ba-Lam Do, Peb Ruswono Aryan, Tuan-Dat Trinh, Peter Wetz, Elmar Kiesling, and A Min Tjoa TU Wien, Vienna, Austria {ba.do,peb.aryan,tuan.trinh, peter.wetz,elmar.kiesling,a.tjoa}@tuwien.ac.at
Abstract. A large number of statistical data sets have been published on the web by various organizations in recent years. The resulting abundance creates opportunities for new analyses and insights, but that frequently requires integrating data from multiple sources. Inconsistent formats, access methods, units, and scales hinder data integration and make it a tedious or infeasible task. Standards such as the W3C RDF data cube vocabulary and the content-oriented guidelines of SDMX provide a foundation to tackle these challenges. In this paper, we introduce a framework that semi-automatically performs semantic data integration on statistical raw data sources at query time. We follow existing standards to transform non-semantic data structures to RDF format. Furthermore, we describe each data set with semantic metadata to deal with inconsistent use of terminologies. This metadata provides the foundation for cross-dataset querying through a mediator that rewrites queries appropriately for each source and returns consolidated results.
1
Introduction
In recent years, open data policies have been adopted by a large number of governments and organizations. This proliferation of open data has resulted in the publication of a large number of statistical data sets in various formats, which are available through different access mechanisms: (i) Download in raw formats: When organizations began to implement open data policies, governments and organizations typically started publishing data in raw formats such as PDF, spreadsheets, or CSV. This choice is typically driven by existing workflows and motivated by its simplicity and ease of implementation. To compile and integrate relevant information from such data sets, users have to download them entirely, extract subsets of interest, and identify opportunities to relate data from scattered sources themselves. Exploring and integrating such data is, hence, a tedious and time-consuming manual process that requires substantial technical expertise. (ii) Programmatic access via APIs: Many data providers expose their data to developers and applications via APIs (Application Programming Interfaces). Statistical data is frequently represented in XML format using SDMX1 , a stan1
http://sdmx.org, accessed Sept. 10, 2015
dard sponsored by a consortium of seven major international institutions including the World Bank, European Central Bank, and the United Nations. This allows users to query and extract data using respective APIs provided by data publishers. Although this approach provides more granular and flexible access, the data exposed through APIs typically cannot be integrated automatically and therefore remains isolated and dispersed. (iii) Query access via RDF format: Finally, a growing number of organizations publish Linked Open Data (LOD) using RDF as a standard model for data interchange on the web. Ideally, LOD can be queried across data sets using the SPARQL query language. However, this requires the existence of links between respective data sets, consistent use of units, scales, and naming conventions, plus considerable expertise. These diverse and inconsistent data publishing practices raise challenging issues: (i) to access and integrate data, users need technical expertise, (ii) due to inconsistent vocabulary and entity naming [2], integrating data across data sets is difficult even when all the data sources are available in RDF format, (iii) standards for statistical data publishing exist, but they have not been widely adopted so far. Existing standards include the W3C RDF data cube vocabulary (QB) [6] and the content-oriented guidelines2 of Statistical Data and Metadata Exchange (SDMX). These standards establish consistent principles for publishing statistical data and relating statistical data sources. In our previous work [9], we found only approximately 20 sources that use the QB vocabulary. To address these challenges, this paper introduces a data integration framework that consists of three major components, i.e., an RML mapping service, a semantic metadata repository, and a mediator. We use the RML mapping service in a pre-processing step to convert publicly available data sets into the RDF format. This service extends RML3 [7] with mechanisms to transform statistical data from non-RDF formats (e.g., CSV, XSL, JSON, and XML) to RDF format following the QB vocabulary. Next, the semantic metadata repository resolves inconsistent terminologies used in different data sets. This repository describes the structure of a W3C cube statistical data set and captures co-references that match a term/value used in the data set with the consolidated term/value of the repository. Finally, the mediator acts as a single point of access that provides users consistent access to all data sources in the repository through queries using well-defined standards. To this end, the mediator rewrites the user’s SPARQL query and sends appropriate queries to the RML mapping service and the involved SPARQL endpoints, using the terminology of these sources obtained via the semantic metadata repository. The remainder of this paper is organized as follows. Section 2 introduces a running example used throughout the paper, provides background information on available standards, and outlines requirements for data integration. Section 3 then introduces our data integration approach and Section 4 illustrates it by 2 3
http://sdmx.org/?page_id=11, accessed Sept. 10, 2015 http://semweb.mmlab.be/rml/index.html, accessed Sept. 10, 2015
means of a practical use case. Section 5 discusses related work and Section 6 concludes with an outlook on future research.
2
Background
2.1
Running Example
In our running example, we use a query to “compare the population of the UK” based on three data sources, each using different formats, semantics, and access mechanisms. These data sources are (i) the UK government4 , (ii) the World Bank5 , and (iii) the European Union6 . The UK data source is published in Excel spreadsheet format. It includes population data from 1964 to 20137 . The World Bank provides population data via APIs8 . Finally, the EU data source provides population data in RDF format9 , which is organized by criteria such as time, sex, and age group. Table 1, Table 2, and Listing 1 show excerpts from the data sets. Mid-Year Annual Mid-Year Population Percentage (millions) Change 2011
63.3
0.84
2012
63.7
0.66
2013
64.1
0.63
Table 1: UK government population data in spreadsheet format (excerpt)
< wb:data > < wb:indicator id = " SP . POP . TOTL " > Population , total < wb:country id = " GB " > United Kingdom < wb:date > 2014 < wb:value > 64510376 < wb:decimal >1
Listing 1: World Bank population data for the UK in XML format (excerpt)
sdmx-d: freq
sdmx-d: timePeriod
sdmx-d: refArea
sdmx-c:freqA
2014
geo:UK
ag:TOTAL
sdmx-c:sex-T
64 308 261
sdmx-c:freqA
2014
geo:UK
ag:Y LT15
sdmx-c:sex-T
11 333 471
sdmx-c:freqA
2014
geo:UK
ag:Y15–64
sdmx-c:sex-F
20 929 655
sdmx-c:freqA
2014
geo:UK
ag:Y GE65 sdmx-c:sex-M
5 066 505
sdmx-d:age sdmx-d:sex
sdmx-m: obsValue
Table 2: EU population data in RDF format (excerpt)10 4 5 6 7
8 9 10
http://www.ons.gov.uk/, accessed Sept. 10, 2015 http://data.worldbank.org/indicator/all, accessed Sept. 10, 2015 http://semantic.eea.europa.eu/sparql, accessed Sept. 10, 2015 http://www.ons.gov.uk/ons/rel/pop-estimate/population-estimates-foruk--england-and-wales--scotland-and-northern-ireland/2013/chd-1-forstory.xls, accessed Sept. 10, 2015 http://api.worldbank.org/countries/GB/indicators/SP.POP.TOTL http://rdfdata.eionet.europa.eu/eurostat/data/demo_pjanbroad sdmx-d: http://purl.org/linked-data/sdmx/2009/dimension sdmx-m: http://purl.org/linked-data/sdmx/2009/measure
2.2
Structure and Standards for Statistical Data
Statistical data refers to data from a survey or administrative source used to produce statistics11 . A statistical data set is characterized by [6]:(i) a set of dimensions that qualify observations (e.g., time interval of the observation or geographical area that the observation covers), (ii) a set of measures that describe the objects of the observation (e.g., population or annual percentage change), and (iii) attributes that facilitate interpretation of the observed values (e.g., units of measure or scaling factors). The W3C RDF data cube vocabulary [6] provides a standard for publishing multi-dimensional data on the web. It builds upon the SDMX standard in order to represent statistical data sets in a standardized RDF format. The data cube vocabulary does not, however, define common terms/values to use in a data set. SDMX is an ISO standard12 for the exchange of statistical data among organizations. The standard includes content-oriented guidelines that prescribe a set of common concepts and codes that should be used for statistical data. To facilitate automated interconnection between data sets, neither the data cube vocabulary, nor content-oriented guidelines by themselves are sufficient. Therefore, in order to provide a sound foundation for statistical data integration we combine these standards to explicitly capture both the structure and the semantics of statistical data.
2.3
Requirements of Statistical Data Integration
Because any multi-measure data set (e.g., the UK’s population data set in Table 1) can be split into multiple single-measure data sets [6], without loss of generality, we focus on data integration requirements for single-measure data sets. Two single-measure data sets can be integrated if: (i) They use the same sets of dimensions and the same measure. The transformation of attributes is necessary if different units or scales are used. For example, we can compare population figures of the UK government and World Bank data sets, but because the data sources use different scales (i.e., absolute number vs. millions), we need to convert observed values first. (ii) They provide different measures for the same set of dimensions. For instance, we can compare statistical data on different objects (e.g., population, annual percentage change) in the same area and time. (iii) They provide the same measure, but for a different set of dimensions. Integration can be achieved by assigning fixed values to dimensions that do not appear in both data sets. For instance, to integrate the UK government
11 12
sdmx-c: http://purl.org/linked-data/sdmx/2009/code geo: http://dd.eionet.europa.eu/vocabulary/eurostat/geo/ ag: http://dd.eionet.europa.eu/vocabulary/eurostat/age/ https://stats.oecd.org/glossary/detail.asp?ID=532, accessed Sept. 10, 2015 http://sdmx.org/?p=1215, accessed Sept. 10, 2015
and World Bank data sets, we assign ag:TOTAL (all age-groups) to the agegroup dimension, sdmx-c:sex-T to the sex dimension, and sdmx-c:freqA to the frequency dimension. 2.4
Role of Stakeholders
The proposed framework will be of interest for three main groups of stakeholders: (i) data providers, which include governments or organizations who publish data in formats such as CSV, spreadsheet, and RDF; these organizations can easily transform such data in non-RDF formats into RDF Data Cubes by means of RML mappings (ii) developers, who build innovative data integration applications; they can also create RML mappings for data sets relevant in their application context, and (iii) end users who lack semantic web knowledge and programming skills, and hence need appropriate tools to generate SPARQL queries in order to compare and visualize data.
3 3.1
Data Integration Framework Architecture
http:
Sources
RDF
Database
XML, CSV, XSL... HTML
RML Mapping Service
SPARQL endpoints Data set Annotator
Metadata repository
Mediator Framework
User/ Application
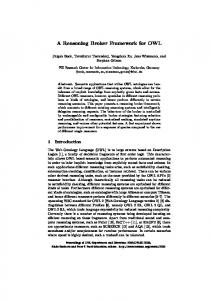
Fig. 1: Architecture overview
Figure 1 illustrates the architecture of our data integration framework. It facilitates two main tasks:
(i) Management of a semantic metadata repository: The semantic metadata repository captures the semantics of each data set. We use a data source analysis algorithm described in our previous work [9] to semi-automatically generate RDF metadata from data sets. In this process, the subject of each data set needs to be provided manually because a data set’s title and data structure are typically not sufficient to identify their subject accurately. To this end, developers and publishers can use the data set annotator to describe the structure and semantics of a data set (e.g., components, subject) and to add co-reference information to common concepts and values. The RML mapping service provides a means to transform non-RDF statistical data sets into W3C data cube vocabulary data sets. The resulting metadata repository 13 is available on the web as LOD. (ii) Querying and integrating data sets in the repository: The mediator 14 acts as a key component that allows to query data sets in the repository and integrate the results into a consolidated representation. It makes use of the repository to identify appropriate data sets and then calls the RML mapping service 15 and SPARQL endpoints to obtain the data. 3.2
RML Mapping Service
To transform statistical data sets published in non-RDF formats into RDF, we use RML [7] and deploy our extended RML processor as a web service. This service accepts RML as an input, which specifies source formats and mappings to RDF triples following the QB vocabulary. The processor dereferences input URLs, retrieves RML mapping specifications, and generates RDF triples accordingly. For our RML mapping service, we extended RML as follows: (i) XLS format support: The UK government’s population data set is published in Excel spreadsheet format (XLS), which is currently not supported by RML. In order to support this format, we introduce a new URI (i.e., ql:Spreadsheet) and associate it with the rml:referenceFormulation property to interpret references in rml:iterator. Because a spreadsheet may contain multiple sheets and the actual content is within a range of cells, we use the following syntax to define an iterator: < SheetName >! < begin - datacell >: < end - datacell > [: < begin - headercell >: < end - headercell >]}}
(ii) Parameterized RML mappings: To generate API calls (e.g., query data for a specific country or a specific indicator) automatically, we use query parameters in the mapping URLs. To this end, we define templated data sources by extending the rml:source property and define an rmlx:sourceTemplate16 property that allows for the use of templated variables in curly brackets. We then use values given in the query parameters to fill the templates. 13 14
15 16
http://ogd.ifs.tuwien.ac.at/sparql, accessed Sept. 10, 2015 http://linkedwidgets.org/statisticalwidgets/mediator/, accessed Sept. 10, 2015 http://pebbie.org/mashup/rml, accessed Sept. 10, 2015 rmlx:http://pebbie.org/ns/rmlx/#
rmlx : so urceTem plate " http :// api . worldbank . org / countries /{ country_code }/ indicators /{ indicator }? format = json & page =1& per_page =1"
3.3
Semantic Metadata Repository
qb:component
qb:dataSet
dc:subject map:method
map:describes rdfs:label
map:hasValue
void:sparqlEndpoint map:rml
map:reference
map:fixedValue rdfs:label rdf:type
map:reference
Fig. 2: Structure of semantic metadata17
Figure 2 illustrates the structure of the semantic metadata, which can be split into two parts. The first part describes co-reference information for components and values in a data set using map:reference predicates. The second part aims to describe the structure and access method for the data set. In the first part, to harmonize terms that refer to the same concept, we use concepts in SDMX’s content-oriented guidelines (COG). For instance, we use sdmx-d:refArea for spatial dimensions and sdmx-d:refPeriod for temporal dimensions. In COG, there is only one concept for measures, i.e., sdmx-m:obsValue. To properly represent the semantics of data sets that use different measures, we split each multi-measure data set into multiple single-measure data sets and create metadata for each single-measure data set. In addition, if a concept is not defined in COG, we will introduce a new concept for it. Furthermore, to relate values of dimensions and attributes to common values, we use the following approach: First, some data sets may combine multiple components (e.g., age, sex, education) in one integrated component. In such cases, we need to split these integrated components into separate components and identify values for each. Next, we use available code lists18 from COG for defined components, e.g., age, sex, currency. In addition, we consider to reuse available code lists provided by data publishers if these code lists provide wide coverage. These values are listed by LSD Dimensions [13], a web based application that monitors the usage of dimensions and codes. Finally, it is also necessary to propose new code lists. For this task, we developed two algorithms [8] for values of spatial and temporal dimensions. The first algorithm uses Google’s Geocoding 17
18
map: http://linkedwidgets.org/statisticalwidgets/mapping/ dc: http://purl.org/dc/elements/1.1/ http://sdmx.org/?page_id=1513, accessed Sept. 10, 2015
API to generate a unique URI for corresponding areas that previously were represented by different URIs. The second algorithm uses time patterns to match temporal values to URIs used by the UK’s time reference service19 . In the second part, we use the map:component predicate to represent dimensions, measures, and attributes and attach label, type, fixed value, and list of values predicated to it (only for dimensions and attributes). The semantics of a data set are represented by dc:subject, map:method, map:endpoint, map:rml, rdfs:label, and map:describes predicates. Because some data sets (e.g., the EU’s population data set) do not specify the topic of the observed measure, we use the dc:subject predicate to describe the topic of each data set using World Bank indicators20 . Next, the map:method predicate specifies the query method for the data. Possible values are SPARQL, API, and RML mapping. If this value is API or RML mapping, we use the map:rml predicate to specify a URL that represents the RML mapping for this data set. If the value for map:method is SPARQL, we describe the endpoint containing this data set through the map:endpoint predicate. Furthermore, we use the map:describes predicate to establish relations between a data set and values of its dimensions or attributes. 3.4
Mediator
The mediator acts as a single access point that automatically integrates data sets based on the semantic metadata in the repository. Execution of a query by the mediator involves four steps as follows: (i) Query acceptance: A user (or an application) sends a query to the mediator to start a cross-dataset query. This query is specified in SPARQL and uses consolidated concepts and values from the repository. (ii) Query rewriting: The mediator rewrites the query to translate it into appropriate queries for matching data sources. To this end, it first identifies components in the query, e.g., subject, dimensions, attributes, and filter conditions. Next, the mediator queries the repository to identify data sets that match the query (cf. Section 2.3). Finally, the mediator rewrites the input query to different queries. There are three cases: (i) if the query method of the data set is SPARQL, it will generate a new SPARQL query for the relevant endpoint; (ii) if the value is API, the mediator combines the RML mapping from the metadata with the parameters of the query. After that, it utilizes the RML mapping service to analyze this URI to transform the data set to RDF; (iii) Otherwise, the mediator calls the RML mapping service to analyze RML mappings to transform the data set to RDF. (iii) Rewrite results: The mediator obtains results from the various sources and integrates them before returning them to the user. Each result uses concepts and values of the respective data source and, hence, cannot be integrated directly. The mediator, therefore, reuses co-reference information of each data 19 20
http://reference.data.gov.uk/id/gregorian-interval, accessed Sept. 10, 2015 http://data.worldbank.org/indicator/all, accessed Sept. 10, 2015.
set to rewrite results into new representations. After that, it applies filter conditions that appear in the query. Next, if relevant data sets use different units or scales to describe observed values, the mediator transforms these values into a common unit or scale. Finally, it integrates the results into one final result. (iv) Return result to the user or application.
4
Use Case Results
In our running example (cf. Section 2.1), our goal is to compare the population of the UK from different data sources. To this end, we use the input query shown in Listing 2. PREFIX qb : < http :// purl . org / linked - data / cube # > SELECT * WHERE { ? ds dc : subject < http :// data . worldbank . org / indicator / SP . POP . TOTL >. ? o qb : dataSet ? ds . ? o sdmx - m : obsValue ? obsValue . ? o sdmx - d : refPeriod ? refPeriod . ? o sdmx - d : refArea ? refArea . Filter (? refArea = < http :// linkedwidgets . org / s t a t i s t i c a l w i d g e t s / ontology / geo / UnitedKingdom >) }
Listing 2: Example input query for cross-dataset population comparison The mediator identifies three data sets that satisfy this query. Therefore, it rewrites the input query as follows: (i) It generates a new SPARQL query for the EU data set based on co-reference information and structure of this data set. Listing 3 shows the query generated by the mediator. (ii) For the World Bank data set, the mediator combines the RML mapping21 from its metadata with subject and geographical parameters. Co-reference information of the geographical area is also used to determine the parameters of the query. Listing 4 shows the resulting query for World Bank’s data set. (iii) To obtain data from the UK government data set, the mediator calls the RML mapping service to obtain the RML mapping22 (Listing 5 shows the query). SELECT * WHERE { ? o qb : dataSet < http :// rdfdata . eionet . europa . eu / eurostat / data / demo_pjanbroad >. ? o sdmx - m : obsValue ? obsValue . ? o sdmx - d : timePeriod ? timePeriod . ? o sdmx - d : refArea ? refArea . ? o sdmx - d : freq < http :// purl . org / linked - data / sdmx /2009/ code # freq -A >. ? o sdmx - d : age < http :// dd . eionet . europa . eu / vocabulary / eurostat / age / TOTAL >. ? o sdmx - d : sex < http :// purl . org / linked - data / sdmx /2009/ code # sex -T >. FILTER (? refArea = < http :// dd . eionet . europa . eu / vocabulary / eurostat / geo / UK >)
Listing 3: EU data set query generated by the mediator 21 22
http://pebbie.org/mashup/rml-source/wb, accessed Sept. 10, 2015 http://pebbie.org/mashup/rml-source/ons_pop, accessed Sept. 10, 2015
http :// pebbie . org / mashup / rml ? rmlsource = http :// pebbie . org / mashup / rml - source / wb & subject = http :// data . worldbank . org / indicator / SP . POP . TOTL & refArea = http :// pebbie . org / ns / wb / countries / GB
Listing 4: World bank data set query generated by the mediator http :// pebbie . org / mashup / rml ? rmlsource = http :// pebbie . org / mashup / rml - source / ons_pop
Listing 5: UK data set query generated by the mediator Once the mediator has received the results from all three queries, it uses coreference information in the repository to integrate the results. In our example, the scales are different. The UK’s data set uses a millions scale whereas the other data sets use absolute number scaling, hence, each value in the UK’s data set is multiplied by one million. Table 3 shows an excerpt of the final result. dataset
sdmx-d: timePeriod
sdmx-d:refArea
sdmx-m: obsValue
UK
interval:2013
sw:UnitedKingdom 64 100 000
WB
interval:2013
sw:UnitedKingdom 64 106 779
EU
interval:2013
sw:UnitedKingdom 63 905 297
Table 3: Excerpt from the integrated population query result23
5
Related Work
We organize the related work into three main categories and present work done in relation to statistical data: data integration research, data transformation research, and research on query rewriting. Building data integration applications has received significant interest of researchers. K¨ ampgen et al. [11], [12] establish mappings from LOD data sources to multidimensional models used in data warehouses. They use OLAP (Online Analytical Processing) operations to access, analyse, and integrate the data. Sabou et al. [16] combine tourism indicators provided by the TourMIS system24 with economic indicators provided by World Bank, Eurostat, and the United Nations. Capadisli et al. [3], [4] introduce transformations to publish statistical data sources using the SDMX-ML standard as LOD. This approach allows users to identify the relationship between different indicators used in these data sources. Defining mappings from source data to a common ontology enables to compose on-the-fly integration services, as has been shown by [10], [19]. In data transformation research, Salas et al. [17] introduce OLAP2DataCube and CSV2DataCube. These tools are used to transform statistical data from OLAP and CSV formats to RDF following the QB vocabulary. They also present 23
24
interval: http://reference.data.gov.uk/id/gregorian-year/ sw: http://linkedwidgets.org/statisticalwidgets/ontology/geo/ http://www.tourmis.info/index_e.html, accessed Sept. 10, 2015
a mediation architecture for describing and exploring statistical data which is exposed as RDF triples, but stored in relational databases [15]. The Code project25 introduces a tool kit containing the Code pdf extractor and Code data extractor and triplifier that allow to extract tabular data from PDF documents, and transform this data to W3C cube statistical data. Research on query rewriting has also attracted a large number of researchers. Approaches range from using rewriting rules [5], co-reference information [18], to the use of service descriptions [14], in order to rewrite a SPARQL query into different SPARQL queries. Furthermore, using mappings between ontologies and XML Schema, Bikakis et al. [1] can translate a SPARQL query to an equivalent XQuery query to access XML databases.
6
Conclusion and Future Work
This paper presents a framework for data integration using the W3C RDF data cube vocabulary and the content-oriented guidelines of SDMX. Data in nonRDF format is transformed to RDF using an RML mapping service; a semantic metadata repository stores the information required to handle heterogeneity in terminologies and scales used in the data sets. Finally, the mediator serves as a single point of access that facilitates cross-dataset querying. Our use case example demonstrates the capability of the framework to integrate multiple data sources which are published in varying formats, use heterogeneous scales, and are accessible by different means. At present, the framework is implemented providing preliminary results. The mediator allows for simple queries, for instance, getting data on individual subjects for a specific area and period. As a next step, we will extend the mediator, adding support for more complex analyses that involve additional query conditions and require the integration of data on multiple subjects. In addition, it is necessary to evaluate the performance of the framework. Currently, the most time-consuming task is to answer queries for data in non-RDF format, because this process requires both RDF materialization and query rewriting. Furthermore, we plan to improve the data source analysis algorithm and data set annotator tool to better support to data publishers and developers in creating metadata. Finally, using semantics of data to perform step-wise suggestions of appropriate relationships/conditions seems to be promising for allowing users to generate queries in an efficient way.
References 1. Bikakis, N., Gioldasis, N., Tsinaraki, C., Christodoulakis, S.: Querying xml data with sparql. In: Proceedings of International DEXA Conference. pp. 372–381. Lecture Notes in Computer Science, Springer Berlin Heidelberg (2009) 2. Bizer, C., Heath, T., Berners-Lee, T.: Linked data - the story so far. International Journal on Semantic Web and Information Systems (IJSWIS) 5(3), 1–22 (2009) 25
http://code-research.eu/vision/, accessed Sept. 10, 2015
3. Capadisli, S., Auer, S., Ngomo, A.C.N.: Linked sdmx data: Path to high fidelity statistical linked data. Semantic Web 6(2), 105–112 (2015) 4. Capadisli, S., Auer, S., Riedl, R.: Linked statistical data analysis. In: 1st International Workshop on Semantic Statistics (SemStats) (2013) 5. Correndo, G., Salvadores, M., Millard, I., Glaser, H., Shadbolt, N.: Sparql query rewriting for implementing data integration over linked data. In: Proceedings of the EDBT/ICDT Workshops. ACM (2010) 6. Cyganiak, R., Reynolds, D.: The RDF data cube vocabulary (2011), http://www. w3.org/TR/vocab-data-cube/ 7. Dimou, A., Sande, M.V., Colpaert, P., Verborgh, R., Mannens, E., de Walle, R.V.: Rml: A generic language for integrated RDF mappings of heterogeneous data. In: Proceedings of the Workshop on Linked Data on the Web (LDOW 2014). CEURWS.org (2014) 8. Do, B.L., Trinh, T.D., Aryan, P.R., Wetz, P., Kiesling, E., Tjoa, A.M.: Toward a statistical data integration environment the role of semantic metadata. In: Proceedings of 11th International Conference on Semantic Systems (SEMANTiCS 2015). ACM (2015) 9. Do, B.L., Trinh, T.D., Wetz, P., Anjomshoaa, A., Kiesling, E., Tjoa, A.M.: Widgetbased exploration of linked statistical data spaces. In: Proceedings of 3rd International Conference on Data Management Technologies and Applications (DATA 2014). SciTePress (2014) 10. Harth, A., Knoblock, C.A., Stadtm¨ uller, S., Studer, R., Szekely, P.: On-the-fly integration of static and dynamic linked data. In: Proceedings of International Workshop on Consuming Linked Data (COLD 2013). CEUR-WS.org (2013) 11. K¨ ampgen, B., Harth, A.: Transforming statistical linked data for use in olap systems. In: Proceedings of the 7th International Conference on Semantic Systems. ACM (2011) 12. K¨ ampgen, B., Stadtm¨ uller, S., Harth, A.: Querying the global cube: integration of multidimensional datasets from the web. In: Proceedings of 19th International Conference on Knowledge Engineering and Knowledge Management (EKAW 2014). Springer International Publishing (2014) 13. Mero˜ no-Pe˜ nuela, A.: Lsd dimensions: Use and reuse of linked statistical data. In: Proceedings of EKAW Satellite Events. Springer International Publishing (2014) 14. Quilitz, B., Leser, U.: Querying distributed RDF data sources with sparql. In: Proceedings of 5th European Semantic Web Conference, ESWC. pp. 524–538. Lecture Notes in Computer Science, Springer Berlin Heidelberg (2008) 15. Ruback, L., Manso, S., Salas, P.E.R., Pesce, M., Ortiga, S., Casanova, M.A.: A mediator for statistical linked data. In: Proceedings of the 28th Annual ACM Symposium on Applied Computing. pp. 339–341 (2013) 16. Sabou, M., Arsal, I., Brasoveanu, A.M.P.: Tourmislod: A tourism linked data set. Semantic Web 4(3), 271–276 (2013) 17. Salas, P.E.R., Mota, F.M.D., Martin, M., Auer, S., Breitman, K., Casanova, M.A.: Publishing statistical data on the web. International Journal of Semantic Computing 6(4), 373–388 (2012) 18. Schlegel, T., Stegmaier, F., Bayerl, S., Granitzer, M., Kosch, H.: Balloon fusion: Sparql rewriting based on unified co-reference information. In: International Workshop on Data Engineering Meets the Semantic Web. pp. 254–259. IEEE (2014) 19. Stadtm¨ uller, S., Speiser, S., Harth, A., Studer, R.: Data-fu: a language and an interpreter for interaction with read/write linked data. In: Proceedings of the 22nd international conference on World Wide Web. ACM (2013)