Daniel Koretz, Project Director, CRESST/Harvard Graduate School of Education. Copyright ... This technical report presents an effort to develop more systematic ... testâare represented by area A. Meaningful gains on the focal test that do not.
Toward a Framework for Validating Gains Under High-Stakes Conditions CSE Technical Report 551 Daniel M. Koretz CRESST/Harvard Graduate School of Education Daniel F. McCaffrey and Laura S. Hamilton CRESST/RAND Education
December 2001
Center for the Study of Evaluation National Center for Research on Evaluation, Standards, and Student Testing Graduate School of Education & Information Studies University of California, Los Angeles Los Angeles, CA 90095-1522 (310) 206-1532
Project 2.3 Accommodation Daniel Koretz, Project Director, CRESST/Harvard Graduate School of Education Copyright © 2001 The Regents of the University of California The work reported herein was supported under the Educational Research and Development Centers Program, PR/Award Number R305B60002, as administered by the Office of Educational Research and Improvement, U.S. Department of Education. The findings and opinions expressed in this report do not reflect the positions or policies of t h e National Institute on Student Achievement, Curriculum, and Assessment, the Office of Educational Research and Improvement, the U.S. Department of Education, or RAND.
TOWARD A FRAMEWORK FOR VALIDATING GAINS UNDER HIGH-STAKES CONDITIONS Daniel M. Koretz CRESST/Harvard Graduate School of Education Daniel F. McCaffrey and Laura S. Hamilton CRESST/RAND Education Abstract Although high-stakes testing is now widespread, methods for evaluating the validity of gains obtained under high-stakes conditions are poorly developed. This report presents an approach for evaluating the validity of inferences based on score gains on high-stakes tests. It describes the inadequacy of traditional validation approaches for validating gains under high-stakes conditions and outlines an alternative validation framework for conceptualizing meaningful and inflated score gains. The report draws on this framework to suggest a classification of forms of test preparation and their likely effects on the validity of gains. Finally, it suggests concrete directions for validation efforts that would be consistent with the framework.
For nearly three decades, high-stakes testing has grown increasingly widespread and important in U.S. education. This development has been explosive during the past decade. Roughly half of the states now make graduation contingent on test scores; roughly 40 states use test scores for schoollevel accountability, in many cases tying financial and other rewards and sanctions to test scores; and the use of scores as promotional gates is enjoying a resurgence. Test-based accountability has been enshrined in Title I for some years, and the current Administration’s education proposals would institute testbased rewards and sanctions nationwide. High-stakes uses arguably have become the most important applications of large-scale testing in American education. The validation of score-based inferences has not kept pace with this development. The validity evidence typically provided with tests is insufficient to indicate whether inferences about changes under high-stakes conditions are justified. Few efforts are made to evaluate directly score gains obtained under high-stakes conditions, and conventional validation tools are not fully adequate for the task. (Note that throughout, we use “validity” to refer only to the quality of evidence supporting an inference, not to consequential validity.)
1
This technical report presents an effort to develop more systematic approaches to the validation of gains under high-stakes conditions. The first part of the report discusses the inadequacy of traditional approaches to validation for evaluating gains under high-stakes conditions. This is followed by a description of a general framework for conceptualizing and validating gains. A subsequent section draws on the framework to categorize forms of test preparation and their likely effects on the validity of gains. The final section briefly sketches methodological directions for the validation of gains suggested by the framework. A formal mathematical model of the framework is presented in the Appendix. The Inadequacy of Current Approaches Much of the evidence used to validate scores under low-stakes conditions is correlational. For example, we expect reasonably high correlations between scores on the test in question and other tests of the same domain, and we expect the differences in correlations among measures to reflect similarities and differences among the constructs they purport to measure. While cross-sectional correlations and changes in them may be helpful to evaluate gains, neither is sufficient to indicate whether gains are meaningful. Meaningful but non-uniform gains could either augment or attenuate crosssectional correlations. If reasonably uniform over time, inflated gains could leave cross-sectional correlations intact. Nonetheless, some analysts cite crosssectional correlations as evidence of the validity of gains (e.g., Greene, 2001). The possibility of stable correlations in the face of dramatic divergence i n means and probable score inflation can be illustrated by gains on Kentucky’s KIRIS (Kentucky Instructional Results Information System) assessment. During the first years it was administered, scores on KIRIS increased rapidly, but scores on both the National Assessment of Educational Progress (NAEP) and the ACT rose much more slowly or not at all. Among students who took both KIRIS and the ACT mathematics assessments, the mean score on KIRIS rose about .7 SD over three years, while the mean on the ACT dropped trivially (Koretz & Barron, 1998; see Figure 1). During that time, however, the student- and school-level correlations between the tests were reasonably stable, after an initial increase (Table 1). Note that the correlations were low enough that scores o n KIRIS and
2
Standard Deviation
0.7
KIRIS
0.6 0.5 0.4 0.3 0.2 0.1 0 -0.1
ACT 1992
1993
1994
1995
Year Figure 1. Standardized mean change on KIRIS and ACT, mathematics. Source: Koretz & Barron (1998).
the ACT did not have to march upward in lockstep to maintain the correlation; there was ample unpredicted variance to allow for year-to-year fluctuations among schools in gain on KIRIS, as long as there were no major persistent differences in trends over time. Most of the few validation studies of gains under high-stakes conditions have looked at concordance in trends rather than just cross-sectional concordance—specifically, the degree to which gains o n high-stakes tests
Table 1 Correlations Between ACT and KIRIS Mathematics Scores 1992
1993
1994
1995
Student level
0.54
0.71
0.70
0.72
School level
0.69
0.75
0.58
0.74
Note. Adapted from Koretz and Barron (1998).
3
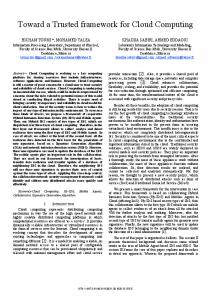
generalize to lower stakes tests such as NAEP (e.g., Klein, Hamilton, McCaffrey, & Stecher, 2000; Koretz & Barron, 1998; Koretz, Linn, Dunbar, & Shepard, 1991; Linn, 2000; and Linn & Dunbar, 1990). These comparisons, however, are subject to an inherent ambiguity, in that it is rarely clear how much generalizability of gains to expect in the absence of score inflation because of differences in the tests’ intended targets of measurement (Koretz, forthcoming; Koretz & Barron, 1998). The disparity is sometimes great enough to warrant an inference that scores have been appreciably inflated (e.g., Klein et al., 2000; Koretz & Barron, 1998; Koretz et al., 1991), but it is not possible to estimate the degree of inflation with any precision. The ambiguity inherent in comparisons of trends on a high-stakes test (called a focal test here) and a lower stakes audit test is illustrated by the V e n n diagram in Figure 2. The rectangle represents all gains on a state focal test. The partially overlapping ellipse represents gains on the audit test, in this case, state NAEP. The gains on the focal test are subdivided into three categories. Gains stemming from score inflation—for example, teaching the specific items on the test—are represented by area A. Meaningful gains on the focal test that do not generalize to the audit test because of differences in intended inferences and resulting differences in test construction are represented by area B. Meaningful gains that do generalize to the audit test are represented by area C. NAEP gains have only two subdivisions—meaningful gains that do and do not generalize to the state’s focal test—because until the present, educators have had little incentive to teach in ways that would inflate gains on NAEP. This situation is gradually changing, of course, and proposals now before Congress could change it dramatically. Two aspects of Figure 2 are particularly important. First, although it has often been claimed that a divergence in trends between a focal test and an audit test will overstate score inflation because of differences in the inferences intended for each, this is not necessarily so. To the extent that the focal and audit tests support different inferences, the divergence in trends may actually understate score inflation. Suppose that area D is large—that is, there is substantial material covered by the audit test but not the focal test, and students are learning more of it over time. Suppose also that, as is usually the case, scores on the state’s focal test are increasing faster than scores on the audit test. If the inferences users base o n the focal test are limited to the content of that test and
4
A. State test gains from inflation
B. Nongeneralizable real gains on state test
C. Generalizable real gains on state test and NAEP
D. D.NonNongeneralizable generalizable real realgains gainson on NAEP NAEP
Figure 2. Schematic representation of gains on NAEP and a state test. Source: Adapted from Koretz (forthcoming).
do not include the content represented by area D, the inclusion of area D in the audit measure will lead to an underestimate of score inflation. Large bias of this sort may be unlikely, but some degree of bias is plausible. Far more important, the relative size of the five regions is unknown, and for that reason, the degree of validity or inflation cannot be well estimated. The delineation of area B from area C and of area C from area D—in each case, the distinction between meaningful gains that are and are not generalizable because of differences in the inferences intended for the two tests—is obscured by the incomplete and often vague specification of the intended inferences. The distinction between areas A and B—between nongeneralizable score gains that do and do not represent meaningful increases in student learning—is obscured both by this incompleteness of specification and, in most cases, by a lack of information on the roots of performance gains (e.g., the extent to which they are dependent on particular formats, rubrics, and so on). The work reported here represents the early stages of an effort to ameliorate this ambiguity through a systematic consideration of the performance elements implicit in both scores and the inferences based on them.
5
The Basic Framework This section describes a model for considering the performance elements that contribute to both inferences and scores and for evaluating the validity of changes in scores over time. This applies to tests that support inferences about student mastery of domains. It does not apply to predictive inferences unless those are directly tied to inferences about mastery. Thus, for example, it does not apply to the validity of predictive inferences about college performance based o n SAT-I scores. A development of the mathematical implications of the framework can be found in the Appendix. The traditional view of test construction focuses on the whittling down of the possible focus of measurement through the specification of the domain, definition of a framework, choice of test specifications, and selection of items or tasks (e.g., Koretz, Bertenthal, & Green, 1999). It focuses on the material included in a test and does not clarify the nature of excluded material or its relevance to particular inferences. This traditional view also focuses on intentional decisions about inclusion or emphasis and does not address inadvertent emphasis. The interpretation of the generalizability of gains, however, hinges on the relevance to inferences of both excluded and unintentionally emphasized material, and it also depends on the degree to which the emphasis assigned to material on the test comports with the emphasis inherent in the inference. Therefore, a more complex view of test development is needed to take these factors into account. Elements of Performance The alternative framework begins with the general term, elements o f performance. This deliberately vague term subsumes all the aspects of performance that underlie both performance on tests and inferences about it. These elements may be either substantive or non-substantive. We use substantive to refer to elements that contribute either explicitly or tacitly to the definition of the domain about which inferences are drawn. In elementary mathematics, examples include knowledge of arithmetic algorithms and the skills needed to apply them to meaningful problems. Non-substantive elements are not the focus of inference and do not differentiate one domain from another. An example would be facility with a particular format that is of no particular importance for the intended inference. The distinction between substantive and non-substantive elements is often hazy but is useful nonetheless.
6
These elements of performance are conceptually distinct, but they are not necessarily empirically independent, either in cross-section or over time. They must be treated as distinct, however, if differences among them are pertinent to inferences about performance and if they have the potential to vary independently over time. For example, algebra and geometry skills will normally be collinear in cross-section, but if a test of high school mathematics proficiency tested only algebra, teachers might respond to the test by increasing their emphasis on algebra while reducing time spent on geometry, and performance in algebra could increase independently of performance in geometry. The process of test construction can be viewed as the selection of a subset from the range of potentially relevant performance elements. This is illustrated in Figure 3. The first stages resemble traditional models of test construction. The set of substantive elements is divided into domains, some tested and others not. Within a tested domain, the set of substantive elements is subdivided into those included in a given test and those not tested. The sets of elements included i n alternative tests of the same domain are likely to overlap considerably; this is not shown in Figure 3 for visual clarity. Elements in a tested subset have varying importance in terms of their influence on scores. That is, total scores will be more sensitive to changes i n performance on some elements than on others. One obvious source of these differences in sensitivity is simply the number of items that tap each element, but numerous other factors can contribute as well, depending on the nature of the items and the manner of test construction. For example, sensitivity can be affected by scoring rubrics, scaling procedures, differences in item discrimination, and relative difficulty. For present purposes, however, only the aggregate impact of those factors is important. We call this aggregate the effective test weight. Discussion of score inflation requires that we give this notion of an effective test weight a formal representation. The term does not imply that test scores need be a weighted linear composite of performance on individual elements. Rather, the model is very general. Let θ i represent performance on any element i. Then test score Y is a function of the vector of θ values: θ ). Y = ƒ(θ
7
Substantive: delineated by domains
Non-substantive: crossed with domains
Aspects of performance
Domain n
Domain 2
Included
Excluded
Tested subset, weights wi
Untested subset, weights wk
In specification
8
A1. Intentional
Elements of Test
Domain 1
A2. Unintentional (over-, underweighted): example of coordinate geometry
In specification
Out of specification
B1. Intentional
B2. Unintentional: example of puzzles involving series
Out of specification
Figure 3. Schematic of elements of performance and elements of a test.
C1. Intentional: example of format decisions
C2. Unintentional
Non-substantive
The effective test weight of a given element is the sensitivity of Y to changes i n performance on that element, that is, the partial derivative of Y with respect to θi :
wi =
∂Y . ∂θ i
This representation is important because some sources of score inflation stem from biased estimates of performance on individual items—that is, biased estimates of one or more θ i —while others result from distortions in the aggregation of these estimates into scores. The next step in the schematic, the division into in-specification and out-ofspecification elements, has no explicit counterpart in the traditional view of test construction, but it can be important for understanding score inflation. We use “specification” to refer to the explicit guidelines that direct the construction of a test. These might include a test framework or content-by-process matrix, content and performance standards (perhaps combined with illustrative examples of content), or a more detailed curriculum framework. Tested content that is within the domain and hence is relevant to important inferences but that is not explicitly noted by the guidelines is classified as out-of-specification. The classification of material as in- or out-of-specification depends only on the guidelines for test development, not on its importance to the domain or the inference in question. The identical element of performance could be inspecification in one test and out-of-specification in a second test that is intended to support similar inferences. Out-of-specification material arises not only because of the omission of substantively important elements from test development guidelines, but also because it is often impossible to specify included elements fully. For example, a set of guidelines that specifies that students should have proficiency with quadratic equations—a very high level of specificity by today’s standards—still does not fully specify how this material will be tested. For example, will the test assess factoring, and if so, will it require students to demonstrate facility with both completing the square and using the binomial formula? Will they be required to use the binomial formula to determine the number of roots without factoring, and will they need to find maxima and minima? These decisions are relatively minor but could appreciably influence the generalizability of gains.
9
The final stage in the schematic differentiates between intentional and unintentional representation of performance elements. Although this cannot be represented clearly in the schematic, representation refers here not only to the inclusion or exclusion of an element, but also to the emphasis given to included elements, that is, their effective test weights. Unintentional weighting can arise because of unforeseen effects of the factors contributing to effective test weights (such as unintended differences in item discrimination). It is likely, however, that a more important source of unintentional inclusion and weighting is incomplete or incorrect anticipation of the skills and knowledge students will bring to bear in answering test items. A clear example of unintentional weighting was provided by the pilot form of a state high school mathematics assessment written several years ago. The state’s standards made several references to geometry, but most simply noted the subject area in general. They included only one brief reference to coordinate geometry, in the context of using geometry as a tool for understanding functions and patterns. The pilot test, however, had a substantial emphasis on coordinate geometry, not because it was a main substantive focus of the developers, but rather because it provides a handy vehicle for assessing numerous aspects of proficiency in algebra. In this manner, performance elements may be unintentionally overweighted—that is, given more emphasis in a test than the intended inferences warrant. Finally, an analogous but simpler selection and weighting occurs with nonsubstantive elements as well. This too can be both intentional and unintentional. Seen this way, the elements of a test are of the six types arrayed at the bottom of Figure 3. Three types of element (in-specification, out-of-specification, and non-substantive) are crossed with intent (intentional versus unintentional). Generalizability of performance or of gains could be threatened by differences among tests in the inclusion or weighting of elements in any of these six categories. The meaning of a failure of generalizability will hinge on the types of elements involved and their relevance to the inferences supported by scores. In theory, interpretation of a high degree of generalizability may also require distinguishing these classes of elements, although this is likely to be less important in practice. For example, as noted earlier, the validity of gains could be
10
overestimated if an audit test includes substantively important elements that are excluded from or given very little weight in a high-stakes test, that are not pertinent to the inferences supported by the high-stakes test, and that show sizable performance gains. Targets of Inference Scores on a test are used as the basis for inferences about a target o f inference—in the case of achievement tests, students’ proficiency on a bundle of skills and knowledge. Validity depends in part on the consistency between the test and the target of inference, but the issue of consistency is complex, particularly when inferences pertain to change. The inferences users base on scores are often simple and vague. For example, newspapers will often write about broad constructs such as proficiency in mathematics with little attention to the elements of performance underlying the inference (e.g., Koretz & Deibert, 1996). This simplification is not merely a convenience. The nature of the target of inference is often both tacit and poorly formed. Many users of scores lack a clear notion of the array of proficiencies implied by scores, and even more sophisticated consumers of scores who agree on a simple interpretation of a score increase may have widely varying opinions about the elements of performance that should be implied by it. For example, disparities in trends between NAEP and high-stakes tests in both Kentucky and Texas sparked debate about the appropriate targets of inference for the focal tests. Even consideration of standards and test guidelines leaves considerable room for uncertainty and disagreement about intended or appropriate inferences. Nonetheless, it is useful to conceptualize targets of inference as paralleling the construction of tests, while acknowledging that the former are both vague and variable. The targets of inference can be seen as comprising elements comparable to the elements of a test shown in Figure 3, although the distinction between intentional and unintentional representation is not pertinent to the description of the target. The target of inference also includes non-substantive elements of performance. For example, users of test scores may have in mind contexts or ways in which examinees should be able to manifest substantive proficiencies, and these may correspond to non-substantive elements of tests. Some performance elements may appear in the target but not the test, or vice versa. Those that are irrelevant to the inference but have substantial test
11
weights go by the traditional term of construct-irrelevant elements. To evaluate the validity of gains, however, we need also to consider elements that are important to an inference but that are not included in the test, which we call implicit elements because they are included in the inference but are not directly measured. The relative importance of performance elements to the target, however, is more complex than is their relative importance to the test. Emphasis in the test can be defined simply as the sensitivity of the total score to changes i n performance on individual elements, which we have labeled the effective test weights of the elements. A change in performance on an element affects scores but is irrelevant to test weights—that is, it is irrelevant to the emphasis accorded to the element by the test. In contrast, the importance of performance elements to a target of inference does depend on expectations about change in performance on them. The user’s model of gains defines the limits of the changes in performance on particular elements that are consistent with a users’ notion of improvement in the overall construct measured by the test. These models, of course, are likely to be partially tacit and poorly formed. Models of change may take many forms, depending on the nature of the inference. For example, in most instances, a total test score can increase even if performance on some important elements decreases. Some inferences about improvement may entail a compensatory model consistent with this, but others may not. Some inferences may require zero or positive changes on all elements; some might require substantial improvements on all elements. The model of gains may also vary with the pattern of performance shown by the individual. For example, the model may be nonlinear, crediting changes at some levels of performance more than changes at others. This might take the form of a ceiling, in which increases in performance on a given element are important up to a certain level of proficiency but of little or no importance above that level. Inference weights refer to the relative importance of these changes to the user’s inference. In some instances, these weights may be vague; in other cases, they may be reasonably clear, if not easily quantified. For example, in evaluating the mathematics achievement of elementary school students, users vary greatly in terms of the relative importance they ascribe to arithmetic computation skills, problem solving, and the ability to communicate mathematics. Similarly, users 12
vary in terms of the relative importance they ascribe to proper spelling and usage in evaluating the writing of students in the primary grades. In both of these cases, the differences in inference weights are often explicit and actively debated but are not clearly quantified. Inference weights, like the user’s model of gains, may depend on the students’ patterns of performance. For example, proponents of phonics and the whole-language approach may differ in terms of the relative importance of decoding and comprehension to the notion of improved reading in the primary grades, but this disagreement is likely to be far less important when evaluating improvements in the reading of proficient high school readers. The validity of an inference about improvement therefore depends on the degree to which gains in total scores warrant the inference that performance o n important elements in the target has changed consistently with the user’s model of gains and inference weights. This consistency is a matter of degree. When an assessment reduces a complex array of performances to one or a few scores, there is likely to be a range of performance changes that offer reasonable support for a given inference. That is, the user’s weighted model of gains will generally accept a range of performance changes that vary in their consistency with the inference. The tolerance for poor consistency—the rate at which decreasing consistency with the model undermines the inference—will hinge in part on inference weights; the lower the weight, the less damage inconsistent change will do to the validity of the inference. However, the model may allow changes in one element to influence the acceptable range of change on another. For example, a user may believe that improvement in overall proficiency ideally ought to mean improvement in performance on each of a set of elements but may tolerate deterioration on one element if improvements on the others is sufficiently large.1 If tests included all important substantive elements, the strength of the inference would depend on the vector of actual changes in performance on the tested elements, the user’s model of gains, and the consistency of test and 1 One can think of the changes in performance on all performance elements germane to the inference
as defining a hyperspace. If fully explicit, the user’s model of gains and inference weights would define one or more hyperplanes that represent optimal support for the inference, but many deviations from these optimal surfaces would provide adequate or even strong support for t h e inference. The loss function that describes how much validity deteriorates with various deviations from these optima will depend on the inference weights and model of gains.
13
inference weights. This would include the degree to which changes in scores result from changes in performance on elements (substantive or not) with little or no relevance to the inference—for example, from practice with specific formats or rubrics. Because of the incompleteness of tests, however, validity also depends o n the degree to which change on implicit elements consistent with the user’s model of gains and inference weights can be assumed on the basis of changes o n measured elements. In traditional validation, one needs to assume or demonstrate only that the cross-sectional relationship between measured and unmeasured elements is consistent with the construct, but that cross-sectional consistency need not imply that changes in performance on implicit elements are consistent either with measured change or with the inference. In the case of complex assessments, it will not be practical to evaluate fully the consistency of measured change with the user’s inference weights and model of gains, but for many important questions of validity, that will not be necessary. For example, the finding that scores on state high-stakes tests sometimes increase far more rapidly than scores on NAEP (e.g., Klein et al., 2000; Koretz & Barron, 1998) has provoked substantial disagreement about the degree to which these disparities threaten the validity of inferences based on increases in scores on the focal tests. One need not reach agreement on the weights assigned to each performance element to address this question. It can be addressed to some degree simply by determining whether elements that are tested by NAEP but have small or zero test weights in the focal test are as a set unimportant to the inferences about improvement users are basing on the focal test. Correlational Versus Means-Based Validation Evidence In the traditional context, validity hinges on the degree to which the performances elicited by the subset of relevant elements included in the test provide a basis for inferring performance on the larger set of elements relevant to the domain, many of which will be poorly measured or implicit (i.e., entirely excluded from the test). Thus validity is a matter of sampling—not the sampling of content, but the sampling of performance elements elicited by the content. Sampling of performance elements must be representative, not in the sense of being selected from the larger set with known probability, but in the sense that the aggregate of performance across the sampled set must be an informative
14
representation of the broader range of performance implied by the inference. One aspect of this sampling is the consistency of test weights with inference weights. A second aspect is the ability of the sampled elements to support inferences about the implicit elements that are not sampled—for example, the ability of performance on 40 words in a vocabulary test to represent proficiency with the many thousands of words not sampled. The possibility of a change over time i n the relationship between scores and the relevant performance elements is rarely considered except in special contexts, such as the linking of alternative forms. All of the evidence traditionally used to test validity in this context is crosssectional, and most is correlational, including simple correlations among like tests, convergent/discriminant evidence, generalizability analysis, and tests of dimensionality. Various types of content-related evidence add support to decisions about adequacy of sampling from the larger set of elements relevant to the inference. This evidence plays an important role in validating gains as well, even though it is not sufficient for this purpose. One would not want to gauge improvement with an instrument that cannot be shown to be adequate at the start. Changes in cross-sectional relationships over time may also provide important clues about the validity of gains, although as noted above, the interpretation of such changes is not always obvious. Taken together, these methods focus on the similarities of rankings across measures but do not address similarities in means. (Generalizability analysis does, of course, evaluate mean differences, but typically it has been applied to the analysis of mean differences across conditions within tests, not to variations i n means across alternative measures of the same construct.) This focus on the consistency of rankings was generally not problematic in traditional validation work carried out under low-stakes conditions. For example, a correlation between scores on two tests administered to the same sample might be used as evidence of the validity of one of them. Under low-stakes conditions, a difference in means in this case would have no inherent meaning and would not be relevant to validity, provided the difficulty level of both tests was appropriate. In examining the validity of gains, on the other hand, mean differences—or, more generally, changes in location on the scale—become central. A core question is whether a change in scores provides a biased view of change on the bundle of elements given high inference weights by the user. 15
Under high-stakes conditions, one cannot assume that relationships among performance elements, both sampled and implicit, are stable over time. Therefore, one cannot assume that change on sampled items provides an unbiased estimate of change on implicit items or that a change in scores provides an unbiased estimate of change on the valued elements. Under low-stakes conditions, behavioral responses to testing are relevant to validity only if they involve unambiguously inappropriate test preparation or test administration, such as teaching secure items. In contrast, under high-stakes conditions, a wide range of behavioral responses to testing—including responses that are not clearly inappropriate by traditional standards—can alter the relationships between performance elements, both sampled and implicit, and thus threaten the validity of inferences based on changes in scores. The importance of behavioral response is clarified by distinguishing various types of test preparation, as described in the following section. Cross-sectional consistencies in ranking do not necessarily indicate a lack of bias in means. Therefore, to validate gains in scores, it is necessary to turn to methods that allow meaningful comparisons of means or of other changes i n location. This can be done using cross-sectional data if a method is found for placing the results of two tests on a common scale that is unaffected by score inflation. For example, Koretz et al. (1991) used scales based on national standardization samples to permit comparisons of results on two different tests. A more general solution is to compare trends in scores across measures, which can be done without linking of scales, for example, by normalizing the distributions of scores on both measures. Types of Test Preparation We use the term test preparation to refer to all steps educators take, both desirable and undesirable, to prepare students for tests. This contrasts with a more common usage in which test preparation has a negative connotation, denoting methods that inflate scores or are undesirable for other reasons. W e distinguish among seven types of test preparation: • teaching more; • working harder; • working more effectively;
16
• reallocation; • alignment; • coaching; and • cheating. The first three of these types of test preparation can produce unambiguously meaningful gains in scores. That is, they can produce higher levels of performance on substantive elements of the test (either in- or out-ofspecification) that warrant the inference that students have improved their mastery of the intended domain. One is teaching more—for example, providing more instructional time by adding days to the school year, instituting remedial classes outside of normal school hours, or devoting more of the school year to actual instruction. Assuming that these changes are focused on tested knowledge and skills, are not accompanied by a deterioration of gains per unit time, and are not achieved by decreasing time allotted to other important outcomes, they will produce meaningful gains in student learning. Another method is simply working harder—for example, covering more material per hour of instructional time. The success of this method is not guaranteed—it depends, for example, o n teachers not abbreviating needed explanations or exceeding the ability of students to keep pace—but it can produce meaningful gains. A third approach could be called working more effectively—for example, adopting a better curriculum or more effective teaching methods.2 The other four types of test preparation, however, can produce inflated scores—that is, increases in scores that do not warrant the inference that students’ mastery of the target of inference has improved by a commensurate amount. All but cheating can also produce meaningful gains in scores, depending on how they are conducted. The boundaries among the four are not always distinct, but it is nonetheless useful to categorize them in this fashion.
2 We use the term “effectively” and avoid the term “efficiently” because of the meaning of
“efficiency” in economics. For example, a teacher “working harder,” using methods of constant effectiveness, would produce a gain in efficiency from an economic viewpoint—that is, an increase in output per unit input, where in this case the primary input is simply instructional time. W e believe it is useful to distinguish more effective methods from working harder and therefore avoid this more general concept of increased efficiency.
17
Reallocation We use the term reallocation to refer to shifts in resources among substantive elements of performance. For example, numerous studies have found that teachers report shifting instructional time to focus more on the material emphasized by an important test, both within and across domains (e.g., Darling-Hammond & Wise, 1985; Koretz, Barron, Mitchell, & Stecher, 1996; Koretz, Mitchell, Barron, & Stecher, 1996; Salmon-Cox, 1982, 1984; Shepard, 1988; Shepard & Dougherty, 1991). The resources relevant to reallocation are not limited to instructional time; they include all of the resources that parents and students as well as teachers must allocate among performance elements. Assuming that resources are effective when applied to both emphasized and deemphasized elements, a shift of resources will result in a reallocation of achievement as well. Reallocation alters the meaning of a change in total scores by changing the relationships among performance elements. Reallocation within domains can have various effects on test scores and o n the validity of gains, depending on the test and inference weights of the elements given both increased and decreased emphasis. For example, if the elements receiving increased emphasis have both higher effective test weights and higher inference weights than the elements receiving lowered emphasis, both scores and achievement will increase. This case is discussed further under alignment. Reallocation can also inflate scores, however, if it decreases emphasis o n elements with substantial inference weights but relatively low or zero test weights. This case is what is often called “narrowing of instruction.” In some cases, the impact of reallocation is clear. For example, if teachers begin focusing disproportionately on elements with large test weights while substantially deemphasizing important elements excluded from the test, then the ability of performance on included elements to represent the broader set relevant to the inference is undermined. In other cases, the effects of reallocation may be more subtle. For example, a teacher may shift emphasis among tested performance elements to take advantage of inadvertent overweighting of some elements, creating a misleadingly large increase in scores. It is important to note that reallocation can inflate scores even if the emphasized material is important to the inference and even if the deemphasized material is not in-specification. All that is needed for inflation to occur is a behavioral response that increases the
18
alignment of performance with test weights more than that with inference weights. In terms of the model above, reallocation can inflate scores by distorting the aggregation of estimates for individual elements into scores. The composite score may have the wrong weights to represent accurately change in performance i n the domain as a whole (as delineated by the user’s model of gains and inference weights). This distortion may involve misaligned weights for tested elements, but perhaps more important, it may also undermine the ability of performance on measured elements to represent performance on implicit elements. Reallocation can also occur among domains; for example, a school may shift time from science into mathematics in response to a testing program that assesses the latter but not the former. Whether the gains caused by reallocation among domains is inflation depends on the inferences the tests are used to support. In this example, if results on the test were used strictly to support the inference that students were learning more mathematics, the between-subjects reallocation would not make the increase in scores misleading. If, on the other hand, users inferred from the increase in scores that the increase in mathematics scores represented a net increase in learning because there was no compensating decrease in performance in other important areas, the increase in scores would be misleading. Alignment “Alignment” between tests and the standards they are intended to reflect is a buzzword of contemporary education debate and is almost always presented as desirable. Some observers specifically argue that alignment provides protection against score inflation because it presumably focuses instruction on elements deemed valuable by those who drafted the standards. In the terminology used here, standards identify elements of performance that warrant high inference weights in the eyes of those drafting them, and alignment gives these elements high test weights as well. The concordance of inference and test weights should imply, according to this argument, that increases in scores are meaningful, not inflated. Of course, the degree to which other users share the values that motivated a particular set of standards—or even know what they are—is uncertain. Therefore, even if a test is well aligned with a state’s standards, it may be poorly
19
aligned with the inferences many important users base on scores. For present purposes, however, we will leave this issue aside. Even when users understand and accept a state’s standards, the argument that alignment protects against score inflation is simplistic. Increased alignment is a form of reallocation, and its impact on the validity of gains depends on the same considerations that arise in other types of reallocation. The extent to which alignment may inflate gains depends not only on which elements receive greater emphasis, but also on which elements receive less. One reason why alignment is not necessarily sufficient to protect against inflation is the incompleteness of test development guidelines and of tests themselves. Because of that incompleteness, important elements—elements with appreciable inference weights—may be given small or zero test weights. This leaves teachers free to deemphasize or ignore elements with substantial inference weights even while working to raise scores by focusing on material emphasized by the standards. In addition, alignment cannot fully protect against the assignment of substantial test weights to elements with small or zero inference weights—for example, when a test focuses on certain non-substantive elements—or against opportunistic responses to overweighting. Coaching The term “coaching” has been used to refer to many types of test preparation. Here we restrict its use to two types of preparation, one focusing o n substantive elements, the other on non-substantive elements. Substantive coaching refers to an instructional emphasis on narrow aspects of substantive performance elements to comport with the style or emphasis of test items. In some instances, the object of this focus is not an intentional emphasis of test developers. For example, a teacher may notice that a test’s items about the area of polygons focuses entirely on certain classes of polygons—say, only regular polygons, or only polygons with 5 sides or fewer—and may focus instruction unduly on those classes of figures at the expense of other types of polygons. As a result, students might exhibit facility in calculating areas that does not generalize well to other types of polygons. The distinction between substantive coaching and reallocation may sometimes appear hazy in practice, but they are fundamentally different in terms of the framework presented here. Reallocation moves resources and 20
achievement among substantively important performance elements, thus changing the meaning of composite scores. When it inflates gains, it does so by undermining the ability of change in the composite scores to represent change i n achievement consistent with the user’s model of gains. In contrast, coaching, whether substantive or non-substantive, distorts the estimates of performance on the elements themselves; that is, it biases estimates of one or more θ i . The distinction between substantive coaching and cheating (discussed further below) can also be hazy. Consider the following example of test preparation provided by district officials in Montgomery County, Maryland: The question on the review sheet for Montgomery County’s algebra exam reads in part: “The average amount that each band member must raise is a function of the number of band members, b, with the rule f(b)=12000/b.” The question on the actual test reads in part: “The average amount each cheerleader must pay is a function of the number of cheerleaders, n, with the rule f(n)=420/n.” (Strauss, 2001, p. A09)
The author then posed the question “Is this good test preparation or—as some parents claim—institutional cheating?” and noted that it was defended as appropriate by some district officials (Strauss, 2001, p. A09). One might argue about whether this test preparation should be classified as cheating, but if not, it would be an example of substantive coaching. Non-substantive coaching refers to forms of test preparation that focus instruction on elements of the test that are largely or entirely unrelated to the definition of the domain the test is intended to represent—that is, elements that are largely or entirely non-substantive. Limited coaching can be appropriate and can increase the validity of scores by removing construct-irrelevant impediments to performance. For example, if a format is sufficiently novel for students, it may cause them to perform more poorly than their mastery of substantive elements of the test would warrant. Some amount of coaching to increase familiarity would lessen this barrier and improve validity of scores. However, even when it improves the cross-sectional validity of scores, coaching may inflate gains. If scores from the first administration of a test are depressed by novelty, and if coaching appropriately eliminates that bias in scores on the second administration, scores will increase even if true mastery of the domain remains unchanged (e.g., Koretz & Barron, 1998). 21
Once familiarity with format and other non-substantive elements is n o longer a barrier to performance, additional coaching is usually inappropriate, either inflating scores or simply wasting instructional time. When nonsubstantive coaching inflates scores, it does so in the same manner as substantive coaching, that is, by biasing estimates of individual θ values. Cheating The most extreme form of test preparation is cheating. The distinction between cheating and other forms of test preparation can also be vague. In particular, the dividing line between cheating and coaching is hazy, because both distort total scores by biasing estimates of performance on individual elements, not by altering the aggregation of those estimates into total scores. The types of cheating are diverse and include, for example, providing answers, correcting students’ responses, alerting students to incorrectly answered items so that they can review them, providing access during testing to inappropriate material, violating test administration procedures, and allowing students to practice secure test items in advance. In some instances, cheating is distinguished from coaching in that cheating appears designed specifically to bias scores. Intent, however, cannot always distinguish cheating from coaching, as a teacher may use a form of test preparation that is clearly cheating in the eyes of experts and that undermines the validity of both scores and gains while believing the method to be appropriate. Cheating, however, unlike coaching, cannot increase the validity of scores. Methods for Evaluating the Validity of Gains In this section we briefly discuss several methods that may be used to evaluate the validity of interpretations of test score gains. Some of these methods have been widely used in validation studies, whereas others will require development and testing before they can be used in practice. We neither provide details for applying any of these methods nor attempt to present an exhaustive list. Instead, this section is intended to illustrate directions for validation implied by the framework described above. Clarifying Inference Weights The first category of methods addresses the need to understand the inference weights that users apply. Although validity is a characteristic of an
22
inference rather than a test, in many validation efforts the inference is largely unquestioned and the focus is on the test and on patterns of performance rather than on the inference itself. However, this is unwarranted when inferences pertain to gains obtained under high-stakes conditions. In such cases, validity depends in part on the alignment of inference and test weights, and validity therefore cannot be adequately evaluated without clarifying the inferences users base on scores. As explained earlier, one faces several difficulties in ascertaining inference weights. These difficulties include the incomplete specification of test frameworks, the diversity of inference weights among users, and the tacit and incompletely formed nature of most users’ inference weights and models of change. However, it is possible to address these problems and to collect information that would provide useful summaries of typical weights applied by various user groups, such as teachers, newspaper reporters, policymakers, or parents. We do not intend to imply that there is a single set of inference weights that can somehow be identified. Rather, each approach is likely to yield a slightly different set of performance elements and relative weightings among them. Nonetheless, it should be feasible to discern broad patterns of inference weights. Validation must reflect these patterns, even if that requires several judgments of validity, each pertaining to different sets of weights. For example, one might find that most people in a given group of users agree that “improvement in high school mathematics” should entail improvement i n basic algebra but that users are clearly divided in terms of whether proficiency i n data analysis and statistics is important. If the audit measure used for high school mathematics has substantial test weights for data analysis and statistics (as does NAEP), this might require evaluating whether data analysis and statistics contributed substantially to a divergence between the audit and focal measures and whether estimates of validity would differ with and without the inclusion of that topical area. We draw a distinction between the inference weights of test developers and sponsors and those of other users. We include under the rubric of “sponsors” the policymakers and agencies that design and implement testing programs. Developers and sponsors have initial intended inference weights, which are the weights corresponding to the inferences they intend test scores to support. W e contrast these with the actual inference weights applied by other users, such as 23
parents, the press, and (in most settings) teachers, who generally play little or n o role in determining the intended inferences from external tests. Policymakers must be counted as users as well as sponsors, in that they may have actual weights that differ markedly from those initially intended. This may be true even of those involved in the design, for their inference weights may shift over time. The first inference weights we consider are the intended weights of test sponsors. Most published tests are accompanied by tables or lists of specifications that indicate what concepts and skills should ideally be measured by the test. For statewide testing, the state’s content standards often provide information about the intended weights. However, many state test assessment directors acknowledge that their state tests are not well aligned to the standards, and that therefore the effective test weights will be somewhat different from the intended inference weights implied in the published standards. In such cases, states may create mappings that indicate which test items are associated with which standards. These mappings provide an indicator of the intended targets of inference and the relative weights among them. Statements of intent may also be found in state laws that pertain to the state’s testing program or in statements that are made by the test’s sponsors (e.g., press releases that discuss changes in test scores and what they mean). All of these sources provide information about the intentions of the legislature or test developers and represent what users such as parents are being told they should infer from test results (as distinct from what they actually infer). Information about the actual inference weights applied by stakeholder groups such as parents, teachers, and the media must be gathered directly from members of these groups. Despite the increasing emphasis on high-stakes testing and on the use of test scores as indicators of school effectiveness, we know very little about the meanings users attribute to scores. A few studies have examined the inferences of writers in the lay media (e.g., Koretz & Deibert, 1996), but we are aware of no systematic empirical studies of the inference weights of some other key groups, such as parents. Without this information, however, it is not possible to evaluate adequately the validity of gains. There is likely to be wide variation in the inference weights applied both among and within these groups. Consider parents, for example. Inferences about the meanings of the mathematics test scores their children receive are 24
undoubtedly shaped by a number of factors, including the kinds of curriculum materials they’ve seen in the classroom, the nature of the homework students bring home, and parents’ own experiences with math. They are probably also shaped by the nature of the score reporting—e.g., if several subscores are reported, the parent may be more likely to consider math as multidimensional than if only a single, global score is reported. Surveys and interviews with representative samples of parents, and perhaps other community members, might be an effective way to discern their inference weights and to gauge the extent to which these map onto the performance changes that contribute to score gains. To be effective, however, such surveys or interviews with parents would need to be highly structured and could not rely solely on open-ended questions about inference weights. The structure would be needed to address the tacit and incomplete nature of inference weights and models of change. For example, to understand what parents think a test is measuring, it might be fruitful to give them several constructs from which to choose, and to collect this information both before they have seen the test (which in many states would provide an accurate indicator of what parents think given the information they typically have) and after showing them specific items from focal and audit measures. Showing them illustrative items would remind them of content of which they might not have been aware and would compel them to assign weights to content that has appreciable test weights. Another approach would be to show parents frameworks from different tests and ask them to rate the importance of each element in the frameworks. For example, to help evaluate the discrepancy in trends between NAEP and TAAS noted by Klein et al. (2000), one could ask parents to rate the importance of core elements of the NAEP frameworks for their inferences about the meaning of improved performance on TAAS. An additional source of information about users’ inference weights is the news media. Test results are frequently reported in national as well as local newspapers and are widely discussed in other media outlets as well. A systematic review of how results are presented would yield important information about the inference weights that are conveyed to the public through the media. Koretz and Deibert (1996) conducted a study examining the reporting of NAEP results. They found that the reports of performance on NAEP were typically very simple and generally included little detail at the level of the performance elements, but
25
they did not attempt to determine whether any reports provided enough information to be useful for validating gains. Examining descriptions of test results reported in the press, as well as the ways in which the press represents claims made by policymakers and educators, may be a useful step in trying to understand whether the meaning of test score gains as reported to the public is consistent with existing validity evidence. Teachers represent a particularly important stakeholder group. Although understanding teachers’ inference weights is essential for understanding a range of other issues, such as how high-stakes tests influence instruction, it is difficult to make a clear distinction between inference weights and test weights in the case of teachers, as we discuss below. Therefore we address teachers in the following section, which discusses approaches for clarifying test weights. Research should also examine the inference weights applied by other education personnel, particularly principals and superintendents, who influence how test scores are used. Clarifying Test Weights Efforts to clarify effective tests weights are also crucial to evaluating the validity of gains on any test but will face a different set of difficulties. One hurdle is the need to determine an appropriate level of detail, one that is specific enough to capture important differences in change over time but that is general enough to provide a meaningful and useful basis for comparison. For the purposes of most validity investigations, it will be necessary to specify the test weights at least at the same level of detail as the inference weights, but it may be necessary to specify them in considerably greater detail. A second difficulty is that information about weights can be obtained from numerous sources, but they are likely to yield incomplete and differing information. Therefore, it may be necessary to decide on methods for combining sometimes discrepant information from multiple sources. Examination of the test content itself and classification of items into categories (see, e.g., Bond & Jaeger, 1993) provide a method for understanding how various constructs are weighted on a test and for evaluating whether these weights are consistent with the weights that are communicated to test users through standards documents or other published materials. One challenge i n this kind of work is that content standards and inference weights are often not
26
sufficiently well defined to enable clear classification. Even when they are, however, the classification of items is typically not straightforward. Most items are inherently ambiguous and difficult to classify under a single category, and simple inspections of item content are generally insufficient for understanding the specific skills and sources of knowledge upon which examinees draw. Approaches that elicit information about how examinees respond to items may be especially powerful for clarifying the actual test weights assigned to performance elements. Messick (1989) includes these approaches in his discussion of methods for gathering validity evidence. For example, gathering evidence of the cognitive processes in which examinees engage while responding to test items may help to illuminate the constructs that are measured (see, e.g., Hamilton, Nussbaum, & Snow, 1997). In some cases these methods may identify performance elements that differ from what is presented in the formal test specifications. Particularly under high-stakes conditions, teachers may be a valuable source of information about effective test weights. As a group, teachers clearly pay attention to what is on tests, and many use this information to help shape their instruction. Especially under high-stakes conditions, teachers often adapt their curricula to increase the amount of time spent on material covered by the test, and these strategies often result in improved scores. Stecher, Barron, Chun, and Ross (2000) found that teachers in a high-stakes testing context generally paid more attention to what is on the test than to the state’s published standards. Although teachers’ perceptions of what is measured may be considered another set of inference weights, their efforts to use information from tests to shape their instruction may be more accurately thought of as behavioral responses to test weights (albeit their perception of the test weights rather than the weights as determined by researchers or test developers). In fact, teachers probably devote more effort than members of any other group to identifying test weights, including unintended weights, and therefore represent a valuable source of information on test weights, if information about their judgments is collected systematically. Information about teachers’ perceptions of test weights could be obtained by various methods, including structured surveys somewhat like those suggested above for parents. One approach to ascertaining effective test weights involves inspecting test items and deciding what the items, individually and together, appear to 27
measure. We call this “backward mapping” because rather than starting with standards (or other test guidelines) and determining which if any of the standards an item measures, one starts with items and infers standards. This might be done by teachers currently preparing students for the focal test, by other teachers in the same substantive area, or by other individuals with pertinent substantive expertise. Many items could plausibly measure a variety of different things, and a single item might be mapped to multiple standards depending on a number of factors, such as the degree to which teachers attend to surface features of the item. Backward mapping could be useful in several ways. A comparison of standards to the results of backward mapping would indicate the degree to which teachers are attuned to the standards in ways that were intended by the developers and proponents of those standards. Perhaps more important, backward mapping might reveal ways in which changes in test scores are influenced by performance elements that were not specified by the test’s sponsors, including non-substantive elements, or by unintentional overweighting. (The example of unintentional overweighting of coordinate geometry noted in an earlier was identified by an informal effort at backward mapping.) This in turn could help refine investigations of teachers’ responses to the focal test. The results of backward mapping could also be useful for establishing clusters of items, as discussed below. Finally, backward mapping could be used to address other important questions that are not central to the validation of gains per se, such as evaluating the validity of the commonly held assumption that standards-based accountability systems provide clear goals and lead to desirable changes in instruction. Examining Item Clusters Longitudinally As we discussed earlier, most existing evidence about the validity of gain scores in high-stakes testing situations relies on total scores from one or more tests, but more detailed information about performance elements is often needed to estimate the validity of gains adequately. When item-level data are available, the question is how to define clusters of items that correspond to important performance elements. Below we discuss two general methods for forming item clusters.
28
First, inference weights may be used as a basis for clustering items. That is, items may be clustered to match the performance elements that are particularly important for key inferences on a test; a subscore could then be calculated separately for each cluster, and changes over time in the scores for these clusters could be estimated and compared. This approach to examining test score gains would facilitate an understanding of changes in the performance elements that were identified through methods such as those described in the previous sections. Differential gains across clusters defined in this manner could result from a number of factors, including uneven attention by teachers or students to the elements, differences in the difficulty of the items across elements (including possible ceiling effects), and differential sensitivity to instruction. Variations i n gains across clusters would clarify the meaning of increases in total scores, and the concordance of the relative gains with inference weights and models of change would provide evidence of the validity of inferences about overall gains. Second, clustering may be done empirically based on differences in the amount of change over time. For example, items could be classified into several bins—large positive change, small positive change, no change, and negative change. Next, we might examine the mix of performance elements in each of these bins to determine whether growth on some elements is particularly strong or weak. This information about differential change across performance elements could then be compared with the nature of inferences about change to evaluate the consistency of inferences with actual change. In addition, inspecting the content of items in a given bin, especially when they cover multiple performance elements, might reveal attributes of items that were previously unknown to users and that influence change. These may be non-substantive elements, such as similarities in item format. Information from this type of analysis could help researchers to structure subsequent investigations of changes in instructional practices. Examining Dimensionality Another approach to analyzing item-level data involves investigating the dimensionality of the test. To some degree, such analyses may be considered extensions of the clustering approach described above. We do not discuss or compare specific statistical approaches to exploring dimensionality, though choice of method is obviously a critical consideration.
29
Before discussing the specific questions that can be addressed through a dimensionality analysis, it is important to note that many conventional approaches applied to tests of a single academic subject generally indicate a unidimensional structure. As noted by Muthén, Khoo, and Goff (1997), however, in most cases there are nonetheless potentially useful distinctions that can be made from an analysis that is designed to detect deviations from unidimensionality. Moreover, as noted earlier, even the finding that a test is unidimensional in cross-section does not mean that dimensional differences are unimportant for validating gains. Performance on elements that are dimensionally indistinct (i.e., very highly correlated) in cross-section may nonetheless change independently over time. The latent variable modeling approach that Muthén and his colleagues use is a promising method for exploring the questions we discuss below, though certainly not the only approach. We discuss three questions that may be addressed through an analysis of a test’s dimensionality. First, does the dimensionality remain constant over time, particularly as the stakes attached to the test increase? Exploratory analyses of dimensionality at multiple time points may reveal changes in the structure of the test, and these changes may be tied directly to test preparation efforts. Such changes would occur if, for example, the variability of performance on one dimension was reduced through test preparation efforts; in this case, a dimension that was observed at the first administration may not be observed at a later administration. Both substantive and non-substantive elements may contribute to dimensionality, so test preparation efforts targeted at either type may affect changes in the structure over time. Second, in cases of constant dimensional structure over time, does the magnitude of score gains differ across dimensions? Several studies have revealed that group differences sometimes vary across the dimensions of a test (e.g., Hamilton, 1998; Muthén et al., 1997), and similar approaches may be used to explore differential growth. These approaches are similar to those discussed i n the section on clustering. Instead of using a pre-existing set of performance elements and classifying items according to them, a dimensionality analysis would be conducted to reveal a plausible set of performance elements, and items are would be classified based on their correlations with the dimensions that are identified. This approach may be desirable when there is a lack of information
30
about the test’s performance elements, or it may be combined with other approaches designed to identify a set of performance elements. Finally, how do the results of an empirical analysis of dimensionality correspond with the targets of inference expressed by a test’s sponsors and users? This question follows naturally from the previous one. If gains vary across dimensions due to behavioral responses that target some dimensions more than others, the validity of inferences about gains will depend on both the degree to which the elements in the target of inference are similar to those represented by the dimensions, and the degree to which differential gains across elements are similar to users’ inferences about the meaning of a score gain. Data collected using approaches like those described in the section on clarifying inference weights provide an initial comparison, but it might be desirable to collect additional information from users or sponsors once the dimensionality has been ascertained through empirical analysis. For example, users could be given the list of dimensions and some descriptive information about each, and asked to attach weights that represent the importance they place on each dimension. It is likely that the dimensions identified empirically will differ substantially from the elements to which users are attuned, so this more structured approach may be necessary for eliciting inference weights that correspond to the dimensions. Examining Correlational Structure Clues to the validity of gains may also be obtained from investigation of the correlational structure of test scores and student background characteristics. Such analyses may be particularly useful for understanding behavioral responses to testing. As we discussed earlier, score inflation will not necessarily result i n changes in correlations with scores on other measures. Changes in correlational structure may occur in some cases, however, especially if the extent and type of test preparation activities vary by school or student characteristics (e.g., if teachers at high-poverty schools tend to engage in more test preparation than teachers at low-poverty schools). It is important to keep in mind that correlations alone are not sufficient evidence of inappropriate test preparation activities; for example, a decrease in the correlation between test scores and student poverty could reflect either greater score inflation in poor schools or a real effect on the equity of outcomes. Investigations of correlations between test scores and student background are probably most useful when scores on an audit test are available. In such cases it may be possible to evaluate the degree to which changes i n 31
correlations between scores on a high-stakes test and student background are reflected in correlations shown by the lower stakes test. Most test preparation activities will exert effects at either the school or classroom level and may therefore produce discrepancies in correlational structure across levels of aggregation. These discrepancies may be observable in a single year of data. For example, Klein et al. (2000) compared student- and schoollevel correlations in one Texas district between both among tests and between test scores and background variables. They found that correlations with scores o n tests not used for high stakes were typically higher at the school level than at the student level, as one would expect from aggregation. Some correlations with TAAS scores, however, were very small or near zero at the school level, suggesting interventions that affected entire schools. Effects on correlations might also be found by comparing relationships across years. Again, correlational patterns alone are insufficient for understanding the extent and nature of test preparation activities. They can, however, serve as one source of evidence in a validity investigation and may help to identify potential threats to validity that should be examined in greater detail through classroom observations, interviews with teachers, or other methods designed to provide information about behavioral responses to testing. Conclusions The framework proposed here is presented only in general terms, and efforts to apply it may suggest modifications or additional specificity. Even in its most general form, however, the framework offers a basis for understanding forms of test preparation, suggests new directions for validation efforts under high-stakes conditions, and has implications for policy. The framework clarifies that score inflation requires neither unambiguously inappropriate test preparation nor the allocation of instructional resources to substantively unimportant aspects of a test, such as item formats or substantive performance elements with small inference weights. Certainly, either of these can inflate scores, but inflation can arise without them. Emphasizing elements with high inference weights is certainly desirable in its own right, and all other things equal, it will typically inflate scores less than would comparable emphasis on unimportant or non-substantive elements. Even focusing on valued performance elements, however, can inflate 32
scores—for example, if those elements are unintentionally overweighted, or if emphasis on them comes at the expense of other elements also important to the inference but accorded little or no emphasis on the test. If resources are reallocated to be more consistent with test weights without maintaining or increasing concordance with inference weights, the representativeness of tested material will be undermined, and scores will be inflated. A corollary is that although many tests may be improved in various ways to lessen the problem of score inflation, such improvements are not necessarily sufficient. Put in popular parlance, neither “tests worth teaching to” nor “tests aligned with standards” are sufficient protection against score inflation. The validity of gains hinges on the extent to which changes in total scores imply acceptable changes in performance on all elements that should increase, according to the user’s model of gains, and that have large inference weights. This in turn implies that in most circumstances, the validity of gains cannot be established without examination of changes on external measures because of the large number of important elements that are excluded from any test. These external measures could be audit tests, or they could be provided by a test design in which unanticipated particulars are cycled into the focal test. It is likely that these unanticipated particulars would need to be both substantive and nonsubstantive. However, deciding what elements are sufficiently novel to be unanticipated but sufficiently similar to be relevant to the intended inferences will often be difficult. Simple comparisons with audit measures, while useful to identify egregious inflation, will typically be insufficient to estimate the degree of validity of gains (or, conversely, the degree of inflation) unless there is clear agreement about the appropriateness of the test weights of both the focal and audit tests for key inferences. Without that, we are left with ambiguity about how much generalizability is enough. To better estimate validity or score inflation without such agreement, it will be necessary to identify important groups of performance elements and examine shifts in performance at the level of those groups to examine their consistency with important inferences. However, we currently lack good methods for identifying the key groups of elements. What criteria should be applied to decide which need to be considered as distinct groups? A priori criteria, such as test specifications or statements of
33
standards, are important but insufficient (e.g., because of unintentional overweighting and our lack of certainty about the skills and knowledge actually elicited by many test items). One focus of our ongoing work will be to evaluate various approaches to delineating the groupings of performance items most important for this specific purpose. Finally, several of the problems inherent in validating gains, such as uncertainty about the expected level of generalizability to audit measures and the lack of clarity about key groups of performance elements, stem from the vagueness of intended and actual inferences. To some degree, this is a matter of policy rather than research. Without becoming overly prescriptive, the standards in some states could be made more specific about the elements that students are expected to learn, and some states and localities could be clearer about the inferences that are intended for specific tests. In many instances, however, clearer statements of policy may not suffice. It may be necessary to investigate inferences systematically in order to elicit tacit inference weights, and it may be necessary to use contrasts among measures to clarify the bounds of acceptable inferences. This too will be a focus of our ongoing work.
34
References Bond, L., & Jaeger, R. M. (1993). Judged congruence between various state assessment tests in mathematics and the 1990 National Assessment o f Educational Progress item pool for grade 8 mathematics (Report prepared for the National Academy of Education Panel on the NAEP Trial State Assessment). Stanford, CA: National Academy of Education. Darling-Hammond, L., & Wise. A. E. (1985). Beyond standardization: State standards and school improvement. The Elementary School Journal, 85, 315-336. Greene, J. P. (2001, February). An evaluation of the Florida A-Plus Accountability and School Choice Program. New York: The Manhattan Institute. Hamilton, L. S. (1998). Gender differences on high school science achievement tests: Do format and content matter? Educational Evaluation and Policy Analysis, 20, 179-195. Hamilton, L. S., Nussbaum, E. M., & Snow, R. E. (1997). Interview procedures for validating science assessments. Applied Measurement in Education, 10, 181200. Klein, S. P., Hamilton, L. S., McCaffrey, D. F., & Stecher, B. M. (2000). What do test scores in Texas tell us? (RAND IP-202). Santa Monica, CA: RAND. Koretz, D. (forthcoming). Limitations in the use of achievement tests as measures of educators’ productivity. Journal of Human Resources. Koretz, D., & Barron, S. I. (1998). The validity of gains on the Kentucky Instructional Results Information System (KIRIS) (MR-1014-EDU). Santa Monica, CA: RAND. Koretz, D., Barron, S., Mitchell, K., & Stecher, B. (1996). The perceived effects o f the Kentucky Instructional Results Information System (KIRIS) (MR-792PCT/FF). Santa Monica, CA: RAND. Koretz, D. M., Bertenthal, M. W., & Green, B. (Eds.). (1999). Embedding c o m m o n test items in state and district assessments (National Research Council, Committee on Embedding Common Test Items in State and District Assessments). Washington, DC: National Academy Press. Koretz, D., & Deibert, E. (1996). Setting standards and interpreting achievement: A cautionary tale from the National Assessment of Educational Progress. Educational Assessment, 3, 53-81. Koretz, D., Linn, R. L., Dunbar, S. B., & Shepard, L. A. (1991, April). The effects of high-stakes testing: Preliminary evidence about generalization across tests. In R. L. Linn (Chair), The effects of high-stakes testing. Symposium
35
presented at the annual meetings of the American Educational Research Association and the National Council on Measurement in Education, Chicago. Koretz, D., Mitchell, K., Barron, S., & Keith, S. (1996). The perceived effects of t h e Maryland School Performance Assessment Program (CSE Tech. Rep. No. 409). Los Angeles: University of California, National Center for Research o n Evaluation, Standards, and Student Testing. Linn, R. L. (2000). Assessments and accountability. Educational Researcher, 29(2), 4-16. Linn, R. L., & Dunbar, S. B. (1990). The nation’s report card goes home: Good news and bad about trends in achievement. Phi Delta Kappan, 72, 127-133. Messick, S. (1989). Validity. In R. L. Linn (Ed.), Educational measurement (3rd ed., pp. 13-103). New York: Macmillan. Muthén, B., Khoo, S., & Goff, G. (1997). Multidimensional description o f subgroup differences in mathematics achievement data from the 1992 National Assessment of Educational Progress (CSE Tech. Rep. No. 432). Los Angeles: University of California, National Center for Research o n Evaluation, Standards, and Student Testing. Salmon-Cox, L. (1982). MAP math: End of year one report. Unpublished manuscript, University of Pittsburgh, Learning Research and Development Center. Salmon-Cox, L. (1984, September). MAP reading end-of-year report. Unpublished manuscript, University of Pittsburgh, Learning Research and Development Center. Shepard, L. A. (1988, April). The harm of measurement-driven instruction. Paper presented at the annual meeting of the American Educational Research Association, Washington, DC. Shepard, L. A., & Dougherty, K. C. (1991, April). Effects of high-stakes testing o n instruction. In R. L. Linn (Chair), The effects of high-stakes testing. Symposium presented at the annual meetings of the American Educational Research Association and the National Council on Measurement i n Education, Chicago. Strauss, V. (2001, July 10). Review tests go to far, critics say. The Washington Post, p. A09. Stecher, B. M., Barron, S. L., Chun, T., & Ross, K. (2000). The effects of t h e Washington state education reform on schools and classrooms (CSE Tech. Rep. No. 525). Los Angeles: University of California, National Center for Research on Evaluation, Standards and Student Testing.
36
APPENDIX A Mathematical Model of the Validity of Gains The inferences many users base on test scores are very simple. This becomes apparent, for example, when examining reports about test scores in the lay press (e.g., Koretz & Deibert, 1996). A recent release of results from the National Assessment of Educational Progress also illustrates this point. The presentation of the results in The Washington Post included these comments: Less than a third of the nation’s fourth-grade students are proficient at reading and t h e gap between the best and worst readers is widening, according to test results released yesterday by the U.S. Department of Education. . . . The results indicated that fourthgraders who ranked among the nation’s top 10 percent of readers scored slightly higher than they did in 1992, while the bottom 10 percent lost ground. (Fletcher, 2001, p. A2)
As these examples illustrate, many users treat test scores and achievement in a domain as essentially unidimensional and ignore differences among performance elements. Assuming that standards of technical quality have been met, a single score on the test is seen as an adequate measure of mastery of the entire domain of inference. The model of inference implicit in the simplest of these cross-sectional inferences is simply that a test score implies a corresponding level on a single latent performance variable: Y⇒T where Y is a score on a test and T is a latent or “true” indicator of achievement i n the domain that is some form of composite of performance on individual elements or a single latent factor that explains most of the variance in every individual element. Similarly, the model underlying the simplest inferences about change is: ∆Y ⇒ ∆T This assumes that change is in some sense comparable, perhaps proportional, across all elements within the domain. For purposes of validation, however, it is not sufficient to view gains simply in terms of change on a composite measure, whether latent or observed. One reason is that performance elements that are highly correlated in a crosssection may show different patterns of change over time. Progress on measured
37
performance elements, for example, may not imply commensurate progress o n implicit elements that were initially highly correlated with them. Another reason is that the implications of change may hinge on patterns of initial performance. An increase from an initially high level of performance may have different implications than a comparably large increase from an initially low level of performance; in that case, an inference about change on the overall construct must consider initial values as well as the amount of change. Accordingly, the model presented here represents latent change in overall achievement—that is, change across the range of performance elements relevant to the inference—as a set of performance levels on different elements, not as a single composite or composite change. Model of an Inference The goal of this section is to present a model that is general enough to describe any inference that users make about the substantive performance elements from a change score and a description of the assumptions required for such inferences to be valid. An inference made by a user of scores maps change scores on a test to assumed changes in performance on substantive performance elements. Roughly speaking, the inference is valid to the degree that actual changes i n performance, both measured and unmeasured, are similar to the assumed changes in performance. Thus we first present a model for describing this mapping of change scores to assumed changes in performance. We then present a model for determining if changes in performance are similar to the assumed changes in behavior. To make this notion more precise, let Y1 denote a score on a test at time 1 and let Y2 denote the score at time 2. The scores could be for an individual or an aggregate unit such as a school or grade within a school; however, for clarity, we will refer to student scores. Let ∆Y = Y2 – Y1. Let θ = ( θ 1 ', θ 2 ')' be the 2p-vector of unobserved performance elements from the two time points, where p is the number of performance elements, both substantive and non-substantive. θ includes all measured and unmeasured performance elements that are inferred from a change score and all performance elements that contribute to change scores, even construct-irrelevant elements that have zero inference weights. For simplicity, we consider the common case in which each value of θ results in a single change score, such as a change in estimated reading proficiency, ∆Y = G(θ ). 38
This model can easily be generalized, however, to the case in which a test is used to generate several subscores, each of which is a function of some subset of the performance elements included in the test. If Yt = g(θ t) then G(θ ) = g(θ 2) – g(θ 1) ≈
p
∑ wi (θ
2i
– θ 1i),
i
where the θti’s are the elements of θ t and the wi are the effective test weights, w i = ∂g/∂θ i, evaluated at θ 1i. Thus, the w i weight changes in the performance elements by the partial derivative of the function g. Users of change scores have as a target of inference the θ values that they would like to infer from an observed value of ∆Y. Note that a user’s inferences may involve some or all of the values of θ at both time 1 and time 2, not just a θ . For example, the user’s inference about change on a given vector of changes ∆θ performance element may depend on the initial level of performance on that element. Let the set A ∆Y be the target of inference for a change score ∆Y. That is, A ∆Y is the set of θ s that the user assumes is implied by a change score ∆Y for a single unit of observation—in this case, for a single student. For example, suppose there are two performance elements and that the user assumes that the domain is unidimensional, so that ∆Y implies that ∆T = c∆Y for some proportionality constant c. In terms of the individual performance elements, the assumption that ∆T = c∆Y is equivalent to the assumption that θ 21 – θ 11 = c∆Y and θ 22 – θ 12 = c∆Y. Therefore for this user’s inference about the gain of a single student, A ∆Y = {θ : θ 21 – θ 11 = θ 22 – θ 12 = c∆Y }. There is more than a single θ in A ∆Y in the general case because neither the initial nor final values are fixed by the inference. Among the students of interest, the sets A ∆Y are defined by the inference, not by the performance elements and the test. G(θ ) = ∆Y does not imply that θ ∈ A ∆Y; that is, there may be functions of θ that produce ∆Y but are not consistent with the user’s inference. This might arise, for example, if a small decrease in one performance element were more than offset by a large increase in another, but the user’s model of change is conjunctive, requiring increases on all elements. To evaluate the validity of an inference we need to consider how the user’s inference corresponds to student performance. Each student of interest has a vector of performance elements. These elements generate a change score, and from this change score the user infers something about the change in the student’s performance. If a particular student has a vector of performance
39
elements θ * and a change score ∆Y* = G(θ *), then the user infers that the student’s performance belongs to the set A∆Y*. For this user’s inference, the vector of performance elements θ * maps to the set A ∆Y*. For example, suppose the student improves her performance on math computation but not problem solving and the test measures only problem solving; however, the user makes an inference about change in both problem solving and computation. The student’s θ * results in a positive ∆Y*, and the A ∆Y* includes only values of θ where computation and problem solving improve. Thus θ * is not an element of A ∆Y*. More generally, we let A∆Y(θ) denote the inferred values that correspond to the change score θ generates. The notation A∆Y(θ) implies the two-stage process that maps student performance to a change score and a change score to inferred values. Thus, for any θ , A∆Y(θ) is what the user infers about this performance. By comparing θ to A∆Y(θ) we can determine the error in the inference. θ may or may not be an element of A ∆Y(θ). When θ ∉ A ∆Y(θ) then the user’s inference is incorrect for this student with performance elements θ and change score equal to ∆Y. Ideally, θ ∈ A∆Y(θ) for all students of interest, so that inference is correct for the population of interest. If the assumption that θ ∈ A∆Y(θ) for all values of θ is plausible, then we would conclude that the inference is valid. However, validity is a continuum, not a dichotomy, so if the assumption that θ ∈ A∆Y(θ) for all values of θ is not plausible, then the inference could still be sufficiently valid if θ is sufficiently “close to” A∆Y(θ). We now provide a means for determining if θ is close to A∆Y(θ). Measures for Determining the Validity of an Inference As discussed in the previous sections, users of test scores have a, possibly tacit, notion of the discrepancy between two levels of performance. This notion of discrepancy is related to the target of inference and the user’s model of change. The user’s model of change defines the limits of changes in performance and determines which vectors of performance display similar gains in performance and which do not. Because the user might not value change in all dimensions equally the measure of discrepancy or distance between performance vectors might weight discrepancies on some performance elements greater than those on other elements. We use d(ξ , θ ) to denote the user’s measure of distance or discrepancy between two vectors of performance elements. The distance between θ and ξ is greater when the vectors differ on performance elements with large 40
inference weights (elements of particular interest to the users) than when the two vectors differ an equal amount on elements with small weights (elements of little interest to the users). The distance measure does not need to be a traditional Euclidean distance measure. For example, if the user is more concerned about gains for students with low performance at time t = 1 than for student with high performance at t = 1, then the distance measure will depend on the values of θ 1. If ξ is any element of A ∆Y(θ), then this measure also defines the distance between a vector of performance elements and the inferred values of A∆Y(θ). We define this distance as D(θ ) =
inf ξ∈Α∆Y(θ )
d (ξξ , θ ) .
D(θ ) measures the distance from θ to the closest point in A∆Y(θ). If θ is an element of A ∆Y(θ) then D(θ ) = 0. For each individual student of interest there exists a distance D(θ ) between the student’s performance (θ ) and the inferred value of the student’s performance A∆Y(θ). Ideally for each individual D(θ ) will equal zero. However, i n most cases, it would be unrealistic to expect D(θ ) to be exactly zero, even if the user’s inference could be specified perfectly. It is more realistic to expect D(θ ) > 0. In that case, the question becomes the size of D(θ ). The larger the value of D(θ ), the less warranted the inference drawn from the observed ∆Y. For this purpose, it is necessary to distinguish three types of inference: 1. Inferences about individual units of observation, such as students. In this case, the issue is simply how much of a threat to the inference is θ) for the individual, which depends on the distance provided by D(θ measure, the user’s inference weights and the user’s model of change. 2. Inferences about the distribution of change in a group of individual units of observation, such as samples of students. These are not inferences about aggregate summary statistics, such as means. For example, some systems require that failing students attend summer school and use an increase in a test score as a basis for determining whether these students may progress to the next grade. The inference underlying this policy might be stated as follows: in the great majority of cases, students whose scores have increased to a specified level have improved to a sufficient degree on the skills and knowledge in question that they should be promoted. The size of the mean increase is not at
41
issue. What is at issue are the proportion of times that students have improved at least to a certain level, and perhaps the degree to which others fall short. These inferences are discussed below. 3. Aggregate inferences, such as inferences about changes in mean scores at the level of schools. These are not discussed further here. However, these are analogous to #1 and #2 in terms of the logic of inference, even though they are different in terms of statistical properties. For example, if the unit of analysis is individual schools and the statistic on which inferences are based is a mean score, inferences about individual schools are analogous to those about students in #1, and inferences about distributions within groups of schools are analogous to those for groups of students in #2. Note that the distinction between the first and second category of inferences can be blurry, in that many inferences about individual students depend o n information about a collection of individuals. For example, experience with many test-takers may be needed to determine the seriousness of errors about individuals, that is, to establish the user’s inference weights. Nonetheless, the two categories of inference are logically distinct, and considerations enter into the second that do not necessarily enter into the first. More formally, for an inference about an individual student on a single test, the validity of the inference is determined by D(θ )= d(ξ , θ ). In contrast, for a given inference about a collection of students, that is, as defined by the collection of sets A∆Y, there is a unique value of D(θ ) for every vector θ and the inference is valid if D(θ ) is small on average over all values of θ . To calculate this average we need to consider a distribution for the values of θ across students of interest, Fθ . The average is given by θ )dFθ L = ∫ D(θ R2 p
and the inference is valid when L is sufficiently small. The meaning of sufficiently small will depend on the nature of the inference and the performance elements and may be open to debate. Even if the user is focused o n a particular the sample of students, the distribution Fθ . will not be known and to validate the inference the user must make (and test as best as possible) assumptions about this distribution.
42
When evaluating the validity of an inference, we must determine pairs (D, Fθ) of a distance measure and a distribution function that result in small values of L. We must then consider the plausibility of the distribution function given the available empirical evidence to support assumptions about Fθ . We must also determine the consistency of the distance measure with the users inference weights. Given the available empirical data on the distribution of θ and the users inference weights, if there are plausible pairs (D, Fθ) that result in small values of L then the inference is valid, otherwise the evidence indicates that the inference is invalid. Example 1 To make these ideas clear we first consider a very simple example. Suppose a domain has only two performance elements, θ 1 and θ 2, for example, math computation and math problem solving. Also, suppose that the test gives zero weight to θ 2 (problem solving) and nonzero weight to θ 1 (computation). The user, on the other hand, is interested only in θ 2 and infers that ∆Y = ∆ θ 2. Such a situation might occur if a state’s standards focus on problem solving but the state continues to use a test that measures computation. Although many pairs (D, Fθ) might result in L, given the user’s inference, only distances with zero inference weight on θ 2 should be considered. As shown in Figure 1, for a given value of ∆Y, A∆Y = {θ : ∆Y = ∆θ2}. However, the set of θ that result in a change score of ∆Y is the set where ∆Y = ∆θ1. If ∆θ1 ≈ ∆θ2 then D(θ ) will be small. On the other hand, if ∆θ2 is much larger or smaller than ∆ θ 1, then D(θ ) can become arbitrarily large. Therefore to obtain small values of L, the distribution Fθ must put most of its mass on values of θ where ∆θ 1 ≈ ∆θ 2. That is, for the inference to be valid we must assume that ∆ θ 1 and ∆ θ 2 are highly correlated. In this particular example, one might well have data indicating that the cross-sectional correlation between θ 1 and θ 2 is strong, because students who do well in mathematical problem-solving are likely to do relatively well i n computation as well. However, as explained in the body of the paper, a large cross-sectional correlation between θ 1 and θ 2 does not necessarily imply a strong correlation between ∆ θ 1 and ∆ θ 2 because behavioral responses to the test might cause performance on the two elements to change differently over time. The correlation between ∆ θ 1 and ∆ θ 2 might be substantial if teachers respond to the test by emphasizing both computation and problem solving—that is, if they do not reallocate resources between these two elements in response to the test’s 43
emphasis on problem solving. The correlation might also be high if teachers reallocate some resources to problem solving and if the additional work students do on problem solving generalizes and causes gains in computation as well. On the other hand, reallocation, coaching, or cheating might cause θ 1 to increase independently of θ 2; indeed, some forms of test preparation could cause θ 2 to decrease as θ1 increases. Thus, to establish the validity of the inference that ∆Y ⇒ ∆ θ 2, we need supplementary data. Evidence might include concordant trends on an audit test that gives a substantial weight to θ 2, estimates from an audit test of the correlation between ∆θ1 and ∆θ2, or data about instruction showing the forms of test preparation used in response to the test. The simple example demonstrates the potential value of the model. The model calls for specifying the inference and using that inference to identify a measure for determining how well the inference aligned with true performance. The model clarifies how a review of the test and the inference would ideally indicate the values of θ that will result in large error. Finally, the model requires determining the assumptions about the distribution of scores that are required for the inference to be valid given a measure of error that is consistent with the user’s inference weights. The key to the practical utility of the model will be the ability to generate hypotheses and appropriate data to test the validity of the inference in a manner consistent with the model.
44
References Fletcher, M. A. (2001, April 7). Test shows wider gap in reading skills. T h e Washington Post, p. A2.
45