REVIEW ARTICLE published: 15 August 2014 doi: 10.3389/fgene.2014.00263
Toward a systems-level view of dynamic phosphorylation networks Robert H. Newman 1*, Jin Zhang 2,3,4,5* and Heng Zhu 2,6* 1 2 3 4 5 6
Department of Biology, North Carolina Agricultural and Technical State University, Greensboro, NC, USA Department of Pharmacology and Molecular Sciences, Johns Hopkins University School of Medicine, Baltimore, MD, USA The Solomon H. Snyder Department of Neuroscience, Johns Hopkins University School of Medicine, Baltimore, MD, USA Department of Oncology, Johns Hopkins University School of Medicine, Baltimore, MD, USA Department of Chemical and Biomolecular Engineering, Johns Hopkins University School of Medicine, Baltimore, MD, USA High-Throughput Biology Center, Institute for Basic Biomedical Sciences, Johns Hopkins University, Baltimore, MD, USA
Edited by: Andreas Zanzoni, Inserm TAGC UMR1090, France Allegra Via, Sapienza University, Italy Reviewed by: Tamar Geiger, Tel-Aviv University, Israel Stephen Michnick, University of Montreal, Canada *Correspondence: Robert H. Newman, Department of Biology, North Carolina Agricultural and Technical State University, 1601 E. Market St., Greensboro, NC 27411, USA e-mail:
[email protected]; Jin Zhang, Department of Pharmacology and Molecular Sciences, Johns Hopkins University School of Medicine, 725 N. Wolfe St., Baltimore, MD 21205, USA e-mail:
[email protected]; Heng Zhu, Department of Pharmacology and Molecular Sciences, Johns Hopkins University School of Medicine, 733 N. Broadway, Baltimore, MD 21205, USA e-mail:
[email protected]
To better understand how cells sense and respond to their environment, it is important to understand the organization and regulation of the phosphorylation networks that underlie most cellular signal transduction pathways. These networks, which are composed of protein kinases, protein phosphatases and their respective cellular targets, are highly dynamic. Importantly, to achieve signaling specificity, phosphorylation networks must be regulated at several levels, including at the level of protein expression, substrate recognition, and spatiotemporal modulation of enzymatic activity. Here, we briefly summarize some of the traditional methods used to study the phosphorylation status of cellular proteins before focusing our attention on several recent technological advances, such as protein microarrays, quantitative mass spectrometry, and genetically-targetable fluorescent biosensors, that are offering new insights into the organization and regulation of cellular phosphorylation networks. Together, these approaches promise to lead to a systems-level view of dynamic phosphorylation networks. Keywords: protein phosphorylation networks, protein microarrays, fluorescent biosensors, phosphoproteomics, systems biology, kinase-substrate relationship, cell signaling and regulation, quantitative mass spectrometry
INTRODUCTION Protein phosphorylation, mediated by protein kinases and opposed by protein phosphatases, is one of the most widespread regulatory mechanisms in eukaryotes. Inside the cell, protein kinases, phosphatases, and their respective substrates are organized into complex phosphorylation networks that govern nearly all cellular processes. In order to achieve signaling specificity in response to a given environmental stimulus, these networks must be precisely coordinated in cellular space and time. This involves regulation at several different levels, including at the levels of protein expression (e.g., enzyme levels), substrate selection, and spatiotemporal regulation of enzymatic activity. Not surprisingly, disruption of these regulatory mechanisms has been implicated in many pervasive diseases, including cancer (Guha et al., 2008; Deschenes-Simard et al., 2014), diabetes (Guo, 2014; Mackenzie and Elliott, 2014; Ortsater et al., 2014), and heart disease (Kooij et al., 2014; Sciarretta et al., 2014). As a consequence, much effort
www.frontiersin.org
has been dedicated to understanding how these parameters are controlled inside the cell. In this review, we will examine several methodologies used to study the organization and regulation of cellular phosphorylation networks. Our discussion will be organized around two central questions: (1) which cellular proteins are phosphorylated by a given kinase (or dephosphorylated by a given phosphatase) under physiological conditions and (2) how are specific kinases and phosphatases—and ultimately the signaling networks of which they are a part—regulated within the native cellular environment? We will begin by first discussing the properties of protein phosphorylation that make this post-translational modification an attractive chemical signal for cellular information transfer. We will then highlight some of the traditional methods that researchers have used to study the phosphorylation status of cellular proteins before turning our attention to several emerging technologies that are beginning to provide a dynamic and
August 2014 | Volume 5 | Article 263 | 1
Newman et al.
systems-level view of phosphorylation networks. Together, these approaches promise to shed new light on the organization and regulation of cellular phosphorylation networks. CELLULAR AND MOLECULAR CONSEQUENCES OF PHOSPHORYLATION
Protein phosphorylation describes the covalent attachment of a negatively charged phosphate group to one of several amino acid residues. Though several reports suggest that phosphorylation of His residues (resulting in the formation of an acid labile phosphoramidate species) may account for up to 10% of protein phosphorylation in some eukaryotes (Klumpp and Krieglstein, 2002; Besant and Attwood, 2010), it is generally believed that the predominant sites of phosphorylation in mammalian proteins are on Ser (∼86%), Thr (∼12%), and Tyr (∼2%) residues (Hunter, 1996). Phosphorylation of these hydroxyamino acids results in the formation of phosphate monoesters that are surpassingly stable under physiological conditions, exhibiting an estimated half-life of 1.1 × 10¹² years in aqueous solution (Lad et al., 2003). Despite their extremely high stability, phosphate monoesters are nonetheless rapidly hydrolyzed through the catalytic action of protein phosphatases, thus making protein phosphorylation a highly dynamic and “regulatable” posttranslational modification inside cells. Importantly, the chemical properties of phosphate monoesters confer unique characteristics to phosphorylated amino acids that are critically important for their role in cellular signal transduction (Dissmeyer and Schnittger, 2011). For instance, a phosphate monoester contains two ionizable oxygens which exhibit pKa ’s of ∼2.2 and 5.8, respectively, (Hunter, 2012). Therefore, depending on its chemical context, the transferred phosphate group is expected to be either dianionic or partially dianionic at physiological pH. Such a high charge density makes phosphate groups wellsuited to mediate intra- or intermolecular interactions, such as hydrogen bonds and salt bridges, which can impact protein function. In most cases, phosphorylation is believed to induce conformational changes in the target protein that influence its behavior inside the cell. For example, phosphorylation-dependent conformational changes can alter the activity of enzymes either directly, by promoting the reorganization of the enzyme active site, or indirectly, through allosteric effects on regulatory domains or subunits (Hunter, 2012). These modes of regulation are particularly important in the coordination of kinase signaling cascades that underlie cellular phosphorylation networks. For instance, recent evidence suggests that phosphorylation of residues within the activation loop, a highly conserved region present in all eukaryotic protein kinases, triggers global reorganization of two critical hydrophobic “spines” within the kinase core that help to properly position key residues in the active site necessary for catalysis (Taylor and Kornev, 2011; Meharena et al., 2013). Of course, phosphorylation-dependent changes in activity are not restricted to enzymes. Indeed, many ion channels and cellular transporters are known to be regulated by phosphorylation. For instance, phosphorylation of ryanodine receptor (RyR) Ca2+ channels by either Ca2+ /calmodulin-dependent protein kinase II (CaMKII) or cAMP-dependent protein kinase (PKA) induces conformational changes that alter their open probability at the
Frontiers in Genetics | Systems Biology
Systems-level view of phosphorylation networks
sarcoplasmic reticulum, influencing both the intensity and the frequency of Ca2+ spikes in cardiomyocytes and striated muscle cells (Meissner, 2010; Niggli et al., 2013). While CaMKIImediated phosphorylation of S2815 is believed to induce local conformational changes that directly affect the flow of Ca2+ ions through the channel, structural changes caused by phosphorylation of S2809 and/or S2030 by PKA appears to promote the dissociation of the stabilizing protein, calbastin 2, from a site far removed from the phosphorylation sites. These changes lead to “leaky” SR channels associated with aberrant contractile function (Meissner, 2010; Niggli et al., 2013). In addition to modulating its activity, the phosphorylation status of a protein may also impact other cellular parameters important to its function, such as its subcellular location or its stability. For instance, hyper-phosphorylation of the regulatory domain of the transcription factor, nuclear factor of activated T cells 1 (NFAT1), promotes electrostatic interactions between negatively-charged phosphate groups and positively-charged Lys/Arg residues found within a conserved nuclear localization sequence (NLS) (Okamura et al., 2000). These interactions induce conformational changes in the regulatory region that effectively mask NFAT1’s NLS, leading to a predominantly cytoplasmic distribution prior to dephosphorylation by the Ca2+ /calmodulindependent protein phosphatase, calcineurin (CaN). In the previous example, the phosphorylation status of NFAT1 determines whether its NLS is sterically blocked by the regulatory region or exposed to the cellular environment. This is important because the NLS is, itself, a site of interaction with importin family members involved in nucleocytoplasmic shuttling (Marfori et al., 2011). In fact, many phosphorylation-dependent conformational changes are believed to regulate protein–protein interactions. In some instances, such as for the NFAT1-importin and RyR-calbastin 2 interactions described above, the phosphate group(s) is not directly involved in mediating interactions with partner proteins. In contrast, many phosphorylation-dependent interactions rely upon direct recognition of phosphorylated residues by a diverse set of phosphoamino acid binding domains (PAABDs). For instance, many members of the SCF family of ubiquitin E3 ligases associate with their substrates via either Trp-Asp 40 (WD40) or leucine-rich repeat (LRR) PAABDs that specifically bind pSer/pThr residues located in phosphodegrons (Ho et al., 2006; Reinhardt and Yaffe, 2013). Phosphorylationdependent interaction of SCF family members leads to ubiquitylation and subsequent degradation of the substrate by the 26S proteasome. In this way, phosphorylation serves as a key upstream signal which influences protein stability. Over the past 20 years, many PAABDs, each exhibiting distinct substrate specificities and binding affinities, have been characterized. These include PAABDS that exclusively recognize either pTyr residues or pSer/pThr residues, as well as others that exhibit dual specificity, interacting with the phosphate monoester of all three hydoxyamino acids (Liao et al., 1999; Jin and Pawson, 2012; Reinhardt and Yaffe, 2013). While most pTyr binding domains fall within two large families: (1) the Src homology 2 (SH2) domain family (∼120 distinct members) and (2) the phosphotyrosine binding (PTB) domain family (∼27 distinct members) (Yaffe, 2002; Liu et al., 2006; Jin and Pawson, 2012), the
August 2014 | Volume 5 | Article 263 | 2
Newman et al.
diversity of pSer/pThr PAABD’s is much greater. Indeed, as a testament to the prevalence of Ser/Thr phosphorylation in eukaryotes, 14 distinct families of PAABDs that recognize pSer/pThr residues have been described to date (Jin and Pawson, 2012). Such a large number of distinct PAABD families suggests that phosphorylation-dependent interactions are a widely employed means of regulating protein–protein interactions inside cells. Together, phosphorylation-dependent changes in protein function, be it through modulation of enzymatic activity, changes in sub-cellular localization, alterations in protein stability, or regulation of protein–protein interactions (or a combination thereof), plays a major role in regulating cellular physiology. Therefore, it is important to understand what factors influence protein phosphorylation inside cells. FACTORS INFLUENCING PROTEIN PHOSPHORYLATION INSIDE CELLS
Inside the cell, the phosphorylation status of a particular phosphorylation site (phosphosite) is determined by the equilibrium between kinase-mediated phosphorylation, in the one direction, and phosphatase-mediated dephosphorylation in the other direction1 . In order for a kinase to act on a cellular protein, several criteria must be met. For instance, a kinase and its substrate(s) must be expressed in the same cell and at the same time during development. This often involves several levels of control, including transcriptional regulation (e.g., control of gene expression), post-transcriptional regulation (e.g., regulation of mRNA stability) and modulation of protein levels (e.g., regulation of protein stability). Diverse and complementary experimental approaches have been developed to monitor these parameters, including reporter gene assays to track changes in transcriptional activation at a given promoter (Roura et al., 2013; van Rossum et al., 2013; Khan et al., 2014), quantitative real-time PCR (qPCR) and expression microarrays to measure the relative levels of mRNA transcripts (Skrzypski, 2008; Gorreta et al., 2012), and western blot analysis and fluorescent imaging techniques to measure changes in protein abundance over time (Wiechert et al., 2007; Chao et al., 2012). Though a comprehensive discussion of these techniques is beyond the scope of this review, the interested reader is referred to several recent reviews (Wilkins, 2009; van Rossum et al., 2013). In addition to being co-expressed, a protein kinase and its substrate must physically interact with one another in order for phosphorylation to occur. Therefore, information about protein localization and protein–protein interactions is critical in determining whether a given kinase-substrate relationship (KSR) is likely to occur under physiological conditions. Traditionally, researchers have employed biochemical approaches to obtain this information. For instance, subcellular fractionation, generally achieved via differential centrifugation through a density gradient, has long been used to separate cellular organelles. When combined with western blot analysis, cellular fractionation is an effective means of determining the subcellular localization of a particular 1 For
simplicity, unless otherwise noted, we will focus primarily on kinasemediated phosphorylation of cellular substrates for the remainder of this discussion; however, it is important to note that the same principles apply for phosphatase-mediated dephosphorylation of cellular proteins.
www.frontiersin.org
Systems-level view of phosphorylation networks
protein species. More recently, fluorescence imaging techniques, such as immunofluorescence and live cell imaging, have offered insights into the subcellular localization of proteins without disrupting the cellular architecture. Importantly, in the case of live cell imaging, dynamic changes in the subcellular distribution of a fluorescently tagged protein can be visualized in real-time within single cells. The advent of real-time super-resolution microscopy techniques based on photoswitchable fluorescent proteins (FPs) has dramatically increased the resolution afforded by live cell fluorescence imaging experiments (reaching ∼20 nm resolution in living cells compared to >200 nm using standard fluorescence imaging) (Dedecker et al., 2012; Agrawal et al., 2013; Persson et al., 2013). While, in theory, this resolution permits the visualization of several structures important for cellular signaling, such as membrane microdomains (Honigmann et al., 2013) and large protein complexes (Biggs et al., 2011), it is still not sufficient to detect most protein–protein interactions directly. Instead, this information can be attained in several ways, as briefly summarized below. Perhaps the most popular method for assaying protein– protein interactions is co-immunoprecipitation (co-IP). The immunoprecipitation step can be achieved using antibodies raised against either a specific protein-of-interest or an epitope tag, such as the hemagglutinin (HA)- or tandem affinity purification (TAP)-tags (Puig et al., 2001). Therefore, co-IPs can be used to detect interactions that occur in different cell types, ranging from naïve primary cells to transfected and/or genetically engineered cells. When coupled with quantitative tandem mass spectrometric (MS/MS) analysis (see Section “TopDown” Methodologies: In situ Identification of Phosphosites), co-IP assays can yield a wealth of information about protein– protein interactions that occur under various cellular conditions. However, because many protein interactions occur in the context of multimeric protein complexes, in the absence of cross-linking agents, co-IPs do not provide definitive information about direct protein–protein interactions. Moreover, because the cells must be lysed prior to immunoprecipitation, weak and transient interactions are often missed using this approach. In contrast, yeast two-hybrid analysis, which generally detects binary interactions, is able to detect both weak and strong interactions alike. However, it is important to note that, because both the bait and the prey proteins must be localized to the nucleus using this approach, interactions often occur within a cellular context much different from the one normally encountered by the proteins under study. Moreover, if the interaction is dependent upon post-translational modifications, such as phosphorylation or acetylation, the modification may not actually occur in yeast. In fact, this may be the case even if an ortholog of the appropriate modifying enzyme (e.g., the orthologous kinase or acetyl transferase) is present in yeast. Indeed, we and others have recently reported that many KSRs are not conserved between yeast and humans, despite the presence of orthologous kinase-substrate pairs (Mok et al., 2011; Hu et al., 2014). Therefore, to directly visualize protein–protein interactions within the native cellular environment, several fluorescence imaging techniques have been developed (Ciruela, 2008; Shekhawat and Ghosh, 2011; Stynen et al., 2012). These include approaches
August 2014 | Volume 5 | Article 263 | 3
Newman et al.
based on fluorescence resonance energy transfer (FRET) between fluorescently tagged proteins (Padilla-Parra and Tramier, 2012; Zadran et al., 2012; Sun et al., 2013) as well as protein complementation assays (PCA), which rely on the interaction-dependent reassembly of N- and C-terminal fragments of FP color variants (Ciruela, 2008; Shekhawat and Ghosh, 2011). Not only do these techniques allow protein–protein interactions to be observed in many subcellular regions, but they also can be conducted in cell types (e.g., mammalian cells) that place the interacting proteins in the context of their endogenous regulatory networks. Together, gene expression, subcellular localization and protein–protein interaction data can be used to construct extensive interaction networks that offer global information about the interactome under different cellular conditions (Pastrello et al., 2014). This information can be very useful in predicting KSRs that are likely to occur inside cells. For instance, protein–protein interactions, be they direct or indirect (e.g., those mediated by scaffold proteins), appear to be one of the strongest predicators of physiologically relevant KSRs (Newman et al., 2013). This is likely due to the key role that protein–protein interactions play in substrate selection, which is discussed below.
SUBSTRATE SELECTION: IDENTIFYING THE CELLULAR TARGETS OF PROTEIN KINASES AND PHOSPHATASES It is currently believed that ∼40% of the proteins in the human proteome are phosphorylated at some point during their lifetime. By extension, since a given protein often contains multiple phosphorylation sites, the total number of phosphosites in the human proteome has been estimated to be ∼100,000 sites (Zhang et al., 2002; Dephoure et al., 2013). Therefore, simply cataloging the complete complement of phosphosites in the human proteome, irrespective of their dynamic regulation or their functional consequences, is a seemingly daunting task. This task is made even more challenging by the fact that, in many cases, the phosphorylated form of a protein represents only a very small fraction of the total copies of that protein species inside the cell. That being said, while phosphosite identification is extremely important, simply knowing which sites are phosphorylated inside the cell only tells half of the story. Indeed, if we are to truly understand how dynamic phosphorylation networks are organized and regulated inside cells, it is important to know which kinases are actually mediating the phosphorylation event. Therefore, to construct comprehensive maps of cellular phosphorylation networks, researchers have developed a series of experimental approaches that can be broadly grouped into two complementary categories, which we will refer to as “top-down” and “bottom-up” methodologies2. While “top-down” approaches begin at the cellular level and work their way down to the protein level, “bottom-up” approaches begin at the protein level and work their way up to the cellular level. Below, we describe each category and highlight how they can be used together to gain global insights into cellular phosphorylation networks. 2 The “top-down” and “bottom-up” approaches described here should not be
confused with similar terms used to describe MS-based proteomic analysis of intact proteins (“top-down”) or peptide fragments (“bottom-up”).
Frontiers in Genetics | Systems Biology
Systems-level view of phosphorylation networks
“BOTTOM-UP” METHODOLOGIES: IN VITRO ANALYSIS OF KINASE-SUBSTRATE RELATIONSHIPS
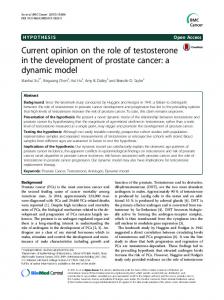
In “bottom-up” approaches, biochemical analysis of individual kinase-substrate pairs is carried out in vitro using purified protein components. Traditionally, phosphorylation is detected using either autoradiography or scintillation counting following incubation of the kinase-of-interest with a single substrate and radiolabeled ATP (e.g., [γ32 P]-ATP or [γ33 P]-ATP). In order to identify the site(s) of phosphorylation on the substrate, the initial screen is often followed by mutational analysis of putative phosphorylation sites. Due to safety concerns associated with radioactive assays and the high cost of radioisotope disposal, several non-radioactive assays have been developed based on alternative detection methods (Glickman, 2012). In many cases, these methods employ coupled enzymatic reactions that measure activity-dependent depletion of ATP. On the other hand, the development of generalizable phospho-detection reagents, such as highly sensitive anti-pTyr antibodies or biotinylated PhosTag phosphochelators (see discussion in Section “Top-Down” Methodologies: In situ Identification of Phosphosites below), allows direct visualization of phosphorylation on protein substrates using fluorescent or chemiluminescent detection methods (Kinoshita et al., 2004, 2012a). Regardless of the detection method employed, detailed biochemical analysis can offer a wealth of information about individual KSRs, including the kinetics of the phosphorylation reaction, the site(s) of phosphorylation and, in some cases, the functional consequences of phosphate addition. Each of these parameters is important for understanding how phosphorylation-dependent signaling is achieved inside cells. However, due to the time that it takes to fully characterize a single KSR, traditional biochemical approaches are not well suited to high-throughput analysis. Therefore, to increase the rate of KSR discovery, researchers have developed phosphorylation assays based on functional protein microarrays (Ptacek et al., 2005; Mok et al., 2009; Popescu et al., 2009; Newman et al., 2013). Functional protein microarrays are composed of thousands of individually purified recombinant proteins immobilized in discrete spatial locations on a functionalized glass surface (Hu et al., 2011; Sutandy et al., 2013). While several surface chemistries have been used to immobilize the purified proteins [e.g., polyvinylidene fluoride (PVDF), nitrocellulose, streptavidin and acrylamide] (Hu et al., 2011), bi-functional cross-linking agents, such as functionalized aminosilane and carboxylic esters, are generally preferable for phosphorylation assays due to their relatively low background signal (Mok et al., 2009). On the microarray, each individual protein is printed multiple times (typically in duplicate or triplicate) to ensure “on-chip” reproducibility and to guard against signal artifacts that can arise due to incomplete washing or experimental variation (Figure 1A). Because each spot on the array typically contains only a few femtograms of protein, sensitive detection methods are necessary to visualize phosphorylation. Moreover, since each protein occupies a defined position on the array and many proteins can potentially be phosphorylated in the same experiment, direct visualization of phosphorylation using either radioactive ATP or specific phospho-detection reagents (e.g., pTyr antibodies) is essential.
August 2014 | Volume 5 | Article 263 | 4
Newman et al.
FIGURE 1 | Identification of KSRs using functional protein microarrays. (A) Functional protein microarrays are composed of thousands of purified proteins immobilized on a functionalized glass surface. Each protein is printed in duplicate and in a defined location on the array. (B) Basic workflow for a phosphorylation assay using functional protein microarrays. Individual microarrays are first blocked and then incubated with the kinase-of-interest (KOI) in the presence of [γ32 P]-ATP. Following incubation, the microarrays are washed extensively to remove unincorporated
During a standard phosphorylation assay, each protein microarray is incubated with an active form of the kinase-ofinterest in the presence of radioactive ATP (Figure 1B). Following incubation, the microarray is washed several times and dried by centrifugation before finally being exposed to high-resolution X-ray film for several hours or several days (Figure 1C). The resulting autoradiogram is then converted to a digital image and scored using image analysis software such as GenePix 6.0 (Axon, Inc.). General kinase substrates (e.g., histone H3 and H4) and/or kinases that undergo autophosphorylation are used as “landmarks” to align grids during scoring. In addition to the experimental arrays, it is important that each batch of experiments includes a negative control in order to identify those proteins that undergo autophosphorylation. Along with the landmarks, these species can also be useful for orienting the scoring grid during alignment. Using this protocol, a team of two researchers in our lab is able to conduct up to 144 phosphorylation assays per day, with each assay probing thousands of potential substrates. In this way, a large number of KSRs can be identified in a relatively short period of time. For instance, using high-density protein microarrays composed of 2158 unique proteins from Arabidopsis thaliana, Popescu and colleagues identified 570 substrates for 10 mitogenactivated protein kinase (MAPK) family members (Popescu et al., 2009). Likewise, we were able to identify over 24,000 in vitro substrates for 289 unique human kinases (Newman et al., 2013). While the latter studies used microarrays containing 4191 unique
www.frontiersin.org
Systems-level view of phosphorylation networks
[γ32 P]-ATP, dried and exposed to high-resolution X-ray film. Autoradiograms are then scanned and scored before being subjected to bioinformatics analysis to identify those KSRs that are likely to occur inside the cell. (C) Autoradiogram from a typical phosphorylation assay. Duplicate spots that each exhibit a normalized signal intensity 3 SD above the mean (green boxes) are considered positive hits. General kinase substrates, such as histone H3 and H4, printed in each block (blue boxes) are used as landmarks to orient the grid during scoring.
human proteins (Hu et al., 2009), the recent development of a high-density human protein microarray composed of 16,368 unique human proteins (representing over 80% of the human proteome) creates exciting new opportunities for KSR discovery at a global scale (Jeong et al., 2012). Due to the large number of phosphorylated species generated during a typical microarray phosphorylation assay, sophisticated statistical analyses are often required to identify those substrates that constitute positive “hits.” First, the signal intensity of each protein spot is measured and subjected to some form of background correction, be it background subtraction or ratiometric analysis (e.g., calculation of the foreground/background ratio) (Ptacek et al., 2005; Popescu et al., 2009; Newman et al., 2013). To eliminate spatial artifacts that can arise due to uneven washing or drying of the microarray, local background correction is often preferable to global correction (Hu et al., 2009). If the normalized signal intensity for each of the replicate spots is above a predefined threshold [e.g., >3 standard deviations (SD) above the mean intensity on the microarray], then the protein is considered a putative substrate. However, it is important to note that, because both the kinase and the substrate are removed from the cellular environment, a positive result in vitro does not guarantee that the KSR actually occurs under physiological conditions. Bioinformatics analysis can help curb this limitation by identifying “high confidence” KSRs that are likely to occur inside the cell. Here, accurate gene ontology (GO) data, such as
August 2014 | Volume 5 | Article 263 | 5
Newman et al.
that obtained using the approaches outlined in Section Factors Influencing Protein Phosphorylation Inside Cells, is a valuable resource for determining whether a given cellular protein is likely to be phosphorylated by its cognate kinase in vivo. Though necessary to eliminate false positives, the use of a stringent cutoff during KSR identification likely results in a relatively high false negative rate, as well (estimated to be ∼95%, in some cases) (Newman et al., 2013). For instance, because the number of phosphosites for a given kinase varies from protein to protein, a substrate that contains only one phosphorylation site for a given kinase will exhibit a lower normalized signal intensity on the array than a protein that contains multiple sites for the same kinase. If the signal intensity of the first substrate falls below the threshold determined for the chip, then that substrate would not be considered a hit even though it is a bona fide substrate of the kinase (which likely would have been classified as such had the experiment been conducted using the purified kinase and substrate in isolation). Indeed, we have observed that known KSRs are sometimes absent from the final hit list. Visual inspection often reveals that this is not because the substrate is not actually phosphorylated on the microarray; rather it is because its normalized signal intensity does not exceed the stringent cut-off required to be considered a positive hit. Likewise, variations in protein abundance on the microarray or impairment of kinase-substrate interactions due to misfolding or truncation of the substrates during purification can bias KSR identification. Importantly, KSRs that are dependent on auxiliary factors, such as scaffolding proteins, co-factors, or post-translational modifications, may be missed all together using functional protein microarrays and other “bottom-up” approaches. Therefore, as a complementary approach to the phosphorylation assays described above, protein microarray assays have been developed using cell lysates. For instance, Woodard et al. recently developed an assay platform that uses functional protein microarrays to measure phosphorylation profiles in whole-cell lysates obtained from cell or tissue samples (Woodard et al., 2013). This platform, which is similar to the phosphorylation assays described above except whole cell lysates are substituted for the purified kinase, revealed changes in the phosphorylation profiles of immortalized U373 cancer cells and gliablastoma tumors upon hepatocyte growth factor (HGF)-mediated activation of the c-Met signaling pathway. One of the primary advantages of this platform is that it more closely mirrors the cellular environment under which KSRs occur. For instance, because lysate assays preserve many of the elements of intact signaling networks, such as the endogenous levels of proteins, co-factors, second messengers, and inhibitors, while also maintaining protein complexes involved in signal transduction, they can offer insights into global changes in phosphorylation networks under different cellular conditions. Indeed, in addition to proteins known to be associated with the c-Met pathway, these analyses identified over 400 proteins that are likely influenced by HGF/c-Met signaling (Woodard et al., 2013). Moreover, the profiles obtained from these assays may be useful for biomarker discovery. Therefore, this approach has the potential to be a powerful diagnostic tool for rapid, cost-effective screening.
Frontiers in Genetics | Systems Biology
Systems-level view of phosphorylation networks
Similarly, reverse phase protein microarrays (RPPA) represent powerful tools for tracking changes in phosphorylation profiles across samples. Unlike the functional protein microarrays described above, RPPA fabrication entails the immobilization of cell lysates or tissue extracts on the functionalized glass surface. The arrays are then probed with an antibody specific for the epitope-of-interest (e.g., a particular phosphosite) to assess changes in its expression levels or phosphorylation status under different conditions. Because each spot contains only a few nanoliters of lysate, many arrays (each containing lysates derived from tens to thousands of unique samples) can be prepared using only a small amount of starting material (Pierobon et al., 2014). The microarrays can then be probed simultaneously, allowing a large number of analytes to be tested in parallel while reducing the effects of inter-assay variability. As a consequence, RPPA-based assays have been widely applied to the study of phosphorylation profiles in clinical samples. For instance, Ummanni et al. recently employed RPPA assays to probe the expression levels and phosphorylation status of 71 cancer-associated proteins in 84 non-small cell lung cancer cell lines (Ummanni et al., 2014). Interestingly, they found that the sensitivity toward the EGFR inhibitors, lapatinib and erlotinib, correlated more closely with EGFR/ERBB2 phosphorylation than with receptor expression levels. This was not the case for sensitivity toward the SRC/BCR-ABL inhibitor, dasatinib, which instead correlated with expression of proteins downstream of EGFR/ERBB2. Of course, a significant limitation of the RPPA approach is its dependence on the specificity and avidity of commercially produced antibodies. As the toolkit of reliable phosphospecific antibodies grows, so too will the utility of this approach. It is important to note that, because many kinases are present in lysates simultaneously, the identity of the kinase actually mediating the phosphorylation of a given substrate cannot be definitively established using lysate-based approaches. Therefore, lysate-based assays should be considered orthogonal to assays using purified kinases. The same is true for other “top-down” approaches, as described below. “TOP-DOWN” METHODOLOGIES: IN SITU IDENTIFICATION OF PHOSPHOSITES
“Top-down” approaches to substrate identification are designed to measure changes in the phosphorylation status of cellular proteins upon activation/inhibition of endogenous signaling pathways. Traditionally, this has been achieved using polyacrylamide gel electrophoresis (PAGE)-based methods (Figures 2A,B). Following cell lysis, the protein-of-interest is either immunoprecipitated or the whole cell lysate is loaded directly onto the gel. Separation is generally achieved via either one- or two-dimensional PAGE. In the case of one-dimensional PAGE, electrophoresis through a denaturing gel is often followed by western blot analysis to visualize the phosphorylation status and/or the migration pattern of the protein-of-interest (Figure 2A). If a phosphospecific antibody exists for the phosphosite under study, changes in phosphorylation levels at that site can be assessed directly by comparing the intensities of the bands before and after treatment (Figure 2AI). However, because phosphorylation can impact protein stability inside the cell,
August 2014 | Volume 5 | Article 263 | 6
Newman et al.
FIGURE 2 | “Top-down” approaches to assess changes in the phosphorylation status of cellular proteins. (A) Approaches based on 1D PAGE. I Western blot analysis using an antibody that specifically recognizes a particular phosphosite. To account for phosphorylation-dependent changes in protein stability, the signal must be normalized to that obtained using an antibody that recognizes the unphosphorylated form of the protein-of-interest (below); II Detection using a general phosphorylation detection reagent, such as Pro-Q Diamond or the Phos-Tag phospho-chelator; III Phosphorylation of some proteins can be assessed based on changes in their electrophoretic mobility through a standard SDS-PAGE gel; IV Phos-Tag electrophoresis allows detection of a wide range of phosphorylation events, often resulting in a ladder corresponding to multiply phosphorylated species (1P, 2P, 3P, etc.). (B) Approaches based on 2D-PAGE. The general workflow of a 2D-DIGE experiment is shown. Accordingly, lysates from treated (Sample A) or untreated (Sample B) cells are first labeled with size- and charge-matched fluorescent dyes, such as Cy3 and Cy5, before being pooled together. A third sample, composed of both lysates labeled with a third dye (e.g., Cy2), may also be included as an internal reference. The pooled samples are then resolved on a 2D-PAGE gel, which generally uses IEF in the first dimension to separate cellular proteins based on their pI’s followed by SDS-PAGE in the second dimension to separate the proteins based on size (HMW, high MW; LMW, low MW). Composite spots [e.g., Cy3 (green) and Cy5 (red)] are shown in yellow.
the signal intensities obtained using phosphospecific antibodies must be normalized to the amount of target protein in each lane (e.g., by using an antibody raised against the unphosphorylated form of the protein). If a phosphospecific antibody does not exist (as is often the case) or the specific site of phosphorylation is not known, the phosphorylation status of proteins may still be assayed using general phospho-detection reagents, such as Pro-Q Diamond (Life Technologies, Inc.) or the Phos-Tag
www.frontiersin.org
Systems-level view of phosphorylation networks
Meanwhile, cellular proteins that are uniquely phosphorylated in the treated sample exhibit a spot train moving from right to left (e.g., boxes 1–4) while those proteins that are dephosphorylated under the experimental conditions are characterized by a spot train that moves in the opposite direction (e.g., box 5). The number of spots in the train corresponds to the number of phosphosites that are occupied in the protein (i.e., four spots represents four phosphorylation events). The intensity of each spot in the train can be used to gauge the relative levels of each phosphorylation state under each condition. (C) Approaches based on MS/MS. The basic workflow for a SILAC experiment is shown. To metabolically label proteins, cells are grown in the presence of either a “heavy” isotope of a particular amino acid (e.g., 13 C-Arg) or its “light” counterpart (e.g., 12 C-Arg). Cells are then pooled and lysed. Cellular proteins are resolved by 1D SDS-PAGE before being digested in the gel by an Arg/Lys-directed protease, such as trypsin. Peptide fragments in individual gel slices (represented by either parallelograms, circles, triangles, or pentagons) are then electro-eluted and phosphorylated species are enriched using one of several phospho-enrichment strategies outlined in the text. Phosphopeptides are then resolved by reverse-phase liquid chromatography (LC) and ionized by electrospray ionization (ESI) before being analyzed by in-line MS/MS. In the MS spectrum, fragments containing heavy isotopes are off-set by a known amount (e.g., 6 Da for 13 C-Arg), allowing quantitation based on the relative intensity of each peak. The identity of individual peaks is determined based on the MS/MS spectrum.
phosphochelator, or based on changes in the electrophoretic mobility of the protein (Figures 2AII,III). In the case of the latter, it is believed that the high charge density of the phosphate monoester prevents the uniform binding of negatively charged SDS molecules in the vicinity of the phosphate group, causing some phosphorylated proteins to migrate more slowly than their unphosphorylated counterparts (Gafken and Lampe, 2006). For instance, using a library of epitope-tagged proteins, the Matsuda
August 2014 | Volume 5 | Article 263 | 7
Newman et al.
group profiled changes in the electrophoretic mobility of each of the proteins in the S. pombe proteome (Shirai et al., 2008). While this study did not focus specifically on phosphorylation, the authors noted that nearly 42% of the proteins in the S. pombe proteome migrated at a molecular weight that was significantly different from their calculated molecular weight (with ∼28% of the proteins migrating at a higher-than-expected MW). However, it is important to note that not all proteins exhibit an observable mobility shift upon phosphorylation. Therefore, to accentuate phosphorylation-induced changes in mobility in an unbiased manner, Kinoshita and colleagues recently developed several methodologies based on so-called Phos-Tag technologies (Kinoshita et al., 2004, 2012a,b; Tsunehiro et al., 2013). PhosTags, which are alkoxide-bridged dinuclear metal complexes, have been shown to selectively bind phosphate monoesters in a sequence-independent manner (Kinoshita et al., 2004). When conjugated to a gel matrix such as acrylamide, the Phos-Tag effectively slows the migration of any species containing a phosphate monoester, leading to a discernable shift in its mobility (Kinoshita et al., 2012b) (Figure 2AIV). Consistent with the notion that many proteins are multiply phosphorylated inside the cell, a ladder of clearly distinguishable bands is often observed using Phos-Tag electrophoresis. Though several studies have used PhosTag technologies either to profile the phosphorylation status of select substrates (Kinoshita et al., 2009; Aguilar et al., 2011; Kinoshita-Kikuta et al., 2012) or to validate substrates identified by other methods (Mukai et al., 2008; Deswal et al., 2010; Mok et al., 2010; Huang et al., 2014; Yip et al., 2014), to date PhosTag electrophoresis has not been applied to large-scale proteomic analyses. It will be interesting to compare the results of such studies with those obtained using standard 1D SDS-PAGE—such as the one conducted by Matsuda et al. in S. pombe (Shirai et al., 2008)—as well as with those that utilize 2D-PAGE, as described below. In addition to one-dimensional PAGE, 2D-PAGE is can also be used to assess the phosphorylation status of cellular proteins. In a 2D-PAGE experiment, proteins are typically separated via isoelectric focusing (IEF) in the first dimension followed by SDS-PAGE in the second dimension (though other separation strategies have also been successfully combined) (Camacho-Carvajal et al., 2004; Kinoshita et al., 2009) (Figure 2B). Because the negative charge of the phosphate monoester causes a reduction in the pI of the protein, the migration of the phosphorylated species is altered during IEF. Separation in the second dimension therefore leads to clearly discernable spot trains along the vertical or horizontal axes, corresponding to differentially phosphorylated species. When coupled with western blot analysis, 2D-PAGE can offer insights into either the phosphorylation status of a specific cellular protein or global changes in phosphorylation across the entire proteome (e.g., changes in Tyr phosphorylation). Alternatively, proteins can first be stained with a contrast agent, such as Coomassie dye or silver stain, then excised from the gel, and sequenced using either Edman sequencing or quantitative MS/MS. One of the greatest strengths of 2D-PAGE is that it simultaneously offers insights into the relative expression levels and post-translational modifications of intact cellular proteins. At the same time, this also highlights one of its limitations with
Frontiers in Genetics | Systems Biology
Systems-level view of phosphorylation networks
respect to phosphosite identification. Indeed, because phosphorylated proteins are often present at relatively low levels inside cells, many phosphoproteins can be missed using this approach. In some cases, this limitation can be overcome through the use of sensitive phosphodetection reagents, such as radioactive ATP or phosphospecific antibodies, or through phosphoprotein enrichment procedures, such as immobilized metal affinity chromatography (IMAC) using trivalent metal ions such as Fe3+ and Ga3+ (Posewitz and Tempst, 1999; Kosako and Nagano, 2011). Likewise, subcellular fractionation can be used to examine the phosphorylation profiles of proteins within specific subcellular compartments (Stasyk et al., 2007). To gain insights into differential phosphophorylation of cellular proteins using 2D-PAGE, two sets of lysates must be compared (e.g., cell extracts from healthy vs. diseased cells). However, due to inherent technical obstacles stemming from gel-to-gel variability and differential staining of proteins, cross-gel comparisons are often difficult using this approach. To address these limitations, researchers have developed 2D-differential gel electrophoresis (2D-DIGE) methodologies (Minden, 2012) (Figure 2B). In a 2DDIGE experiment, spectrally distinct, charge-matched fluorescent dyes, such as Cy3 and Cy5, are used to label the proteins in individual lysates. The two lysates, each labeled with a distinct dye, are then mixed and examined by 2D-PAGE. Because 2DDIGE permits the analysis of multiple lysates on a single gel, direct comparison between different experimental conditions is relatively straightforward. Moreover, due to their high intrinsic brightness, the fluorescent dyes used for labeling are well-suited for the detection of low abundance protein species (Mujumdar et al., 1993; Kosako and Nagano, 2011). Importantly, quantitation of the fluorescence intensity of each spot also allows relative levels of phosphorylation to be measured directly. Using this approach, Pellegrin et al. conducted a proteome-wide analysis of primary erythrocytes undergoing apoptosis following erythropoietin withdrawal (Pellegrin et al., 2012). These studies revealed changes in both protein abundance and the phosphorylation profiles of many important cellular proteins, including several heat shock protein 90 (Hsp90) isoforms. Despite the improved sensitivity and analytical power afforded by 2D-DIGE, methods based on 2D-PAGE are still only able to identify changes in a few hundred proteins at a time (Choudhary and Mann, 2010). This makes it difficult to gain a truly systemslevel view of phosphorylation networks, where thousands of different cellular proteins may be phosphorylated at any given time. In this respect, the development of shotgun proteomics approaches based on MS/MS has been truly revolutionary. Indeed, studies employing shotgun MS/MS have recently led to an explosion in the number of annotated cellular phosphorylation sites, opening new avenues of research in systems biology. Like the other “top-down” approaches discussed above, MSbased detection of phosphosites requires cell lysis prior to analysis. Following lysis, proteins are generally resolved by a separation technique suitable to the sample volume to be analyzed (e.g., SDS-PAGE or column chromatography) and digested using an Arg/Lys-directed protease, such as trypsin, chymotrypsin or lysyl endopeptidase (Figure 2C). Phosphopeptides are then enriched using one of several phosphoenrichment procedures discussed
August 2014 | Volume 5 | Article 263 | 8
Newman et al.
below. The enriched phosphopeptides are separated by reversephase liquid chromatography (LC) before being ionized by electrospray ionization as they elute from the column. Finally, the ionized peptides are loaded onto an in-line mass analyzer for analysis. In the case of MS/MS, two mass analyzers, for example an ion trap instrument and an orbitrap instrument, are often used in tandem to increase the resolution of detection3 . In this scheme, the first mass analyzer is used to obtain a mass spectrum of all peptides eluting from the column at a given time. Once the first mass spectrum is obtained, peptides with a specific mass-to-charge ratio (m/z) are isolated, further fragmented through high-energy interactions, and analyzed by the second mass analyzer (modern mass spectrometers can isolate individual peptides in a matter of milliseconds) (Choudhary and Mann, 2010). The tandem mass spectra obtained from these experiments are then compared against protein sequence databases or in silico peptide fragmentation spectra in order to match the peptide fragments to a corresponding cellular protein (Gafken and Lampe, 2006). A 79.97 Da increase in the mass spectrum of a peptide fragment is indicative of phosphorylation; however, it is important to note that, if multiple Ser/Thr/Tyr residues are present in close proximity to one another in a peptide, it is often difficult to unambiguously identify the site of phosphorylation. Though MS analysis has been used for decades to analyze relatively simple mixtures consisting of a few hundred proteins, recent advances have now made possible the identification of thousands of phosphopeptides in a single study. As a consequence, MS-based studies have contributed to an unprecedented increase in the number of known phosphoproteins and phosphosites, which currently stands at just under 118,500 unique phosphosites in ∼16,400 non-redundant proteins across human, mouse, and several other species [PhosphositePlus database (as of 4/13/2014)]. As we discuss below, this veritable explosion in phosphosite data has been made possible by several key technological advances in MS-based analysis of the phosphoproteome, including (1) the development of phosphopeptide enrichment methods, (2) improvements in the resolution and accuracy of mass analyzers, (3) the emergence of alternative fragmentation methods, and (4) the development of computational algorithms that allow high-confidence peptide identification and phosphosite localization. Moreover, the introduction of quantitation strategies based on isotopic labeling allows researchers to track dynamic changes in global phosphorylation profiles in response to a particular cellular stimulus. Due to the existence of a number of excellent reviews on these topics, (Choudhary and Mann, 2010; Kosako and Nagano, 2011; Johnson and White, 2012; Kinoshita-Kikuta et al., 2012; Nilsson, 2012; Ong, 2012; Rigbolt and Blagoev, 2012) here we will only highlight these innovations and briefly discuss how they have been used to gain a systems-level view of phosphorylation networks. As alluded to above, the occupancy of many phosphosites is sub-stoichiometric. As a consequence, at any given time, only a small fraction of the total copies of a protein species are expected 3 It
should be noted that MS/MS can also be achieved “in time” using a single mass analyzer with multiple separation steps being instituted at different times.
www.frontiersin.org
Systems-level view of phosphorylation networks
to be phosphorylated at a particular site. When coupled with the fact that many phosphoproteins involved in signal transduction are already expressed at relatively low levels, detection of phosphorylated species represents a major challenge to phosphosite identification. To overcome these challenges, researchers have recently developed a variety of phoshpoenrichment techniques designed to selectively bind phosphorylated peptides. In addition to the IMAC- (Andersson and Porath, 1986; Posewitz and Tempst, 1999) and Phos-Tag-based (Nabetani et al., 2009) approaches discussed above, phosphoenrichment strategies using chromatographic separation by strong cation exchange (SCX), hydrophilic interactions, or immobilized metal oxides, such as titanium dioxide (TiO2 ) and ziroconium dioxide (ZrO2 ), have also been successfully combined with MS/MS for phosphosite identification (Ruprecht and Lemeer, 2014; Yang et al., 2014). Likewise, immunopurification using phosphospecific antibodies, such as anti-pTyr antibodies or antibodies raised against the phosphorylated form of the consensus phosphorylation motif of a kinase-of-interest (Zhang et al., 2002), provide information about phosphorylation on a particular type of residue (e.g., Tyr) or in a particular sequence context (e.g., a kinase consensus motif), respectively. Due to their high degree of enrichment and ease of use, IMAC- and metal oxide-mediated enrichment strategies are currently the most popular methods for phosphoproteomic analysis. However, these methods are also prone to non-specific interactions with acidic peptides containing a disproportionate number of Asp and Glu residues. Therefore, it is sometimes necessary to combine one or more enrichment methods prior to analysis by LC-MS/MS. In addition to the development of phosphoenrichment methods, improvements in the resolution and mass accuracy of modern mass analyzers have greatly improved our ability to detect phosphosites in complex mixtures. For instance, whereas standard ion trap mass spectrometers can typically resolve a few hundred to a thousand individual peptides as they emerge from the reverse phase column, modern time-of-flight (TOF) and orbitrap instruments exhibit a mass resolution of 20,000 and 100,000, respectively. Moreover, these instruments exhibit mass accuracies in the low parts-per-million, dramatically improving the coverage that can be achieved in a single experiment. Together, the increased resolution and mass accuracy afforded by modern mass spectrometers allows much more complex mixtures to be analyzed at once, markedly improving both the throughput of a given experiment and the confidence in the resulting peptide assignments. One of the primary challenges in phosphosite detection is preservation of phosphorylation during peptide fragmentation. This is because collision-induced dissociation (CID) methods, which accelerate the ionized peptides in a collision cell and then bombard them with inert gases such as helium, nitrogen, or argon, tend to cause the cleavage of the phosphate monoester linkage on hydroxyamino acid residues (Kosako and Nagano, 2011). The development of “phosphate-friendly” fragmentation methods, such as higher energy collisional dissociation (HCD) (Olsen et al., 2007), electron capture dissociation (ECD) (Zubarev et al., 2000), and electron transfer dissociation (ETD) (Syka et al., 2004), permits efficient fragmentation
August 2014 | Volume 5 | Article 263 | 9
Newman et al.
without cleavage of the phosphoester bond. As a consequence, more phosphosites will be preserved and available for detection. Importantly, because the fragmentation mechanisms used by ETD and CID are complementary, these methods can be used together to improve identification of phosphopeptides (Na and Paek, 2014). Once mass spectra are generated, peptide sequences are typically identified by comparing the spectra with databases specific for the species under study. A number of currently available database search algorithms, such as MASCOT, SEQUEST, X!Tandem, and the Open Mass Spectrometry Search Algorithm (OMSSA), (Eng et al., 1994; Perkins et al., 1999; Craig and Beavis, 2003; Geer et al., 2004) are amenable to the identification of phosphorylated peptides. In general, these algorithms compare the experimentally determined mass spectra to theoretical fragmentation spectra generated in silico. Various scoring metrics are then used to determine the likelihood that a given match represents a bona fide phosphorylation event. In addition to database searches, de novo sequencing approaches have also been developed. Unlike database searches, which are restricted by available sequence data, modern de novo approaches, such as DeNovoPTM, (He et al., 2013) infer the amino acid sequence (and any modifications thereto) directly from the MS/MS spectrum. Consequently, they are able to detect modifications in mutated proteins that may otherwise be missed. However, because de novo approaches are highly dependent on the quality of the spectral data, they are often prone to errors caused by incomplete or random fragmentation patterns (Na and Paek, 2014). To overcome these limitations, hybrid methods have been developed that conduct the database search using short sequence tags composed of two to four amino acids (determined by de novo sequencing). The use of sequence tags, which are less sensitive to sequencing errors than complete de novo sequencing, can dramatically reduce the database search time by reducing the search space to only a few candidate peptides that contain the sequence tag. By comparing the experimentally determined mass spectra with the theoretical spectra associated with the sequence tag, hybrid approaches have the potential to rapidly identify phosphorylation events on peptides (as well as many other modifications). However, as alluded to above, in many cases a phosphorylated peptide may contain multiple phosphorylatable residues. In these cases, the unambiguous assignment of phosphosites is a nontrivial task. Therefore, to facilitate phosphosite identification, programs such as MASCOT and MSQuant include algorithms that assign a confidence score to each Ser, Thr, and Tyr residue present in a peptide sequence. Similar algorithms, such as the Ascore algorithm, can also be applied to MS spectra to facilitate phosphosite identification (Beausoleil et al., 2006; Olsen et al., 2006; Savitski et al., 2011). Finally, due to the complex nature of biological samples and the run-to-run variations that can occur at several steps in the fractionation/detection protocol, traditionally it has been difficult to monitor changes in the phosphorylation status of cellular proteins using MS/MS-based approaches. However, the development of quantitative MS methods, such as stable isotope labeling of amino acids in cell culture (SILAC) (Ong, 2012) and isobaric
Frontiers in Genetics | Systems Biology
Systems-level view of phosphorylation networks
tags for relative and absolute quantitation (iTRAQ) (Evans et al., 2012), have made it possible to directly compare phosphorylation profiles of multiple samples in a single experiment. These approaches, which rely on isotopic labeling of protein and peptide fragments, respectively, have quickly become mainstays in systems biology research. In SILAC, two sets of cells are grown in culture media containing either a stable isotope of a particular “heavy” amino acid(s) (usually 13 C-Arg and/or 13 C-Lys) or its normal, “light” counterpart (Figure 2C). As a consequence, cellular proteins are metabolically labeled with either the heavy or the light isotope. Following lysis, the differentially labeled lysates are mixed together and subjected to identical digestion, separation, enrichment, and detection procedures. Meanwhile, iTRAQ and its close cousin, tandem mass tag (TMT) (Dayon and Sanchez, 2012; Jia et al., 2012), incorporate an isotopically labeled tag on peptide fragments in vitro following protease digestion. Because peptide fragments are labeled after lysis using iTRAQ and TMT, these approaches are amenable to analysis of primary cells as well as cultured cells. However, as with any in vitro reaction, care must be taken to minimize side reactions that can obscure analysis. The power of isotopic labeling techniques stems from the fact that isotopic isomers are chemically identical—and therefore behave identically during LC-MS/MS—but can be distinguished from one another during detection due to a measurable offset between their m/z ratios (Figure 2C). As a consequence, relative changes in the phosphorylation status at a particular site can be measured by calculating the ratio of intensities between the heavy and light isotopes for each fragment. These quantitative MS approaches have proven to be powerful means of tracking systemwide changes in phosphorylation networks in a variety of cellular contexts and, as we will see in Section Computational Models of Phosphorylation Networks, provide critical information that facilitates systems-level modeling of dynamic phosphorylation networks. Together, the advances in MS technology described above have led to the identification and, in many cases quantitative profiling, of a very large number of phosphosites that occur within the cell. Indeed, the identification of thousands, and even tens of thousands, of phosphosites in a single study is often achieved (Choudhary and Mann, 2010). For instance, in a SILAC-based experiment, Olsen et al. employed SCX/TiO2 enrichment and ion trap-orbitrap MS/MS to identify over 20,400 unique phosphorylation sites on ∼6000 cellular proteins isolated from HeLa cells undergoing mitosis (Olsen et al., 2010). In addition to recovering a large percentage of known phosphosites involved in the mitotic transition, this study also uncovered nearly 10,000 previously unknown sites. More recently, Mertins et al. used an i-TRAQ-based protocol to profile ischemia-induced changes in the phosphoproteomes of human ovarian tumor and breast cancer xenograft tissues (Mertins et al., 2014). Among the >25,000 phosphosites identified in these studies, approximately one quarter of them (24%) were either up- or down-regulated in response to short periods of ischemia (