tures in a database, we use public-key cryptography to au- thenticate COAs. During ...... [18] J.-S. Coron, D. Naccache, and J.P. Stern. A New Signature. Forgery ...
Toward An Automated Verification of Certificates of Authenticity Darko Kirovski Microsoft Research One Microsoft Way Redmond, WA 98052
ABSTRACT A certificate of authenticity (COA) is an inexpensive physical object that has a random unique structure with a high cost of exact reproduction. An additional requirement is that the uniqueness of COA’s random structure can be verified using an inexpensive device. Donald Bauder was the first to propose COAs created as a randomized augmentation of a set of fixed-length fibers into a transparent gluing material that fixes once for all the position of the fibers within. The statistics of the positioning of fibers is used as a source of randomness that is difficult to replicate. As oppose to recording authentic fiber-based COA structures in a database, we use public-key cryptography to authenticate COAs. During certification, the unique property of the physical object is extracted, combined with an arbitrary text, signed with the private key of the issuer, and the signature is encoded and printed as a barcode on the COA. Since the capacity of the barcode is limited, the goal of any COA system is to contain in the signed message as much information about the random structure of the physical object as possible. In this paper, we show that the cost of forging a particular COA instance is exponentially proportional to the improvement in compressing COA’s random features. Next, we formally define the compression objective, show that finding its optimal solution is an NP-hard problem, and propose a heuristic that improves significantly upon best standard compression methods.
objects that have a random unique structure which satisfies three requirements: • the cost of creating and signing original COAs is small, relative to a desired level of security, • the cost of exact of near-exact replication of the unique and random physical structure contained in the COA is several orders of magnitude larger than creating an original, and • the cost of verifying the authenticity of a signed COA is small, again relative to a desired level of security. An additional requirement, mainly impacted by a desired level of usability, is that a COA must be robust to ordinary tear and wear. This set of requirements significantly limits the number of ways a COA can be conceived. For example, almost all heterogenous materials have random microscopic substructures that are nearly impossible to replicate (e.g., paper). However, for most of them, it is rather expensive to read such substructures as their readout involves strong magnifying ratios and a submicron-level alignment precision. y
A
Categories and Subject Descriptors: E.4 [CODING AND INFORMATION THEORY]: Data compaction and compression, H.4.m [INFORMATION SYSTEMS APPLICATIONS]: Miscellaneous.
R
B
L
General Terms: Algorithms, Design, Economics, Security.
L
Keywords: Certificates of authenticity, point compression, asymmetric traveling salesman problem.
1. INTRODUCTION Certificates of authenticity are digitally signed physical
Permission to make digital or hard copies of all or part of this work for personal or classroom use is granted without fee provided that copies are not made or distributed for profit or commercial advantage and that copies bear this notice and the full citation on the first page. To copy otherwise, to republish, to post on servers or to redistribute to lists, requires prior specific permission and/or a fee. EC’04, May 17–20, 2004, New York, New York, USA. Copyright 2004 ACM 1-58113-711-0/04/0005 ...$5.00.
x
Figure 1: An example of a COA with K randomly thrown fibers scanned at a resolution of L × L pixels. Each fiber is of fixed length R. Directional light in the denoted circle lights up the end-points of the fibers that have one end in the circle. To the best knowledge of the author, COAs were first introduced for arms control verification [3, 2]. Donald Bauder was the first to propose COAs created as a collection of fibers randomly positioned in an object using a transparent1 1
Bauder proposed fiber-based COAs for banknote protection - the fibers in that proposal were fixed using a semitransparent material such as paper [3].
gluing material which permanently fixes fibers’ positioning [3, 2]. Readout of the random structure of a fiber-based COA can be performed in numerous ways using the following fact: if one end-point of a fiber is exposed to light, the other one will illuminate. In a sense, this is the “third dimension” of the COA which cannot be replicated using an inexpensive scan-and-print device. An exemplary detector implementation with a light bar passing over the fibers and an array of photo-detectors has been developed in efforts to provide a strong counterfeit-deterrent for banknotes [4, 9]. An example of a fiber-based COA is illustrated in Figure 1; by shedding light on a certain region of the COA, all endpoints of fibers that have at least one end-point within the lit up region, are illuminated. There are only few efforts that have followed Bauder’s work. Recently, Pappu has created a class of physical oneway functions via speckle scattering [10]. He has focused on Gabor wavelets to produce short digests of the natural randomness collected from an optical phenomenon. His Ph.D. thesis has a solid survey of the related but scarce work [10].
1.1 COA Issuing and Verification Typically, a single COA instance encapsulates three features: (a) the COA object, (b) the associated data – certain information that the issuer certifies with the COA such as product ID or expiration date, and (c) a cryptographic signature of the object-data association – published on the COA as a barcode or in some other machine-readable form such as an RFID or a magnetic strip. Each COA instance is associated with an object whose authenticity the issuer wants to vouch. A COA instance is issued in the following way. First, a certain hard-to-replicate statistic of COA’s unique structure (e.g., random positions of COA’s fibers) is digitized and compressed - lets denote this message as f . Next, the textual data associated with the COA is hashed using a cryptographically secure hashing algorithm such as SHA1 [8]. The resulting 160-bit hash is denoted as t. Then, messages f and t are merged into a message m = f � t using a reversible non-commutative operator � such that (∃�−1 )f = m�−1 t. Note that f is not hashed because its plain-text value must be retrieved during COA verification. Shortly, we review the operator � in more detail. Finally, message m is signed with the private key of the COA issuer. We use an RSA private key of |m| + 1 bits to sign m [12]. The resulting signature s is published in machine readable form with the COA. During verification, initially, all three components of the COA are scanned: COA’s unique structure, the text, and the barcode. The barcode is decoded into the originally printed signature s. The scanned textual data is converted into a text-string using reliable optical character recognition. For successful COA verification, the text and the barcode need to be read without errors. Next, after verifying the signature with the corresponding public RSA key of the issuer [12], the verifier obtains the signed message m. After the verifier hashes the text to obtain t, it computes f = m�−1 t. Then, the verifier compares the scanned COA structure with the decompressed structure of the originally signed COA. If the two structures are similar within a certain threshold, only then the COA is declared as authentic. Finally, we revisit the selection of the operator �. Its purpose is to prevent adaptive existential forgery on the
signing primitive, e.g., RSA, where the adversary creates a valid signature with limited control over the message [16], [17], [18]. This problem is well known and has been addressed in several protocols including the probabilistic signature scheme with message recovery (PSS-R) [19]. Although several integrity check mechanisms for RSA signatures can be used with different security properties, the exemplary PSS-R achieves provable security with near-optimal redundancy used in order to achieve a desired level of security. In case � = PSS-R, then message m is created by setting M = f and hashing M ||t||r to obtain w = h(M ||t||r), where h() is a hash function and M , w, and r refer to the corresponding variables in Figure 2 in Section 5 of [19]. PSS-R derives m = b||w||r∗ ||M ∗ where b is a single bit set to 0 and variables r∗ and M ∗ are created as in Figure 2 in Section 5 of [19]. Signature’s integrity check in this case is performed according to the RecP SSR procedure presented in Section 5 of [19] with the last step altered to: if h(f ||t||r) = w and b = 0 then return f else return REJECT. The signed message m has bit-length |f | + 2hLen + 16, where hLen is the length of the output of the hash function h() in bits (160 bits for SHA1 [8]). In order to counterfeit protected objects, the adversary needs to either: (i) figure out the private key of the issuer or (ii) devise a manufacturing process that can exactly replicate an already signed COA instance, or (iii) misappropriate signed COA instances. From that perspective, COA can be used to protect objects whose value roughly does not exceed the cost of forging a single COA instance including the accumulated development of a successful adversarial manufacturing process (ii). The most immediate goal of a COA system is to ensure the authenticity of products or certain information associated with a product. The set of applications is numerous and broad, ranging from software and media (e.g., DVD, CD) anti-piracy to unforgeable coupons and design of tamperevident hardware. For example, creating a tamper-resistant chip would require coating its package with a COA. Before each usage, the integrity of the COA should be verified in order to verify authenticity of the protected silicon. In this paper, we evaluate a class of hardware platforms for inexpensive but efficient read-out of the three dimensional unique structure of a fiber-based COA. Since the capacity of a barcode for low-cost readers is limited to about 3K bits, the message signed by the private key is limited to the same length. As the primary goal of a COA system is to maximize the effort of the adversary who aims at forging a specific COA instance - see counterfeiting effort (ii) - in this paper, we focus on the problem associated with storing in the fixedlength signed message as much as possible information about the uniquely random structure of a fiber-based COA. We first develop an analytical model for a fiber-based COA, then formalize the problem of lossy compression of a point set, and show that optimal compression of fibers’ positions in a COA instance is an NP-complete problem. In order to heuristically address this problem, we propose an algorithm which significantly improves upon compression ratios of offthe-shelf and/or trivial compression methodologies.
1.2
Capturing the 3D Statistics of a COA
There are numerous ways how the three dimensional structure of a fiber-based COA can be captured. The capturing process should be such that its implementation is inexpen-
sive and that the recorded structure is hard to replicate using an inexpensive manufacturing process. For brevity and simplicity, we make an assumption that a particular type of capturing hardware is used, although numerous similar variants with different performance can be trivially derived. COA scanner with 2x2 cells
Scanner cell CCD matrix (128x128) LED diode Reflective walls
Illuminated cell
Illuminated fibers
COA
Figure 2: An exemplary COA scanner without any mechanical components with 2×2 cells, each of them with a CCD matrix (scanning device) and a LED diode (light source). A generic version of the adopted capturing hardware has been created by Dr. Yuqun Chen of Microsoft Research and is illustrated in Figure 2. The capturing process divides the area of the COA into several subregions (in the example, four equally sized subregions). For each region the following procedure is performed. The device sheds light of a particular wave-length onto the selected region while the other regions are isolated from the same light source. For each test, the working wave-length is randomly selected. As a result, all end-points of fibers with at least one end-point in the selected region are lit up. Using a low-resolution CCD matrix, the location of these end-points in the complementary part of the COA can be recorded. Hence, the read-out of COA’s 3D structure consists of four digital images that contain four different point-sets, each of them active only upon activating the corresponding COA region. Note that the mechanism does not record the positioning of each individual fiber - it only establishes connection between a COA region and a subset of fiber end-points. The difficulty of replicating a particular COA instance stems from the fact that it is hard to place several hundred micron-thin fibers in a particular lay-out within a fixed area even with advanced robotics or laser-guided sculpting. Our speculation is that the future progress of nanotechnology is going to drive the cost efficacy of COA systems.
1.3 Simple Economics of COA In this subsection, we define the impact of the efficiency of a compression scheme on the economic effectiveness of a deployed COA system. Assuming a manufacturing and deployment price of ςm dollars per COA instance, its deployment for product protection reduces the profit by ςm dollars per instance. In order to justify investment, benefits in deploying COAs for product protection (e.g., reduction in piracy or increased customer base due to improved product security) must exceed ςm dollars per instance. On the other hand, the difficulty in manufacturing exact copies of a given COA instance leads to an assumption that
the price of forging a COA instance is ςf � ςm . The adversary can expect profits only if the sum of ςf and the cost of manufacturing and marketing the forged product is smaller than the price the forged product can fetch on the market. Clearly, it is of ultimate importance for any COA system to maintain ςm small and ςf large. We quantify the effect of a compression mechanism on the cost-effectiveness of a COA. We assume that using a limited amount of storage, a reference compression scheme, C, stores G out of κ ≥ G illuminated fiber end-points. COA validation tolerates G(1 − ζ) undetected fiber end-points when matching the signed and scanned point-sets. Typically, we have ζ ∈ {0.8, 1}. While forging a COA instance, the adversary positions sequentially fiber end-points until Gζ of them are at exact locations. The adversary has κ trials to perform this task.2 If unsuccessful, the adversary must try to create a new instance. To prevent the adversary from using more than κ fibers, the verification device should count the number of fibers in√a COA by tiling its area into squares not larger than R( 2)−1 in one dimension, illuminating consecutively all of them, and verifying that the total sum of all illuminated points is at least 2κζ and at most 2κ. The adversary uses a manufacturing mechanism which places fibers at a given position with likelihood 1 − ν, where the placement error, ν, is relatively small. We denote as p(a, b), the probability that the adversary has finished her job after a+b trials,3 a of them successful and a+b ≤ κ. The cost of positioning a single fiber end-point during forgery equals ςe . Lemma 1. Expected Trials to Forge a COA Instance. Given a compression scheme C, lets denote the expected number of COA instances that the adversary needs to manufacture to create a valid COA instance as χ(C). It equals the inverse of the probability that manufacturing a single COA instance succeeds: χ(C)−1
=
κ �
p(Gζ, i − Gζ)
i=Gζ Gζ
= (1 − ν)
κ � i=Gζ
�
(1)
� i−1 ν i−Gζ . i − Gζ
Lemma 2. Cost of Forging a COA Instance. Given a compression scheme C, the expected cost ςf (C) of forging a COA instance equals: ςf (C) = ςe
κ �
i · p(Gζ, i − Gζ) +
i=Gζ
= ςe (1 − ν)Gζ
κ � i=Gζ
�
∞ � �
−1 �i
1 − χ(C)
κ
i=1
� i−1 iν i−Gζ + (χ(C) − 1)κ . (2) i − Gζ
Theorem 1. Impact of Point Compression on COA Forgery. The expected increase in the cost of forging a COA 2 In Section 5, we show how the number of trials can be significantly reduced by imposing a detection constraint; however, for brevity and simplicity, in this subsection we consider only the former case. 3 Last, a + b-th, trial must be a successful positioning.
instance for two compression schemes C1 and Cθ , which store G and Gθ, θ > 1 fiber end-points respectively using the same limited storage, is exponentially proportional to the Gθζ > κ: improvement in compression, θ, if 1−ν ςf (Cθ ) = O (exp(θ)) . ςf (C1 )
(3)
Proof. Note that the expression in Eqn.2 has two sum components; lets denote them as ςf� and ςf�� . The first component computes the cost of creating a COA forgery without creating discarded instances. If the expected number of trials Gθζ , is smaller required to position Gθζ fiber end-points, 1−ν than the number of fibers available for positioning, κ, then ςf� � ςf�� . In the opposite case, when the manufacturing process is more likely to create an incorrect COA forgery, Gθζ > κ, the second component ςf�� quickly surpasses ςf� i.e., 1−ν with the increase of θ, so that ςf (C) ≈ ςe [χ(C) − 1] κ. The analytical form from Eqn.1 can be rewritten as follows: χ(Cθ )−1
=
(1 − ν)A [(1 + ν)A + (4) �� � � �� A � A+t−1 A − νt + t t t=2 � � κ−A � t+A−1 t ν ], t t=A+1
where A = Gθζ. If κ < 2A, the third component in the sum in Eqn.4 disappears. From Eqn.4, we derive: ςf (Cθ ) ≥ (1 − ν 2 )−G(θ−1)ζ . ςf (C1 )
(5)
Note that for ν → 0, the dependency is not exponential; however, this case is of no interest because it signifies that the adversary has fully mastered the production of COAs. For our case of significance 0.1 ≤ ν < 1, the exponential dependency from Eqn.3 holds. Based upon the economic viability of deploying a COA, for a fixed manufacturing cost ςm , the goal of the COA designer is to maximize the cost of forgery ςf (C) ≈ χ(C) by using the best parameter set {R, K} that increases the distance [Gθζ − (1 − ν)κ] as much as possible. For a given adversarial technology ν, this goal is achieved by improving the compression methodology (increases θ), enhancing the scanning devices (increases ζ), and by reducing the number of available trials per COA instance, κ (technique introduced in Section 5).
2. COA MODEL In this section, we present an analytical model of a fiberbased COA. We model two important features of a COA S. Given that a particular region Si of the COA is illuminated, we compute (2.1) the probability density function that a particular point in S − Si is illuminated and (2.2) given that K fibers are sprayed into S, compute the expected number of fibers that are illuminated in S − Si .
2.1 Distribution of Illuminated End-Points We model a COA(L,R,K) as a square with an edge of L units and K fibers of fixed length R ≤ L/2 randomly thrown
over COA’s area. Other model variants, such as variable fiber length or arbitrary shape COA, can be derived from this model. We position the COA in the all-positive quadrant of a 2D Cartesian coordinate system. In addition, we divide the COA into four equal squares S = {S1 , S2 , S3 , S4 }. Each of them is used to record the 3D fiber structure as described in Subsection 1.2. Next, we denote a fiber as a tuple f = {A, B} of points A, B ⊂ S such that the Euclidean distance between them is ||A − B|| = R. Definition 1. Distribution of Illuminated Fiber EndPoints. Given that one of the squares Si is illuminated, we define the probability density function (pdf ) ϕ(i, Q(x, y)) for any point Q(x, y) ⊂ S − Si via the probability ξ(i, P ) that any area P ⊂ S − Si contains an illuminated end-point A of a fiber f = {A, B}, conditioned on the fact that the other end-point B is located in the illuminated region Si . More formally, for any P ⊂ S − Si : ξ(i, P ) = Pr[A ⊂ P |f = {A, B} ⊂ S, B ⊂ Si ]
ϕ(i, Q(x, y))dxdy. = � �
(6)
Q(x,y)⊂P
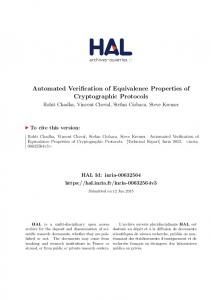
Lets assume that throwing a fiber f = {A, B} into a COA consists of two dependent events: (i) first end-point A lands on the COA and (ii) second end-point B hits the COA. While A can land equiprobably anywhere on the COA, the position of B is dependent upon the location of A. Endpoint B must land on part of the perimeter of the circle centered around A, with a radius R, and contained within the COA. In this paper, we omit the derivations that analytically compute the function ϕ(i, Q(x, y)) based on the analysis of the events (i-ii). As an example, Figure 3 illustrates the pdf of fiber end-point occurrence in a COA with dimension L = 64 sampled at unit points and fiber length R = 28. It is important to notice that the likelihood that an end-point of a fiber lands on a certain small area P ⊂ S − S1 varies significantly depending on the particular position of P within S − S1 . By using the information about the variance of ϕ(i, Q(x, y)) throughout S − Si , we can improve significantly the point-subset compression algorithms as presented in Section 3.
2.2
Illumination Ratio of Fiber End-Points
Definition 2. Illumination Ratio of End-Points. For a COA(L,R,K) and its illuminated region Si , we define the illumination ratio λ as a probability that a fiber f = {A, B} has landed such that one of its end-points is in B ⊂ S − Si conditioned on the fact that the other end-point is in A ⊂ Si : λ = Pr[B ⊂ S − Si |f = {A, B}, A ⊂ Si ].
(7)
Definition 3. Possibly Illuminated Arc. For any point A ⊂ Si , we define a function denoted as ψ(i, A(x, y)) that measures the length of the part of the perimeter of C(A, R) contained by S − Si . Definition 4. Perimeter Containment. First, for a given point A ⊂ S, we define the perimeter containment
3.1
COA(64,28,K)
Encoding Point-to-Point Vectors
-3
x 10
In this subsection, we show how a vector defined by its starting and ending point is encoded using a near-minimal number of bits. An additional constraint is that the points in the considered area occur according to a given pdf.
1
φ(1,Q(x,y))
0.8 0.6 0.4
3.1.1
0.2 0
y
10 20 30
20
10
x
30
40
40
50 60
50 60
Figure 3: An example of the function ϕ(1, Q(x, y)) for a square COA with parameters L = 64 and R = 28 sampled at unit points. function +(A), which measures the length of the part of the perimeter (arc) of the circle centered at A with radius R that is encompassed by the entire COA, S. Lemma 3. Dependence of ψ(1, Q(x, y)), +(Q(x, y)), and λ. The illumination ratio defined as in Def.2, can be computed as follows:
λ=
ψ(i, Q(x, y)) dxdy. +(Q(x, y))
(8)
Q(x,y)⊂Si
Proof. (sketch) Lets denote a circle centered at a point A ⊂ S with radius R as C(A, R). For each point Q ⊂ Si , the likelihood that the other end-point B of a fiber f = {Q, B} lands within S −Si , equals the ratio of lengths of parts of the perimeter of C(Q, R) contained by S −Si and S respectively. By integrating this ratio over all points within Si , we get Eqn.8. Given a COA(L,R,K), using λ, computed by numerically approximating Eqn.8 and the closed forms for ψ(1, Q),4 one can compute the expected number of illuminated points in S − S1 when S1 is illuminated as λK/2. For example, for a COA(64,28,100) the resulting λ ≈ 0.74, which means that on the average, the number of illuminated end-points in case Si is illuminated, is about 0.74 · 50 = 37.
3. COMPRESSION OF A POINT-SUBSET IN A COA The goal of the COA system is to enforce the task of manufacturing (i.e., forging) a specific COA instance as difficult as possible. We quantify this goal as a demand for recording the positions of as many as possible fibers of the COA. In our exemplary presentation of the compression algorithm, the number of COA regions equals four; hence, for each region Si , a quarter nM /4 of bits in the signed message m is dedicated to storing as many as possible fiber end-points illuminated in S − Si once light is shed on Si . Note that in general, not all illuminated points need to be stored; only the largest subset of these points that can be encoded using nM /4 bits. 4 For brevity, we omit the derivation of the closed analytical forms that quantify ψ(i, Q(x, y)).
Arithmetic coding
We first review arithmetic coding as a tool for compressing data. Rissanen introduced the fundamental arithmetic coding principles in [11]. An arithmetic coder (AC) converts an input stream of arbitrary length into a single rational number within [0, 1}. The principal strength of AC is that it can compress arbitrarily close to the entropy [13], [11]. AC is commonly described through examples [15]. We show how a word ”aba” is encoded given an alphabet L = {a, b} with an unknown pdf of symbol occurrence. The example is illustrated in Figure 4. Initially, the range of the AC is reset to [0, 1} and each symbol in L is given an equal likelihood of occurrence Pr[a] = Pr[b] = 1/2. Thus, the AC divides its range into two subranges [0, 0.5} and [0.5, 1}, each representing ”b” and ”a” respectively. Symbol a is encoded by constraining the range of the AC to the range that corresponds to this symbol, i.e., [0.5, 1}. In addition, the AC updates the counter for the occurrence of symbol ”a” and recomputes Pr[a] = 2/3 and Pr[b] = 1/3. In the next iteration, according to the updated Pr[a], Pr[b], the AC divides its range into [0.5, 0.6667} and [0.6667, 1}, each representing ”b” and ”a” respectively. When ”b” arrives next, the AC reduces its range to the corresponding [0.5, 0.6667}, updates Pr[a] = Pr[b] = 2/4, and divides the new range into [0.5, 0.5833} and [0.5833, 0.6667}, each representing ”b” and ”a” respectively. Since the final symbol is ”a”, the AC encodes this symbol by choosing any number within [0.5833, 0.6667} as an output. By choosing a number which encodes with the fewest number of bits (digits in our example), 0.6, the AC creates its final output. The decoder understands the message length either explicitly in the header of the compressed message or via a special ”endof-file” symbol. The AC iteratively reduces its operating range up to a point when its range is such that the leading digit of the high and low bound are equal. Then, the leading digit can be transmitted. This process, called renormalization, enables compression of files of any length on limited precision arithmetic units. An AC encodes a sequence of incoming symusing a number of bits equal to source’s bols s = s1 , s2 , . . . � entropy, H(s) = − s Pr[si ] log2 (Pr[si ]). Hence, for a semiinfinite stream of independent and identically distributed symbols, on a computer with infinite precision arithmetic, the AC is an optimal, entropy coder [11].
3.1.2
Arithmetic Encoding of a Min-Distance Pointto-Point Vector
Given a COA(L,R,K), we assume that light is shed on one of its quadrants, Si . Next, we assume that the COA is partitioned into a grid of L × L unit squares U = u(i, j), i = 1 . . . L, j = 1 . . . L, where each u(i, j) covers the square area within x ∈ {i − 1, i], y ∈ {j − 1, j]. Unit areas model the pixels of the digital scan of a COA. The resolution of the scan equals L × L. Next, we define a principal point of a unit u(x, y) as a point Qu with coordinates (x, y). Lemma 4. Unit Illumination Likelihood. If there are κ fibers with exactly one end-point in S − Si , the probability
1.0000
1.0000
0.6667
a
a
a
0.5000
b 0.0000
Pr[a]=1/2 Pr[b]=1/2
unit v, algorithm A1 assigns a range equal to the probability that v is one of the two closest illuminated units with respect to the source unit u. Lets denote this probability as p(v|u). In the case when κ � 1 units are expected to illuminate in S − Si , p(v|u) can be computed as follows:
0.5833 0.6667
b 0.5000
Pr[a]=2/3 Pr[b]=1/3
b
p(v|u)
=
�
τ (v)
[1 − τ (w)] +
w⊂Mv (u)
0.5000
�
Pr[a]=1/2 Pr[b]=1/2
τ (v)τ (w)
w⊂Mv (u)
Figure 4: An example of how an arithmetic coder encodes the string ”aba” given an alphabet L = {a, b} with an unknown pdf of symbol occurrence.
�
(10) [1 − τ (z)] ,
z⊂Mv (u),z�=w
where the set of units Mv (u) is computed as in algorithm A1. For each unit v, algorithm A1 assigns a range γ(v, u) used by the AC to encode v conditioned on the fact that u has already been encoded. This range is equal to:
that any unit area u(x, y) ⊂ S − Si contains at least one illuminated fiber end-point equals:
γ(v, u) =
p(v|u) � . p(w|u)
(11)
w⊂S−Si
τ (u)
= =
Pr[(∃f = {A, B} ∈ F )A ⊂ u, B ⊂ Si ] 1 − [1 − ξ(i, u)]κ .
(9)
Proof. We have τ (u) = Pr[(∃f = {A, B} ∈ F )A ⊂ u, B ⊂ Si ] = 1 − Pr[(¬∃c ∈ F )A ⊂ u, B ⊂ Si ] from where we derive τ (u) = 1 − (1 − Pr[A ⊂ u, B ⊂ Si |f = {A, B}])κ . From Eqn.7, we conclude Eqn.9. In Subsection 2.2, we have computed the expectation for κ is E[κ] = λK/2. Problem 1. Dual Vector Encoding for COA. Conditioned on the fact that unit u ⊂ S − Si contains an illuminated fiber end-point5 , our goal is to encode using as few as possible bits the locations of two other illuminated units v1 and v2 relative to unit u. An additional constraint is that among all illuminated units in S − Si , the principal points of v1 and v2 , Q1 and Q2 respectively, are located at two shortest distances in Euclidean sense from the principal point of u, Qu . A priority rule is set so that if a set of units V, |V | > 1 are at the same distance with respect to u, we encode first the one with the highest likelihood of illumination: arg maxv⊂V (τ (v)). Algorithm A1. Set U as a list of all unit areas in S − Si − u. List of all marked units, M (u), is set to M (u) = ∅. do Find all unit areas V = arg minv⊂U ||Qv − Qu ||. do Find unit area w = arg maxv∈V ξ(1, v). Set AC range for w to γ(w, u) (see Eqns.10,11). Set of nodes ordered before w is Mw (u) = M (u). M (u) = M (u) ∪ w, V = V − w, U = U − w. while V �= ∅ while U �= ∅ The encoding of a unit-to-unit vector is done using an AC, which uses algorithm A1 to assign a corresponding range on the encoding interval for each encoding symbol, i.e. each unit v ⊂ S − Si different from the source unit u. For each 5
Since Pr[one fiber end-point illuminated in u] � Pr[two or more fiber end-points illuminated in u], we assume that unit u has exactly one illuminated fiber end-point.
Thus, the two nearest illuminated units are encoded by construction near-optimally because a sequence of symbols is encoded using a number of bits approximately equal to the entropy of the source: H(u)
=
−
�
γ(v, u) log2 [γ(v, u)] .
(12)
v⊂S−Si
Dual vector encoding is used as a primitive to encode a subset of points in the overall compression algorithm presented in the Subsection 3.2. Although the encoding algorithm is near-optimal for the set of assumptions presented in Subsection 3.1.2, the same set of constraints is not valid for the overall compression goal, hence, we discuss the inherent optimality of using an AC with range allocation via A1 in Subsection 3.2.
3.2
Compression of a Point-Subset
We first model the optimization problem of compressing the positions of as many as possible illuminated unit areas using a fixed number of bits. Consider the following directed complete graph with weighted edges. For each illuminated unit u ⊂ S − Si , we create a node nu . A directed edge e(u, v) from node nu to node nv is weighted with the optimal length of the codeword that encodes the vector that points to v, ω(e(u, v)) = − log2 [γ(v, u)] as in Eqn.12, conditioned on the fact that u is already encoded. Lets denote this graph as G(N, E, Ω), where N , E, and Ω represent the set of nodes, directed edges, and corresponding weights respectively. Problem 2. Compression of a Point-Subset (CPS). Instance: Directed, complete, and weighted graph G(N, E) with a non-negative vertex function Ω : E → R, positive integer lmin ∈ Z+ , positive real number Λ ∈ R+ . Question: Is there a subset of l > lmin nodes N ∗ ⊂ N with a path through them, i.e. a permutation < n∗π(1) , . . . , n∗π(l) >, such that the sum of weights along the path is: l−1 �
ω(e(n∗π(i) , n∗π(i+1) )) < Λ.
(13)
i=1
Problem 2 models the optimization problem of compressing as many as possible (i.e., l) fiber end-points in a COA
using a fixed storage (i.e., Λ). Hence, an optimal solution to Problem 2 is not necessarily an optimal solution to compressing COA’s point-subset because of the limitations of the adopted model. Problem 2 is NP-complete as it can be shown that the asymmetric traveling salesman problem, atsp, can be reduced to cps, atsp≤pm cps, via binary search for Λ [6]. In the remainder of this section, we present an efficient constructive heuristic A2, that aims at solving this problem. The premier design requirement for the heuristic is fast run-time performance because each COA must be signed separately at a manufacturing line. First, we show that the distance measure between two nodes in N does not obey the triangle inequality for all nodes. Intuitively, the encoding procedure from Subsection 3.1 encodes vectors in S − Si using a number of bits proportional to the likelihood that a certain unit is one of the two closest illuminated points. Hence, units farther from the source node are encoded with significantly longer codewords as they are unlikely to occur, which renders shortcuts to these nodes in the solution route highly undesirable. Theorem 2. The distance measure ω does not universally obey the triangle inequality: ω(e(u, v))+ω(e(v, w) ≥ ω(u, w). Proof. (sketch) For simplicity, lets assume that (∀u ⊂ S − Si ) t = τ (u) = const., then u, v, and w are positioned along the same line in S − Si . The Euclidean distances ||u − v||, ||v − w||, and ||u − w|| are a, b, and a + b respectively. The triangle inequality implies that f (u, v, w) = log2 [γ(w, u)] − log2 [γ(v, u)] − log2 [γ(w, v)] ≥ 0. From Eqns.10 and 11, we compute: f (a, b, t) =
2abπ log2 (1 − t) + log2 − log2
2
2
2
t 1−t
−
4 4
i
j
i
j
Concatenate pi = pi |q(i, j)|pj and remove pj from P . Find exhaustively a concatenation ph = p1 | . . . |pmaxP s.t. � M (ph ) � { e⊂p ω(e) < Λ and |ph | is maximal}. h reroute(ph ) reroute(ph ) pbest = ph for each edge e(si , di ) ⊂ ph , i = 1, . . . , |ph | − 1 for each node pair (di , sj ) ⊂ ph , j = i + 2, . . . , |ph | − 1. Find shortest path q(i, j) via nodes in N − ph . if path e1 , . . . , ei |q(i, j)|ej , . . . , e|ph | has a better metric M (ph ) then pbest then pbest = ph . Greedy Iterative Improvement repeat I times � Contract ph so that e⊂ph ω(e) ≤ ρΛ, where ρ is a contraction factor, randomly chosen from ρ ∈ {0.4, 0.8}. Denote� nodes n0 and nl as the first and last node in ph . while e⊂ph ω(e) ≤ Λ Among edges that have n0 or nl as destination or source respectively, find edge e with minimal weight. Concatenate e to ph . reroute(ph )
(14) 2 2
(1−t) +(a +b )πt(1−t)+a b π t 1+[(a+b)2 π−1]t
,
and show that for abπt � 1, the triangle inequality does not hold, i.e., f (a, b, t) < 0. The best approximation algorithm for atsp where the triangle inequality holds, yields solutions at most log(|N |) times worse than the optimal [5]. Alternatively, to the best knowledge of the authors, approximation algorithms for atsp variants where the triangle inequality does not hold, have not been developed. In the general case, when the distance metric function ω is arbitrary, the atsp problem is NPO-complete [14], i.e., there is no good approximation algorithm unless P = N P . On the other hand, approximation algorithms for variants of tsp which satisfy a scaled version of the triangle inequality: µ(ω(e(u, v)) + ω(e(v, w))) ≥ ω(u, w), µ > 1 can be solved with a worst case result (3µ + 1)µ/2 times worse than the optimal solution [1]. Our distance metric ω does not follow this constraint, hence, we chose to develop a heuristic for Problem 2 without a worst-case guarantee. In addition, we aim for as good as possible performance of the heuristic on the average, rather than a worst-case guarantee.6 The rationale behind using the distance metric ω from Subsection 3.1 is based on an assumption that a good solution succeeds to traverse each node on its route via the 6
Algorithm A2. Constructive phase Set of edges E � = {arg mine (ω(a, b), ω(b, a))|(∀a, b) ⊂ N }. Set of subpaths P is selected as a set of shortest K edges �K in E � s.t. i=1 ω(ei ) ≤ Λ sorted by ω. Denote the weight of the shortest edge in E as ωmin . for each path pi ⊂ P, i = 1..K − 1 for each path pj ⊂ P, j = i + 1..K if pi and pj have a common source-destination node Concatenate pi and pj as pi = pi |pj . Remove pj from P . Denote source and destination nodes of a path pi ⊂ P as si and di respectively. for each path pi ⊂ P, i = 1..K Find all shortest paths q(i, j) from si to any dj , j �= i. while |P | < maxP � ω(e) (pi , pj ) = arg minq(i,j) e⊂{p |q(i,j)|p } |{p |q(i,j)|p }| .
COA instance which cannot be compressed satisfactorily can be disposed. Likelihood of this event should be small, less than one in a million.
two closest neighboring nodes. Hence, in the scope of Problem 2, the used metric is optimal only if the best solution found satisfies this property. If the final solution does not have this property, the optimality of encoding a single vector is dependent upon the distribution of weights of the edges in the solution. Evaluating the mutual dependence of the encoding mechanism and edge distributions on the optimal route with respect to a given encoding mechanism is beyond the scope of this paper. The developed heuristic A2 has two stages: a constructive and an iterative improvement phase. The constructive phase follows a greedy heuristic which builds the initial solution. Initially, A2 identifies a set of dominating edges E � . For each pair of edges, e(u, v), e(v, u), between nodes u, v, A2 selects only the shorter of the two and stores it in E � . Next, a set P of initial subpaths is created by sorting the edges in E � and selecting the top K shortest edges whose weights sum up as close as possible to Λ. Lets denote the first and last node in a path pi as si and di respectively. In the next step, A2 concatenates subpaths from P iteratively in the increasing order of their weights: at any point, the pair of shortest subpaths pi , pj which have a common source-destination node di = sj , is concatenated until all possible connections are established. In the unlikely case when |P | = 1, we have found the optimal solution and stop the search, else, we remove from P all single-edge subpaths. Then, using Johnson’s algorithm [7], A2 finds all shortest paths between each destination tail di of each subpath pi in P and source tails of all other subpaths, sj , i = 1 . . . |P |, i �= j. The shortest paths are routed via nodes which are not in P . We denote
the shortest path between si and dj as q(i, j). In another greedy step, A2 sorts all concatenations pi |q(i, j)|pj according to their weight/node count ratio. In increasing order of this metric, A2 continues concatenating subpaths in P via nodes in N − P until the total number of remaining paths is |P | = maxP (usually maxP = 9). The remaining paths are concatenated using an exact algorithm which finds a path ph with the optimal metric: maximal cardinality and a sum of weights smaller than Λ. In the final step, a rerouting procedure browses all the nodes in P , and using Johnson’s algorithm tries to find shortest paths to other nodes in P via the remaining nodes in E. The same procedure also tries to find a better ending tail than the one that exists in ph . For each reroute, A2 checks whether the new reroute has a better metric than the current, best path ph . In the iterative improvement phase, we repeat several rounds of the following loop. In the first step, A2 contracts the currently best found path pbest into ph , so that |ph | is maximal and the sum of weights along ph is smaller than a fraction of ρΛ. The contraction parameter ρ is randomly selected in each iteration within ρ ∈ {0.4, 0.8}. We denote nodes n0 and nl as the first and last node in ph . While the sum of weights in ph is smaller than Λ, among edges that have n0 or nl as destination or source respectively, we find an edge e with minimal weight and concatenate it to ph . When the new candidate path ph is created, it is adopted as the best solution if its metric is better than the metric of the best path created so far. As a last step of the iterative improvement loop, A2 performs the rerouting procedure previously described. In order to fit the run-time of A2 for a specific class COA(L,R,K) within one second, the improvement loop is repeated I = {100, 10000} times. In general, the worst-time complexity of A2 is O(|N |2 log |N | + |N ||E|) as multi-source shortest paths are computed via Johnson’s algorithm [7]. Although the graph G is originally complete, by removing edges with high weights, we create a sparse graph, where Johnson’s algorithm performs particularly well.
4. EMPIRICAL EVALUATION In this section, we demonstrate the improvement in compression with respect to standard compression algorithms. First, using Figure 5 we illustrate a solution to a single instance of the problem, a COA(512,0.4 · 512,256). In all experiments, we set the scanning grid to L = 512 scanning cells. The figure depicts the case when the lower left quadrant of the COA is illuminated. Graph G(N, E), built using the corresponding illuminated fiber end-points, is illustrated with medium bold lines. We show only the top ten shortest edges starting from each of the κ = 88 nodes in the graph. The resulting path shown in the figure using bold lines, consists of 41 nodes. The sum of weights along path’s edges is smaller than the storage limit: Λ = 512 bits. The path is compressed using 12.11 bits per fiber end-point (bfep). Storing the data without compression would require 41·18 = 738 bits, which results in a compression ratio7 of 0.61. We compare the compression performance of the A2 algorithm with respect to an implementation of an arithmetic encoder (AC), particularly tailored to encode the distance vectors between illuminated fiber end-points. Note that stan7 We define a compression ratio as a ratio of the size of the compressed message vs. the original message size.
500
K fibers fiber end-points G→E G→N path ph
450
nodes of ph 400
350
300
250
200
150
100
50
50
100
150
200
250
300
350
400
450
500
Figure 5: COA(512,0.4·512,256) instance is shown with κ = 88 nodes. A2 returned the path illustrated with bold lines. The path is such that its sum of weights is smaller than Λ = 512. To document the path, we use 12.11 bits per point.
dard compression tools such as a Huffman coder, LempelZiv, Burrows-Wheeler transform based compressors, or prediction by partial matching, on the average perform onpar or worse than the proposed AC. The AC fills out the available Λ bits by traversing the nodes in N in the following way. First, it chooses a reference starting point nref = {0, L/2} �⊂ N . At any given currently visited node ni ⊂ N , the next node ni+1 ⊂ N is found which is at minimal distance from ni with respect to all remaining nonvisited nodes. The AC encodes the x and y components of each vector ni → ni+1 using ranges proportional to the currently observed statistic of their values (see Section 3.1.1). The statistic of the occurrence of a particular value along x or y is updated as new points are compressed. In the header of the compressed file, the encoder stores the maximal and minimal value along x and y that can be encoded. An alternative AC, would first measure the overall statistic, encode it in the header of the compressed file, and encode the nodes using an entropy coder. In our experiments, such an encoder has produced inferior results to AC, thus, we have decided to use AC as the reference compression mechanism. Tables 1 and 2 quantify the compression performance with respect to the original, non-compressed data (marked Or) and the performance of the reference AC coder (marked AC). The original points are encoded using 9 bits for each dimension (or 18bfep) as the resolution of the scanning grid is assumed at L = 512 in all experiments. The first table quantifies the improvement of A2 with respect to AC and Or in percent as dependent upon Λ and K as COA parameters with fixed R = 0.40L. The result: 1 − bfep(A2)/bfep(AC) or 1 − bfep(A2)/bfep(Or) = 1 − bfep(A2)/18, is averaged over 50 COA instances for each set of parameters. Function bfep() returns the number of bits per fiber end-point used while compressing the selected subset of illuminated fiber end-points. A2 performed 13.2 − 21.8% better than AC, while achieving compression rates of 0.526 − 0.762. We
K Λ 256 384 512 640 768 896 1024
192 AC 18.7 18.1 18.6 19.1 19.1 18.7 21.8
Or 33.3 30.5 29.2 27.8 25.8 24.0 23.8
A2 compression improvement in % w.r.t. 256 384 512 768 AC Or AC Or AC Or AC Or 16.8 35.9 19.7 39.3 18.9 41.7 19.7 45.0 16.2 33.6 17.9 37.5 19.9 39.9 17.1 43.4 17.7 32.0 18.1 36.0 18.3 38.7 17.0 42.4 19.7 31.1 16.5 35.0 18.1 37.8 15.9 41.5 20.1 30.2 16.1 34.5 16.8 37.0 15.0 41.0 19.5 29.0 18.8 34.0 17.3 36.5 13.6 40.5 18.3 27.0 20.1 33.3 18.1 36.2 13.2 40.0
1024 AC Or 20.6 47.4 17.5 46.0 16.3 45.1 15.0 44.3 15.7 43.8 14.4 43.3 13.2 42.9
Table 1: Compression performance comparison of A2, AC, and the non-compressed (Or) data for varying Λ, K and fixed R = 0.4L. The result: 1 − bfep(A2)/bfep(AC) or 1 − bfep(A2)/bfep(Or) = 1 − bfep(A2)/18, is averaged over 50 COA instances for each set of parameters. Function bfep() returns the number of bits used to document a fiber end-point in the compressed Λ-bit message.
R K 192 256 384 512 768 1024
A2 0.25L AC Or 20.8 25.5 20.3 27.9 21.2 33.3 18.6 36.2 17.2 40.3 15.4 43.2
compression improvement in 0.30L 0.35L AC Or AC Or 22.1 25.8 21.6 28.0 21.2 29.7 18.7 31.3 19.3 33.7 17.5 35.1 16.0 36.4 18.2 37.8 16.6 40.7 14.4 41.7 16.9 43.7 14.1 44.4
% w.r.t. 0.40L AC Or 18.6 29.2 17.7 32.0 18.1 36.0 18.3 38.7 17.0 42.4 16.3 45.0
0.45L AC Or 17.1 29.9 18.0 32.7 17.5 36.7 16.4 39.3 17.1 42.9 15.1 45.3
Table 2: Compression performance comparison of A2, AC, and the non-compressed (Or) data for varying K, R and fixed Λ = 512 bits.
observed that the results obtained from the AC had significantly higher variance than the results obtained from A2. Similarly, Table 2 quantifies the improvement of A2 with respect to AC and Or in percent as dependent upon R and K as COA parameters with fixed Λ = 512. The corresponding results are averaged over 50 COA instances for each set of parameters. In this range of parameters, A2 performed 14.1−22.1% better than AC, while achieving average compression rates of 0.547 − 0.745. From Theorem 1, the compression improvements that A2 achieves, reflect exponentially on the cost of forging a particular COA instance.
5. LIMITING ADVERSARIAL TRIALS We optimize system performance by limiting the number of trials available to the adversary for accurate positioning of a sufficient subset of the signed fiber end-points. Consider a compression scheme C which stores G out of the κ illuminated fiber end-points in a Λ-limited storage. In general, when forging a COA, the adversary can use all κ fibers to try to place at least Gζ of them accurately at their corresponding locations. In Subsection 1.3, we have demonstrated that cost of forging a COA greatly depends upon the number of available trials. Here, we propose a technique which aims at reducing the number of adversarial trials, KT , by detecting anomalous distribution of fibers around the signed fiber end-points during verification. The COA issuer and verifier repeat their parts of the algorithm A3 for each COA quadrant Si . The issuer initially scans the COA instance and collects information about the set of points N which illuminate when Si is lit up. Next, using the available Λ bits, it compresses the largest subset P ⊂ N , |P | = G returned by A2. Then, A3 finds a subset U ⊂ S − Si , such that the Euclidean distance between each unit ui ∈ U and its closest unit pj ∈ P is at most C1 . Subset U of units represents an C1 -neighborhood of P . Then, the issuer counts the number KT of points in N that
Algorithm A3. Issuing a COA Instance Scan for a set N of κ points, illuminated when light is shed on Si . Using Λ bits, compress P ⊂ N , with G = |P | ≤ κ. Find a subset of units U ⊂ S − Si , such that (∀ui ∈ U )(∀pj ∈ P ) min(||ui − pj ||) < C1 . C2 = |N ∩ U | − G, KT = G + C2 . Sign P, C2 and the associated information. Verifying a COA Instance Extract P, ε2 from signature. Find a subset of units U ⊂ S − Si , such that (∀ui ∈ U )(∀pj ∈ P ) min(||ui − pj ||) < C1 . Scan for a set N � of κ� points, illuminated when light is shed on Si . if |N � ∩ U | > KT then COA instance is invalid, elseif |N � ∩ P | ≥ Gζ then COA instance is valid, else COA instance is invalid.
exist in U . Since, KT has to be greater than G to prevent false negatives, the issuer stores along with P , the difference C2 = KT − G in the message m, which is later signed using the private key of the issuer. Using the public key of the issuer, the COA verifier extracts from the attached signature the compressed point subset P and C2 and recreates the corresponding C1 -neighborhood, U . Then, the verifier scans the COA instance for the set of illuminated fibers N � when Si is lit up. It announces that the instance is authentic by checking that the number of common points in U and N � is at most G + C2 and that the number of common points in N � and P is at least Gζ. By storing C2 in the signature, we impose upon the adversary to use at most KT = G+C2 trials that position fibers in the C1 -neighborhood of P . The adversary’s goal is to place at least Gζ fiber end-points from P accurately, hence, the
adversary can afford G(1 − ζ) + C2 misplacements located in the C1 -neighborhood of P during the forgery process. It is expected that each trial, targeting a point pi , if unsuccessful, ends up in the C1 -neighborhood of pi . By increasing C1 , the COA verifier can identify possible misplacements over a larger neighborhood; however, this also increases the expectation for C2 - a value that the COA designer wants to keep as low as possible.
6. ERROR PROBABILITIES The primary goal of designing a COA system is enforcing expensive forging. A secondary goal, significantly easier to fulfill, is to achieve satisfactory error probabilities in the system. There are three error probabilities that are of concern: misdetection εM D , false positive εF P , and collision εC . Probability of misdetecting a COA instance is based on the accuracy of the verification hardware and the wear-and-tear characteristics of the materials used to manufacture COAs. In general, by allowing a certain number G(1 − ζ) of endpoint misreads, the designer of a COA system can keep this performance metric within desired levels. We denote the number of end-points compressed and encoded in COA’s barcode as G. Assuming a probability p of misreading a single fiber end-point, the misdetection probability εM D for the entire COA equals: G(1−ζ)
εM D =
� i=0
� � G G−i (1 − p)i , p i
(15)
The probability of a false positive εF P corresponds to the probability that a forged COA(L,R,K) has at least Gζ out of G fiber end-points in the same position as the set of G compressed end-points of a given valid COA instance. From Lemma 1, this probability equals εF P = χ−1 . It is proportional to the probability ν that the adversary makes an error while placing a fiber end-point at a given location in the COA. An asymmetric collision of two COA(L,R,K) instances is an event where for a given COA instance c1 and its subset e1 of G = |e1 | compressed fiber end-points, another COA instance c2 with the same set of parameters has at least Gζ fiber end-points at positions equivalent to e1 . The probability p1,2 that c2 has a subset of at least Gζ end-points from e1 illuminated under the same conditions, equals: G(1−ζ)
p1,2 =
� i=0
�
�
τ (uj ),
(16)
ex ⊂e1 (G−i) ∀uj ∈ex
� G � subsets of where e1 (G − i) denotes the set of all G−i G − i end-points from ei and τ is defined as in Eqn.9 and depends upon K. According to the birthday paradox, the probability of collision of at least two within a set of J COA instances, is bound by: εC ≤ P2 (p−1 1,2 , 2J) (proof omitted), where P2 (m, n) is defined as [8]: P2 (m, n) = 1 −
m(m − 1)(m − 2) . . . (m − n + 1) . mn
(17)
With typical COA parameters (L = 512, K ≥ 200, G ≥ 200, R ∈ {0.05, 0.45}L, ζ ≥ 0.8), εC and εM D are kept at safe values (e.g., < 10−20 ). This sways the focus of the COA
designer onto setting the parameters of the COA system so that the economic viability of the system is maximized given a certain manufacturing precision ν of the adversary (see Subsection 1.3).
7.
CONCLUSION
Donald Bauder was the first to propose COAs created as a randomized augmentation of a set of fixed-length fibers into a transparent gluing material that fixes once for all the position of the fibers within. In this paper, we show that the cost of forging a given fiber-based COA instance is exponentially proportional to the improvement in compression. Next, we formally define the compression objective for a fiber-based COA system, show that its optimal solution is NP-complete, and propose a heuristic that improves the compression rate 13-23% with respect to standard compression methods.
Acknowledgements The author would like to thank Yuqun Chen, Gary Starkweather, Yacov Yacobi, and Gideon Yuval, all from Microsoft Research, on helpful comments and discussions that have improved the contents of this paper.
REFERENCES [1] T. Andreae and H. Bandelt. Performance guarantees for approximation algorithms depending on parametrized triangle inequalities. SIAM Journal of Discrete Mathematics, Vol.8, pp.1–16, 1995. [2] D.W. Bauder. Personal Communication. [3] D.W. Bauder. An Anti-Counterfeiting Concept for Currency Systems. Research report PTK-11990. Sandia National Labs. Albuquerque, NM, 1983. [4] S. Church and D. Littman. Machine reading of Visual Counterfeit Deterrent Features and Summary of US Research, 1980-90. Four Nation Group on Advanced Counterfeit Deterrence, Ottawa, Canada, Septemeber 1991. [5] A.M. Frieze, G. Galbiati, and F. Maffioli. On the worst-case performance of some algorithms for the asymmetric traveling salesman problem. Networks, Vol.12, no.1, pp.23–39, 1982. [6] M.R. Garey and D.S. Johnson. Computers and Intractability. San Francisco, CA: Freeman, 1979. [7] D.B. Johnson. Efficient algorithms for shortest paths in sparse networks. Journal of the ACM, Vol.24, no.1, pp.1–13, 1977. [8] A.J. Menezes, P.C. Van Oorschot, and S.A. Vanstone. Handbook of Applied Cryptography. CRC Press, 1996. [9] Commission on Engineering and Technical Systems (CETS). Counterfeit Deterrent Features for the Next-Generation Currency Design. The National Academic Press, 1993. [10] R. Pappu. Physical One-Way Functions. Ph.D. Thesis, MIT, 2001. [11] J. Rissanen. Modeling by Shortest Data Description. Automatica, Vol.14, pp.465–471, 1978. [12] R. L. Rivest, A. Shamir, and L. A. Adleman. A method for obtaining digital signatures and public-key cryptosystems. Communications of the ACM, vol.21, no.2, pp.120–126, 1978. [13] C.E. Shannon. Prediction and entropy of printed English. Bell Systems Technical Journal, pp.50–64, 1951. [14] V.V. Vazirani. Approximation Algorithms. Springer, 2001. [15] I.H. Witten, A. Moffat, and T.C. Bell. Managing gigabytes: compressing and indexing documents and images. Morgan-Kaufmann, 1999. [16] Y. Desmedt and A. Odlyzko. A Chosen Text Attack on the RSA Cryptosystem and Some Discrete Logarithm Schemes. CRYPTO, Springer-Verlag, pp.516–522, 1985. [17] D. Bleichenbacher. Chosen Ciphertext Attacks Against Protocols Based on the RSA Encryption Standard PKCS #1. CRYPTO, Springer-Verlag, pp.1–12, 1998. [18] J.-S. Coron, D. Naccache, and J.P. Stern. A New Signature Forgery Strategy. CRYPTO, Springer-Verlag, pp.1–18, 1999. [19] M. Bellare and P. Rogaway. The exact security of digital signatures: how to sign with RSA and Rabin. EUROCRYPT, Springer-Verlag, pp.399–414, 1996.