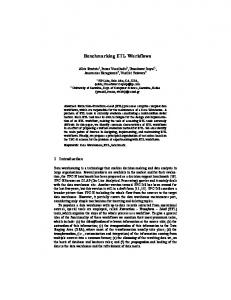
that a plethora of ETL tools currently constitutes a multi-million dollars market. ... a
principled organization of test suites for the problem of experimenting with ETL ...
Towards a Benchmark for ETL Workflows Panos Vassiliadis
Anastasios Karagiannis
Vasiliki Tziovara
Alkis Simitsis
Dept. of Computer Science, Univ. of Ioannina Ioannina, Hellas
IBM Almaden Research Center San Jose, California, USA
{pvassil, ktasos, vickit}@cs.uoi.gr
[email protected]
ABSTRACT Extraction–Transform–Load (ETL) processes comprise complex data workflows, which are responsible for the maintenance of a Data Warehouse. Their practical importance is denoted by the fact that a plethora of ETL tools currently constitutes a multi-million dollars market. However, each one of them follows a different design and modeling technique and internal language. So far, the research community has not agreed upon the basic characteristics of ETL tools. Hence, there is a necessity for a unified way to assess ETL workflows. In this paper, we investigate the main characteristics and peculiarities of ETL processes and we propose a principled organization of test suites for the problem of experimenting with ETL scenarios.
1. INTRODUCTION Data Warehouses (DW) are collections of data coming from different sources, used mostly to support decision-making and data analysis in an organization. To populate a data warehouse with up-to-date records that are extracted from the sources, special tools are employed, called Extraction – Transform – Load (ETL) tools, which organize the steps of the whole process as a workflow. To give a general idea of the functionality of these workflows we mention their most prominent tasks, which include: (a) the identification of relevant information at the source side; (b) the extraction of this information; (c) the transportation of this information to the Data Staging Area (DSA), where most of the transformation usually take place; (d) the transformation, (i.e., customization and integration) of the information coming from multiple sources into a common format; (e) the cleansing of the resulting data set, on the basis of database and business rules; and (f) the propagation and loading of the data to the data warehouse and the refreshment of data marts. Due to their importance and complexity (see [1, 12] for relevant discussions and case studies), ETL tools constitute a multi-million market. There is a plethora of commercial ETL tools available. The traditional database vendors provide ETL solutions built in the DBMS’s: IBM with WebSphere DataStage [5], Microsoft with SQL Server 2005 Integration Services (SSIS) [7], and Oracle with Oracle Warehouse Builder [8]. There also exist independent vendors that cover a large part of the market (e.g., Informatica with Powercenter 8 [6]). Nevertheless, an in-house development of the ETL workflow is preferred in many data warehouse Permission to copy without fee all or part of this material is granted provided that the copies are not made or distributed for direct commercial advantage, the VLDB copyright notice and the title of the publication and its date appear, and notice is given that copying is by permission of the Very Large Database Endowment. To copy otherwise, or to republish, to post on servers or to redistribute to lists, requires a fee and/or special permissions from the publisher, ACM. VLDB ’07, September 23-28, 2007, Vienna, Austria. Copyright 2007 VLDB Endowment, ACM 978-1-59593-649-3/07/09.
projects, due to the significant cost of purchasing and maintaining an ETL tool. The spread of existing solutions comes with a major drawback. Each one of them follows a different design approach, offers a different set of transformations, and provides a different internal language to represent essentially similar necessities. The research community has only recently started to work on problems related to ETL tools. There have been several efforts towards (a) modeling tasks and the automation of the design process, (b) individual operations (with duplicate detection being the area with most of the research activity) and (c) some first results towards the optimization of the ETL workflow as a whole (as opposed to optimal algorithms for their individual components). For lack of space, we refer the interested reader to [11] for a detailed survey on research efforts in the area of ETL tools and to [14] for a survey on duplicate detection. The wide spread of industrial and ad-hoc solutions combined with the absence of a mature body of knowledge from the research community is responsible for the absence of a principled foundation of the fundamental characteristics of ETL workflows and their management. Here is a small list of shortages concerning these fundamental characteristics: no principled taxonomy of individual activities is present, few research efforts have been made towards the optimization of ETL workflows as a whole, and, practical problems like the recovery from failures have mostly been ignored. To add a personal touch to this landscape, in various occasions during our research, we have faced the problem of constructing ETL suites and varying several parameters of them; unfortunately, there is no commonly agreed benchmark for ETL workflows. Thus, a commonly agreed, realistic framework for experimentation is also absent. In this paper, we take a step towards this latter issue. Our goal is to provide a principled categorization of test suites for the problem of experimenting with a broad range of ETL workflows. First, we provide a principled way for constructing ETL workflows. We identify the main functionality provided by representative commercial ETL tools and we categorize the most frequent ETL operations into abstract logical activities. Based on that, we propose a categorization of ETL workflows, which covers frequent design cases. Then, we describe the main configuration parameters and a set of crucial measures to be monitored in order to capture the generic functionality of ETL tools. Also, we discuss how different parallelism techniques may affect the execution of ETL processes. Finally, we provide a set of specific ETL scenarios based on the aforementioned analysis, which can be used as an experimental testbed for the evaluation of ETL methods or tools. Contributions. Our main contributions are as follows: − A principled way of constructing ETL workflows based on an abstract categorization of frequently used ETL operations.
− The provision of a set of measures and parameters, which are crucial for the efficient execution of an ETL workflow.
− Each recordset r is a pair (r.name, r.schema), with the schema being a finite list of attribute names.
− A principled organization of test suites for the problem of experimenting with ETL scenarios.
− Each activity a is a tuple (N,I,O,S,A). N is the activity’s name. I is a finite set of input schemata. O is a finite set of output schemata. S is a declarative description of the relationship of its output schema with its input schema in an appropriate language (without delving into algorithmic or implementation issues). A is the algorithm chosen for activity’s execution.
Outline. In Section 2, we discuss the nature and structure of ETL activities and workflows, and provide a principled way for constructing the latter. In Section 3, we present the main measures to be assessed by a benchmark and the basic problem parameters that should be considered for the case of ETL workflows. In Section 4, we give specific scenarios that could be used as a test suite for the evaluation of ETL scenarios. In section 5, we discuss issues that are left open and mention some parameters that require further tuning when constructing test suites. In Section 6, we discuss related work and finally, in Section 7, we summarize our results and propose issues of future work.
2. Problem Formulation In this section, we introduce ETL workflows along with their constituents and internal structure and discuss the way ETL workflows operate. First, we start with a formal definition and an intuitive discussion of ETL workflows as graphs. Then, we zoom in the micro-level of ETL workflows inspecting each individual activity in isolation and afterwards, and then, we return at the macro-level, inspecting how individual activities are “tied” altogether to compose an ETL workflow. Both levels can be further examined from a logical or physical perspective. The final section of this section discusses the characteristics of the operation of ETL workflows and ties them to the goals of the proposed benchmark. An ETL workflow at the logical level is a design blueprint for the ETL process. The designer constructs a workflow of activities, usually in the form of a graph, to specify the order of cleansing and transformation operations that should be applied to the source data, before being loaded to the data warehouse. In what follows, we will employ the term recordsets to refer to any data store that obeys a schema (with relational tables and record files being the most popular kinds of recordsets in the ETL environment), and the term activity to refer to any software module that processes the incoming data, either by performing any schema transformation over the data or by applying data cleansing procedures. Activities and recordsets are logical abstractions of physical entities. At the logical level, we are interested in their schemata, semantics, and input-output relationships; however, we do not deal with the actual algorithm or program that implements the logical activity or with the storage properties of a recordset. When in a later stage, the logical-level workflow is refined at the physical level a combination of executable programs/scripts that perform the ETL workflow is devised. Then, each activity of the workflow is physically implemented using various algorithmic methods, each with different cost in terms of time requirements or system resources (e.g., CPU, memory, space on disk, and disk I/O). Formally, we model an ETL workflow as a directed acyclic graph G(V,E). Each node v∈V is either an activity a or a recordset r. An edge (a,b)∈E denotes that b receives data from node a for further processing. In this provider relationship, nodes a and b play the role of the data provider and data consumer, respectively. The following well-formedness constraints determine the interconnection of nodes in ETL workflows:
− The data consumer of a recordset cannot be another recordset. Still, more than one consumer is allowed for recordsets. − Each activity must have at least one provider, either another activity or a recordset. When an activity has more than one data providers, these providers can be other activities or activities combined with recordsets. − Feedback of data is not allowed; i.e., the data consumer of an activity cannot be the same activity.
2.1 Micro-level activities Concerning the micro level, we consider three broad categories of ETL activities: (a) extraction activities, (b) transformation and cleansing activities, and (c) loading activities. Extraction activities extract the relevant data from the sources and transport them to the ETL area of the warehouse for further processing (possibly including operations like ftp, compress, etc). The extraction involves either differential data sets with respect to the previous load, or full snapshots of the source. Loading activities have to deal with the population of the warehouse with clean and appropriately transformed data. This is typically done through a bulk loader program; nevertheless the process also includes the maintenance of indexes, materialized views, reports, etc. Transformation and cleansing activities can be coarsely categorized with respect to the result of their application to data and the prerequisites, which some of them should fulfill. In this context, we discriminate the following categories of operations: − Row-level operations, which are locally applied to a single row. − Router operations, which locally decide, for each row, which of the many (output) destinations it should be sent to. − Unary Grouper operations, which transform a set of rows to a single row. − Unary Holistic operations, which perform a transformation to the entire data set. These are usually blocking operations. − Binary or N-ary operations, which combine many inputs into one output. A taxonomy of activities at the micro level is depicted in Table A1 (in the appendix). For each one of the above categories, a representative set of transformations, which are provided by three popular commercial ETL tools, is presented. The table is indicative and in many ways incomplete. The goal is not to provide a comparison among the three tools. On the contrary, we would like to stress out the genericity of our classification. For most of the ETL tools, the set of built-in transformations is enriched by user defined operations and a plethora of functions. Still, as Table A1 shows, all frequently built-in transformations in the majority of commercial solutions fall into our classification.
Left wing
populate a warehouse table along with several views or reports defined over it. Figure 2 is an example of this class of butterflies. This variant represents a symmetric workflow (there is symmetry between the left and right wings). However, this is not always the practice in real-world cases. For instance, the butterfly’s triangle wings are distorted in the presence of a router activity that involves multiple outputs (e.g., copy, splitter, switch, and so on). In general, the two fundamental wing components can be either lines or combinations. In the sequel, we discuss these basic patterns for ETL workflows that can be further used to construct more complex butterfly structures. Figure 3 pictorially depicts example cases of the above variants.
Right wing
Body
n1
n1
n2
n2
V
nk
nm
Figure 1. Abstract butterfly components 100000
R
p 1=0.003
S
γA,Β
σA300 sel 2 =0.1 p 2=0.004
W
γA sel 5=0.5 p 5 =0.005
Figure 2. Butterfly configuration
2.2 Macro level workflows The macro level deals with the way individual activities and recordsets are combined together in a large workflow. The possibilities of such combinations are infinite. Nevertheless, our experience suggests that most ETL workflows follow several high-level patterns, which we present in a principled fashion in this section. We introduce a broad category of workflows, called Butterflies. A butterfly (see also Figure 1) is an ETL workflow that consists of three distinct components: (a) the left wing, (b) the body, and (c) the right wing of the butterfly. The left and right wings (shown with dashed lines in Figure 1) are two nonoverlapping groups of nodes which are attached to the body of the butterfly. Specifically: − The left wing of the butterfly includes one or more sources, activities and auxiliary data stores used to store intermediate results. This part of the butterfly performs the extraction, cleaning and transformation part of the workflow and loads the processed data to the body of the butterfly. − The body of the butterfly is a central, detailed point of persistence that is populated with the data produced by the left wing. Typically, the body is a detailed fact or dimension table; still, other variants are also possible. − The right wing gets the data stored at the body and utilizes them to support reporting and analysis activity. The right wing consists of materialized views, reports, spreadsheets, as well as the activities that populate them. In our setting, we abstract all the aforementioned static artifacts as materialized views. Assume the small ETL workflow of Figure 2 with 10 nodes. R and S are source tables providing 100,000 tuples each to the activities of the workflow. These activities apply transformations to the source data. Recordset V is a fact table and recordsets Z and W are Target tables. This ETL scenario is a butterfly with respect to the fact table V. The left wing of the butterfly is {R, S, 1, 2, 3} and the right wing is {4, 5, Z, W}. Balanced Butterflies. A butterfly that includes medium-sized left and right wings is called a Balanced butterfly and stands for a typical ETL scenario where incoming source data are merged to
Lines. Lines are sequences of activities and recordsets such that all activities have exactly one input (unary activities) and one output. In these workflows, nodes form a single data flow. Combinations. A combinator activity is a join variant (a binary activity) that merges parallel data flows through some variant of a join (e.g., a relational join, diff, merge, lookup or any similar operation) or a union (e.g., the overall sorting of two independently sorted recordsets). A combination is built around a combinator with lines or other combinations as its inputs. We differentiate combinations as left-wing and right-wing combinations. Left-wing combinations are constructed by lines and combinations forming the left wing of the butterfly. The left wing contains at least one combination. The inputs of the combination can be: − Two lines. Two parallel data flows are unified into a single flow using a combination. These workflows are shaped like the letter ‘Y’ and we call them Wishbones. − A line and a recordset. This refers to the practical case where data are processed through a line of operations, some of which require a lookup to persistent relations. In this setting, the Primary Flow of data is the line part of the workflow. − Two or more combinations. The recursive usage of combinations leads to many parallel data flows. These workflows are called Trees. Observe that in the cases of trees and primary flows, the target warehouse acts as the body of the butterfly (i.e., there is no right wing). This is a quite practical situation that covers (a) fact tables without materialized views and (b) the case of dimension tables that also need to be populated through an ETL workflow. There are some cases, too, where the body of the butterfly is not necessarily a recordset, but an activity with many outputs (see last example of Figure 5). In these cases, the main goal of the scenario is to distribute data to the appropriate flows; this task is performed by an activity serving as the butterfly’s body. Right-wing combinations are constructed by lines and combinations on the right wing of the butterfly. These lines and combinations form either a flat or a deep hierarchy. − Flat Hierarchies. These configurations have small depth (usually 2) and large fan-out. An example of such a workflow is a Fork, where data are propagated from the fact table to the materialized views in two or more parallel data flows. − Right - Deep Hierarchies. To handle all possible cases, we employ configurations with right-deep hierarchies. These configurations have significant depth and medium fan-out.
R
1
2
σA>300
σB>400
3
V
γA,B
W
(a) Linear Workflow
(b) Wishbone
(c) Primary Flow
(d) Tree
(e) Flat Hierarchy – Fork
(f) Right - Deep Hierarchy Figure 3. Butterfly classes
2.3 Goals of the benchmark The design of a benchmark should be based upon a clear understanding of the characteristics of the inspected systems that do matter. Our fundamental motivation for coming up with the proposed benchmark was due to the complete absence of a principled way to experiment with ETL workflows in the related literature. Therefore, we propose a configuration that covers a broad range of possible workflows (i.e., a large set of configurable parameters) and a limited set of monitored measures. The goal of this benchmark is to provide the experimental testbed to be used for the assessment of ETL methods or tools concerning their basic behavioral properties (measures) over a broad range of ETL workflows. The benchmark’s goal is to study and evaluate workflows as a whole. We are not interested in providing specialized performance measures for very specific tasks in the overall process. We are not interested either, in exhaustively enumerating all the possible alternatives for specific operations. For example, this benchmark is not intended to facilitate the comparison of alternative methods for the detection of duplicates in a data set, since it does not take the tuning of all the possible parameters for this task into consideration. On the contrary, this benchmark can be used for the assessment of the integration of such methods in complex ETL workflows, assuming that all the necessary knobs and bolts have been appropriately tuned. There are two modes of operation for an ETL workflow. In the traditional off-line mode, the workflow is executed during a specific time window of some hours (typically at night), when the systems are not servicing their end-users. Due to the low load of both the source systems and the warehouse, both the refreshment of data and any other administrative activities (cleanups, auditing, etc) are easier to complete. In the active
mode, the sources continuously try to send new data to the warehouse. This is not necessarily done instantly; rather, small groups of data are collected and sent to the warehouse for further processing. The difference of the two modes does not only lie in the frequency of the workflow execution, but also to the load of the systems whenever the ETL workflow executes. Independently of the mode under which the ETL workflow operates, the two fundamental goals that should be reached are effectiveness and efficiency. Hence, given an ETL engine or a specific experimental method to be assessed over one or more ETL workflows, these fundamental goals should be evaluated. To organize the benchmark better, we classify the assessment of the aforementioned goals through the following questions: Effectiveness Q1. Does the workflow execution reach the maximum possible (or, at least, the minimum tolerable) level of data freshness, completeness and consistency in the warehouse within the necessary time (or resource) constraints? Q2. Is the workflow execution resilient to occasional failures? Efficiency Q3. How fast is the workflow executed? Q4. What resource overheads does the workflow incur at the source and the warehouse side? In the sequel, we elaborate on these questions. Effectiveness. The objective is to have data respect both database and business rules. A clear business rule is the need to have as fresh data as possible in the warehouse. Also, we need all of the source data to be eventually loaded at the warehouse – not necessarily immediately as they appear at the source side – nevertheless, the sources and the warehouse must be consistent
at least at a certain frequency (e.g., at the end of a day). Subproblems that occur in this larger framework: − Recovery from failures. If some data are lost from the ETL process due to failures, then, we need to synchronize sources and warehouse and compensate the missing data. − Missing changes at the source. Depending on what kind of change detector we have at the source, it is possible that some changes are lost (e.g., if we have a log sniffer, bulk updates not passing from the log file are lost). Also, in an active warehouse, if the active ETL engine needs to shed some incoming data in order to be able to process the rest of the incoming data stream successfully, it is imperative that these left-over tuples need to be processed later. − Transactions. Depending on the source sniffer (e.g., a trigger -based sniffer), tuples from aborted transactions may be sent to the warehouse and, therefore, they must be undone. Minimal overheads at the sources and the warehouse. The production systems are under continuous load due to the large number of OLTP transactions performed simultaneously. The warehouse system supports a large number of readers executing client applications or decision support queries. In the offline ETL, the overheads incurred are of rather secondary importance, in the sense that the contention with such processes is practically non-existent. Still, in active warehousing, the contention is clear. − Minimal overhead of the source systems. It is imperative to impose the minimum additional workload to the source, in the presence of OLTP transactions. − Minimal overhead of the DW system. As writer processes populate the warehouse with new data and reader processes ask data from the warehouse, the desideratum is that the warehouse operates with the lightest possible footprints for such processes as well as the minimum possible delay for incoming tuples and user queries.
3. Problem Parameters In this section, we propose a set of configuration parameters along with a set of measures to be monitored in order to assess the fulfillment of the aforementioned goals of the benchmark. Experimental parameters. Given the previous description of ETL workflows, the following problem parameters, appear to be of particular importance to the measurement: P1. the size of the workflow (i.e., the number of nodes contained in the graph), P2. the structure of the workflow (i.e., the variation of the nature of the involved nodes and their interconnection as the workflow graph) P3. the size of input data originating from the sources, P4. the overall selectivity of the workflow, based on the selectivities of the activities of the workflow, P5. the values of probabilities of failure. Measured Effects. For each set of experimental measurement, certain measures need to be assessed, in order to characterize the fulfillment of the aforementioned goals. In the sequel, we classify these measures according to the assessment question they are employed to answer.
Q1. Measures for data freshness and data consistency. The objective is to have data respect both database and business rules. Also, we need data to be consistent with respect to the source as much as possible. The later possibly incurs a certain time window for achieving this goal (e.g., once a day), in order to accommodate high refresh rates in the case of active data warehouses or failures in the general case. Concrete measures: − (M1.1) Percentage of data that violate business rules. − (M1.2) Percentage of data that should be present at their appropriate warehouse targets, but they are not. Q2. Measures for the resilience to failures. The main idea is to perform a set of workflow executions that are intentionally abnormally interrupted at different stages of their execution. The objective is to discover how many of these workflows were successfully compensated within the specified time constraints. Concrete measures: − (M2) Percentage of successfully resumed workflow executions. Q3. Measures for the speed of the overall process. The objective is to perform the ETL process as fast as possible. In the case of off-line loading, the objective is to complete the process within the specified time-window. Naturally, the faster this is performed the better (especially, in the context of failure resumption). In the case of active warehouse, where the ETL process is performed very frequently, the objective is to minimize the time that each tuple spends inside the ETL module. Concrete measures: − (M3.1) Throughput of regular workflow execution (this may also be measured as total completion time). − (M3.2) Throughput of workflow execution including a specific percentage of failures and their resumption. − (M3.3) Average latency per tuple in regular execution. Q4. Measured Overheads. The overheads at the source and the warehouse can be measured in terms of consumed memory and latency with respect to regular operation. Concrete measures: − (M4.1) Min/Max/Avg/ timeline of memory consumed by the ETL process at the source system. − (M4.2) Time needed to complete the processing of a certain number of OLTP transactions in the presence (as opposed to the absence) of ETL software at the source, in regular source operation. − (M4.3) The same as 4.2, but in the case of source failure, where ETL tasks are to be performed too, concerning the recovered data. − (M4.4) Min/Max/Avg/ timeline of memory consumed by the ETL process at the warehouse system. − (M4.5) (active warehousing) Time needed to complete the processing of a certain number of decision support queries in the presence (as opposed to the absence) of ETL software at the warehouse, in regular operation. − (M4.6) The same as M4.5, but in the case of any (source or warehouse) failure, where ETL tasks are to be performed too at the warehouse side.
4. SPECIFIC SCENARIOS A particular problem that arises in designing a test suite for ETL workflows concerns the complexity (structure and size) of the employed workflows. The first possible way to deal with the problem is to construct a workflow generator, based on the aforementioned disciplines. The second possible way is to come up with an indicative set of ETL workflows that serve as the basis for experimentations. Clearly, the first path is feasible; nevertheless it is quite hard to artificially produce large volumes of workflows in different sizes and complexities all of which make sense. In this paper, we follow the second approach. We discuss an exemplary set of sources and warehouse based on the TPC-H benchmark [13] and we propose specific ETL scenarios for this setting.
4.1 Database Schema The information kept in the warehouse concerns parts and their suppliers as well as orders that customers have along with some demographic data for the customers. The scenarios used in the experiments clean and transform the source data into the desired warehouse schema. The sources for our experiments are of two kinds, the storage houses and sales points. Every storage house keeps data for the suppliers and parts, while every sales point keeps data for the customers and the orders. The schemata of the sources and the data warehouse are depicted in Figure 4.
Data Warehouse: PART (rkey s_partkey, name, mfgr, brand, type, size, container, comment) SUPPLIER (s_suppkey, name, address, nationkey, phone, acctbal, comment, totalcost) PARTSUPP (s_partkey, s_suppkey, availqty, supplycost, comment) CUSTOMER (s_custkey, name, address, nationkey, phone, acctball, mktsegment, comment) ORDER (s_orderkey, custkey, orderstatus, totalprice, orderdate, orderpriority, clerk, shippriority, comment) LINEITEM (s_orderkey, partkey, suppkey, linenumber, quantity, extendedprice, discount, tax, returnflag, linestatus, shipdate, commitdate, receiptdate, shipinstruct, shipmode, comment, profit) Storage House: PART (partkey, name, mfgr, brand, type, size, container, comment) SUPPLIER (suppkey, name, address, nationkey, phone, acctbal, comment) PARTSUPP (partkey, suppkey, availqty, supplycost, comment) Sales Point: CUSTOMER (custkey, name, address, nationkey, phone, acctball, mktsegment, comment) ORDER (orderkey, custkey, orderstatus, totalprice, orderdate, orderpriority, clerk, shippriority, comment) LINEITEM (orderkey, partkey, suppkey, linenumber, quantity, extendedprice, discount, tax, returnflag, linestatus, shipdate, commitdate, receiptdate, shipinstruct, shipmode, comment) Figure 4. Database schemata
4.2 ETL Scenarios In this subsection, we propose a set of ETL scenarios, which are depicted in Figure 5, while some statistics are shown in Table 1. We consider the butterfly cases discussed in section 2 to be representative of a large number of ETL scenarios and thus, we
propose a specific scenario for each kind. We provide only small-size scenarios indicatively (thus, a right-deep scenario is not given); the rigorous definition of medium and large size scenarios is still open. The line workflow has a simple form since it applies a set of filters, transformations, and aggregations to a single table. This scenario type is used to filter source tables and assure that the data meet the logical constraints of the data warehouse. In the proposed scenario, we start with an extracted set of new source rows LineItem.D+ and push them towards the warehouse as follows: 1. First, we check the fields "partkey", "orderkey" and "suppkey" for NULL values. Any NULL values are replaced by appropriate special values. 2. Next, a calculation of a value "profit" takes place. This value is locally derived from other fields in a tuple as the amount of "extendedprice" subtracted by the values of the "tax" and "discount" fields. 3. The third activity changes the fields "extendedprice", "tax", "discount" and "profit" to a different currency. 4. The results of this operation are loaded first into a delta table DW.D+ and subsequently into the data warehouse DWH. The first load simply replaces the respective recordset, whereas the second involves the incremental appending of these rows to the warehouse. 5. The workflow is not stopped after the completion of the left wing, since we would like to create some materialized views. The next operation is a filter that keeps only records whose return status is "False". 6. Next, an aggregation calculates the sum of "extendedprice" and "profit" fields grouped by "partkey" and "linestatus". 7. The results of the aggregation are loaded in view View01 by (a) updating existing rows and (b) inserting new groups wherever appropriate. 8. The next activity is a router, sending the rows of view View01 to one of its two outputs, depending on the "linestatus" field has the value "delivered" or not. 9. The rows with value “delivered” are further aggregated for the sum of "profit" and "extendedprice" fields grouped by "partkey". 10. The results are loaded in view View02 as in the case for view View01. 11. The rows with value different than “delivered” are further aggregated for the sum of "profit" and "extendedprice" fields grouped by "partkey". 12. The results are loaded in view View03 as in the case for view View01. A wishbone workflow joins two parallel lines into one. This scenario is preferred when two tables in the source database should be joined in order to be loaded to the data warehouse or in the case where we perform similar operations to different data that are later joined. In our exemplary scenario, we track the changes that happen in a source containing customers. We compare the customers of the previous load to the ones of the current load and search for new customers to be loaded in the data warehouse.
Line
Wishbone
Primary Flow
Tree Figure 5. Specific ETL workflows
Fork
Balanced Butterfly (1)
Balanced Butterfly (2) Figure 5. Specific ETL workflows (cont’d) Table 1. Summarized statistics of the constituents of the ETL workflows depicted in Figure 5 Line Wishbone Pr. Flow Tree Fork BB(1) BB(2)
Filters 1+1 1+0
Functions 2+0 4+0
2+1
3+0 4+0 0+2 13+2
Routers 0+1
0+1
Aggr 0+3
Holistic f.
Joins
0+1 0+4 0+4
1+0
1+0 3+0 1+0
0+12
1+0
Diff
1+0 6+0
1 1
Unions Load Body Load Views INCR INCR INCR I/U 1+0 I/U I/U INCR INCR INCR FULL I/U 1+0
1.
The first activity on the new data set checks for NULL values in the "custkey" field. The problematic rows are kept in an error log file for further off-line processing.
2.
Both previous and old data are passed through a surrogate key transformation. We assume a domain size that fits in main memory for this source; therefore, the transformation is not performed as a join with a lookup table, but rather as a lookup function call invoked per row.
3.
Moreover, the next activity converts the phone numbers in a numeric format, removing dashes and replacing the '+' character with the "00" equivalent.
4.
The transformed recordsets are persistently stored in relational tables or files which are subsequently compared through a difference operator (typically implemented as a join variant) to detect new rows.
5.
The new rows are stored in a file C.D+ which is kept for the possibility of failure. Then the rows are appended in the warehouse dimension table Customer.
The primary flow scenario is a common scenario in cases where the source table must be enriched with surrogate keys. This exemplary primary flow that we use has as input the Orders table. The scenario is simple: all key-based values (“orderstatus”, “custkey”, “orderkey”) pass through surrogate key filters that lookup (join) the incoming records in the appropriate lookup table. The resulting rows are appended to the relation DW.Orders. If incoming records exist in the DW.Orders relation and they have changed values then they are overwritten (thus, the Slowly Changing Dimension Type 1 tag in the figure); otherwise, a new entry is inserted in the warehouse relation. The tree scenario joins several source tables and applies aggregations on the result recordset. The join can be performed over either heterogeneous relations, whose contents are combined, either over homogeneous relations, whose contents are integrated into one unified (possible sorted) data set. In our case, the exemplary scenario involves three sources for the warehouse relation PartSupp. The scenario evolves as follows: 1. Each new version of the source is sorted by its primary key and checked against its past version for the detection of new or updated records. The DIFFI,U operator checks the two inputs for the combination of pkey, suppkey matches. If a match is not found, then a new record is found. If a match is found and there is a difference in the field “availqty” then an update needs to be performed. 2. These new records are assigned surrogate keys per source 3. The three streams of tuples are united in one flow and they are also sorted by “pkey” since this ordering will be later exploited. Then, a delta file PS.D is produced. 4. The contents of the delta file are appended in the warehouse relation DW.PS.
scenario and the result table is used to create a set of materialized views. Our exemplary scenario uses the Lineitem table as the butterfly’s body and starts with a set of extracted new records to be loaded. 1. First, surrogate keys are assigned to the fields "partkey", "orderkey" and "suppkey". 2. We convert the dates in the "shipdate" and "receiptdate" fields into a “dateId”, a unique identifier for every date. 3. The third activity is a calculation of a value "profit". This value is derived from other fields in every tuple as the amount of "extendedprice" subtracted by the values of the "tax" and "discount" fields. 4. This activity changes the fields "extendedprice", "tax", "discount" and "profit" to a different currency. The result of this actvity is stored at a delta table D+.LI. The records are appended to the data warehouse LineItem table and they are also reused for a number of aggregations at the right wing of the butterfly. All records pushed towards the views, either update or insert new records in the views, depending on the existence (or not) of the respective groups. 5. The aggregator for View05 calculates the sum of the "profit" and "extendedprice" fields grouped by the "partkey" and "linestatus" fields. 6. The aggregator for View06 calculates the sum of the "profit" and "extendedprice" fields grouped by the "linestatus" fields. 7. The aggregator for View07 calculates the sum of the "profit" field and the average of the "discount" field grouped by the "partkey" and "suppkey" fields. 8. The aggregator for View08 calculates the average of the "profit" and "extendedprice" fields grouped by the "partkey" and "linestatus" fields. The most general-purpose scenario type is a butterfly scenario. It joins two or more source tables before a set of aggregations is performed on the result of the join. The left wing of the butterfly joins the source tables, while the right wing performs the desired aggregations producing materialized views. Our first exemplary scenario uses new source records concerning Partsupp and Supplier as its input. 1. Concerning the Partsupp source, we generate surrogate key values for the "partkey" and "suppkey" fields. Then, the "totalcost" field is calculated and added to each tuple. 2. Then, the transformed records are saved in a delta file D+.PS and appended to the relation DW.Partsupp. 3. Concerning the Supplier source, a surrogate key is generated for the “suppkey” field and a second activity transforms the "phone" field. 4. Then, the transformed records are saved in a delta file D+.S and appended to the relation DW.Supplier.
5. At the same time, the materialized view View04 is refreshed too. The delta rows are summarized for the available quantity per pkey and then, the appropriate rows in the view are either updated (if the group exists) or (inserted if the group is not present).
5. The delta relations are subsequently joined on the "ps_suppkey" and "s_suppkey" fields and populate the view View09, which is augmented with the new records. Then, several views are computed from scratch, as follows.
The fork scenario applies a set of aggregations on a single source table. First the source table is cleaned, just like in a line
6. View View10 calculates the maximum and the minimum value of the "supplycost" field grouped by the "nationkey" and "partkey" fields.
7. View View12 calculates the maximum and the minimum of the "supplycost" field grouped by the "partkey" fields. 8. View View11 calculates the sum of the "totalcost" field grouped by the "nationkey" and "suppkey" fields. 9. View View13 calculates the sum of the "totalcost" field grouped by the "suppkey" field. A second exemplary scenario introduces a Slowly Changing Dimension plan, populating the dimension table PART and retaining its history at the same time. The trick is found in the combination of the “rkey”, “s_partkey” attributes. The “s_partkey” assigns a surrogate key to a certain tuple (e.g., assume it assigns 10 to a product X). If the product changes in one or more attributes at the source (e.g., X’s “size” changes), then a new record is generated, with the same “s_partkey” and a different “rkey” (which can be a timestamp-based key, or similar). The proposed scenario, works as follows: 1.
A new and an old version of the source table Part are compared for changes. Changes are directed to P.D++ (for new records) and P.DU for updates in the fields “size” and “container”
2.
Surrogate and recent keys are assigned to the new records that are propagated to the table PART for storage.
3.
An auxiliary table MostRecentPART holding the most recent “rkey” per “s_partkey” is appropriately updated.
Observe that in this scenario the body of the butterfly is an activity.
5. OPEN ISSUES Although we have structured the proposed test suites to be as representative as possible, there are several other tunable parameters of a benchmark that are not thoroughly explored. We discuss these parameters in this section. Nature of data. Clearly, the proposed benchmark is constructed on the basis of a relational understanding of the data involved. Neither the sources, nor the warehouse deal with semi-structured or web data. It is clear, that a certain part of the benchmark can be enriched a part of the warehouse schema that (incrementally) refresh the warehouse contents with HTML / XML source data. Active vs. off-line modus operandi. We do not specify different test suites for active and off-line modus operandi of the refreshment process. The construction of the test suites is influenced by an off-line understanding of the process. Although these test suites can be used to evaluate strategies for active warehousing, (since there can be no compromise with respect to the transformations required for the loading of source data), it is understood that an active process (a) should involve some tuning for the micro-volumes of data that are dispatched from the sources to the warehouse in every load and (b) could involve some load shedding activities if the transmitted volumes are higher that the ETL workflow can process. Tuning of the values for the data sizes, workflow selectivity, failure rate and workflow size. We have intentionally avoided providing specific numbers for several problem parameters; we believe that a careful assignment of values based on a large number of real-world case studies (that we do not possess) should be a topic for a full-fledged benchmark. Still, we would like to mention here what we think as reasonable numbers.
Concerning data sizes, the numbers given by TPC-H can be a valid point of reference for data warehouse contents. Still, in our point of view, a more important factor is the fraction of source data over the warehouse contents. In our research we have used fractions that range from 0.01 to 0.7. We also think numbers between 0.5 and 1.2 to be reasonable for the selectivity of the left wing of a butterfly. Selectivity refers to both detected dirty data that are placed in quarantine and newly produced data due to some transformation (e.g., unpivot). A low value of 0.5 means an extremely dirty (50%) data population, whereas a high value means an intense data generation population. In terms of failure rates, we think that the probability for a failure during a workflow execution can range between the reasonable rates of 10-4 and 10-2. Concerning workflow size, although we provide scenarios of small scale, medium–size and large-size scenarios are also needed. Auxiliary structures and processes. We have intentionally avoided backup and maintenance processes in our test suites. We have also avoided delving too deep in physical details of our test suites. A clear consequence of this is the lack of any discussion on indexes of any type in the warehouse. Still, we would like to point out that if an experiment should require the existence of special structures such as indexes, it is quite straightforward to separate the computation of elapsed time or resources for their refreshment and to compute the throughput or the consumed resources appropriately. Parallelism and Partitioning. Although the benchmark is currently not intended to be used for system comparison, the underlying physical configuration in terms of parallelism, partitioning and platform can play an important role for the performance of an ETL process. In general, there exist two broad categories of parallel processing: pipelining and partitioning. In pipeline parallelism, the various activities are operating simultaneously in a system with more than one processor. This scenario performs well for ETL processes that handle a relative small volume of data. For large volumes of data, a different parallelism policy should be devised: the partitioning of the dataset into smaller sets. Then, we use different instances of the ETL process for handling each partition of data. In other words, the same activity of an ETL process would run simultaneously by several processors, each processing a different partition of data. At the end of the process, the data partitions should be merged and loaded to the target recordset(s). Frequently, a combination of the two policies is used to achieve maximum performance. Hence, while an activity is processing partitions of data and feeding pipelines, a subsequent activity may start operating on a certain partition before the previous activity had finished. In Figure 6, the execution of an abstract ETL process is pictorially depicted. In Figure 6(a), the execution is performed sequentially. In this case, only one instance of it exists. Figures 6(b) and 6(c) show the parallel execution of the process in a pipelining and a partitioning fashion, respectively. In the latter case, larger volumes of data may be handled efficiently by more than one instance of the ETL process; in fact, there are as many instances as the partitions used. Platform. Depending on the system architecture and hardware, the parallel processing may be either symmetric multiprocessing – a single operating system, the processors communicate
Figure 6. (a) Sequential, (b) pipelining, and (c) partitioning execution of ETL processes through shared memory – or clustered processing – multiple operating systems, the processors communicate through the network. The choice of an appropriate strategy for the execution of an ETL process, apart from the availability of resources, relies on the nature of the activities, which are participating in it. In terms of performance, an activity is bounded by three main factors: CPU, memory, and/or disk I/O. For an ETL process that includes mainly CPU-limited activities, the choice of a symmetric multiprocessing strategy would be beneficial. For ETL processes containing mainly activities with memory or disk I/O limitations – sometimes, even with CPU limitations – the clustering approach may improve the total performance due to usage of multiple processors, which have their own dedicated memory and disk access. However, the designer should confront with the trade-off between the advantages of the clustering approach and the potential problems that may occur due to network traffic. For example, a process that needs frequent repartitioning of data should not use clusters in the absence of a high-speed network.
6. RELATED WORK Several benchmarks have been proposed in the database literature, in the past. Most of the benchmarks that we have reviewed make careful choices: (a) on the database schema & instance they use, (b) on the type of operations employed and (c) on the measures to be reported. Each benchmark has a guiding goal, and these three parts of the benchmark are employed to implement it. To give an example of the above, we mention two benchmarks mainly coming from the Wisconsin database group. The OO7 benchmark was one of the first attempts to provide a comparative platform for object-oriented DBMS’s [3]. The OO7 benchmark had the clear target to test as many aspects as possible of the efficiency of the measured systems (speed of pointer traversal, update efficiency, query efficiency). The BUCKY benchmark had a different viewpoint: the goal was to narrow down the focus only on the aspects of an OODBMS that were object-oriented (or object-relational): queries over inheritance, set-valued attributes, pointer navigation, methods and ADTS [4]. Aspects covered by relational benchmarks were not included in the BUCKY benchmark. TPC has proposed two benchmarks for the case of decision support. The TPC-H benchmark [13 is a decision support benchmark that consists of a suite of business-oriented ad-hoc queries and concurrent data modifications. The database describes a sales system, keeping information for the parts and the suppliers, and data about orders and the supplier's customers.
The relational schema of TPC-H consists of eight separate tables with 5 of them being clearly dimension tables, one being a clear fact table and a couple of them combinations of fact and dimension tables. Unfortunately, the refreshment operations provided by the benchmark are primitive and not particularly useful as templates for the evaluation of ETL scenarios. TPC-DS is a new Decision Support (DS) workload being developed by the TPC [10]. This benchmark models the decision support system of a retail product supplier, including queries and data maintenance. The relational schema of this benchmark is more complex than the schema presented in TPCH. There are three sales channels: store, catalog and the web. There are two fact tables in each channel, sales and returns, and a total of seven fact tables. In this dataset, the row counts for tables scale differently per table category: specifically, in fact tables the row count grows linearly, while in dimension tables grows sub-linearly. This benchmark also provides refreshment scenarios for the data warehouse. Still, all these scenarios belong to the category of primary flows, in which surrogate and global keys are assigned to all tuples.
7. CONCLUSIONS In this paper, we have dealt with the challenge of presenting a unified experimental playground for ETL processes. First, we have presented a principled way for constructing ETL workflows and we have identified their most prominent elements. We have classified the most frequent ETL operations based on their special characteristics. We have shown that this classification adheres to the built-in operations of three popular commercial ETL tools; we do not anticipate any major deviations for other tools. Moreover, we have proposed a generic categorization of ETL workflows, namely butterflies, which covers frequent design cases. We have identified the main parameters and measures that are crucial in ETL environment and we have discussed how parallelism affects the execution of an ETL process. Finally, we have proposed specific ETL scenarios based on the aforementioned analysis, which can be used as an experimental testbed for the evaluation of ETL methods or tools. The main message from our work is the need for a commonly agreed benchmark that realistically reflects real-world scenarios, both for research purposes and, ultimately, for the comparison of ETL tools. Feedback from the industry is necessary (both with respect to the complexity of the workflows and the frequencies of typically encountered ETL operations) in order to further tune the benchmark to reflect the particularities of real world ETL workflows more precisely.
8. REFERENCES [1] J. Adzic, V. Fiore. Data Warehouse Population Platform. In DMDW, 2003.
[8] Oracle. Oracle Warehouse Builder 10g. Retrieved, 2007. URL: http://www.oracle.com/technology/products/warehouse/
[2] Ascential Software Corporation. DataStage Enterprise Edition: Parallel Job Developer’s Guide. Version 7.5, Part No. 00D-023DS75, 2004.
[9] Oracle. Oracle Warehouse Builder Transformation Guide. 10g Release 1 (10.1), Part No. B12151-01, 2006. [10] R. Othayoth, M. Poess. The Making of TPC-DS. In VLDB, 2006.
[3] M. J. Carey, D. J. DeWitt, J. F. Naughton. The OO7 Benchmark. In SIGMOD, 1993. [4] M. J. Carey et al. The BUCKY Object-Relational Benchmark (Experience Paper). In SIGMOD, 1997.
[11] A. Simitsis, P. Vassiliadis, S. Skiadopoulos, T. Sellis. Data Warehouse Refreshment. In "Data Warehouses and OLAP: Concepts, Architectures and Solutions", IRM Press, 2006.
[5] IBM. WebSphere DataStage. Retrieved, 2007. URL: http://www-306.ibm.com/software/data/integration/datastage/
[12] K. Strange. Data Warehouse TCO: Don’t Underestimate the Cost of ETL. Gartner Group, DF-15-2007, 2002.
[6] Informatica. PowerCenter 8. Retrieved, 2007. URL: http://www.informatica.com/products/powercenter/
[13] TPC. TPC-H benchmark. Transaction Processing Council. URL: http://www.tpc.org/.
[7] Microsoft. SQL Server 2005 Integration Services (SSIS). Url: http://technet.microsoft.com/en-us/sqlserver/bb331782.aspx
[14] A.K. Elmagarmid, P.G. Ipeirotis, V.S. Verykios. Duplicate Record Detection: A Survey. IEEE TKDE (1): 1-16 (2007).
APPENDIX Table A1. Taxonomy of activities at the micro level and similar built-in transformations provided by commercial ETL tools
Extr.
Transformation and Cleansing
Transformation Category*
SQL Server Information Services SSIS [7]
Row-level: Function that can be applied locally to a single row
− − − − − − −
Routers: Locally decide, for each row, which of the many outputs it should be sent to Unary Grouper: Transform a set of rows to a single row
− Conditional Split − Multicast
Unary Holistic: Perform a transformation to the entire data set (blocking) Binary or N-ary: Combine many inputs into one output
− Sort − Percentage Sampling − Row Sampling Union-like: − Union All − Merge Join-like: − Merge Join (MJ) − Lookup (SKJ) − Import Column (NLJ)
Character Map Copy Column Data Conversion Derived Column Script Component OLE DB Command Other filters (not null, selections, etc.)
− Aggregate − Pivot/Unpivot
DataStage [2] − Transformer (A generic representative of a broad range of functions: date and time, logical, mathematical, null handling, number, raw, string, utility, type conversion/casting, routing.) − Remove duplicates − Modify (drop/keeps columns or change their types) − − − − − − − −
Copy Filter Switch Aggregator Make/Split subrecord Combine/Promote records Make/Split vector Sort (sequential, parallel, total)
Oracle Warehouse Builder [9] − − − − −
Deduplicator (distinct) Filter Sequence Constant Table function (it is applied on a set of rows for increasing the performance) − Data Cleansing Operators (Name and Address, Match-Merge) − Other SQL transformations (Character, Date, Number, XML, etc.) − Splitter − Aggregator − Pivot/Unpivot − Sorter
Union-like: − Funnel (continuous, sort, sequence) Join-like: − Join − Merge − Lookup Diff-like: − Change capture/apply − Difference (record-by-record) − Compare (column-by-column)
Union-like: − Set (union, union all, intersect, minus) Join-like: − Joiner − Key Lookup (SKJ)
− Import Column Transformation
− Compress/Expand − Column import
− Merge − Import
− Export Column − Slowly Changing Dimension
− Compress/Expand − Column import/export
Load
− Merge − Export − Slowly Changing Dimension * All ETL tools provide a set of physical operations that facilitate either the extraction or the loading phase. Such operations include: extraction from hashed/sequential files, delimited/fixed width/multi-format flat files, file set, ftp, lookup, external sort, compress/uncompress, and so on.