also different elements, document re-use is not appropriate. ... âsafelyâ included in a reply. ... gruous sentence in a generated response could alienate a user.
Towards a Framework for Collating Help-desk Responses from Multiple Documents Yuval Marom and Ingrid Zukerman School of Computer Science and Software Engineering, Monash University Clayton, VICTORIA 3800, AUSTRALIA {yuvalm, ingrid}@csse.monash.edu.au Abstract Responses to help-desk email inquiries are often repetitive, sharing varying degrees of commonality. In addition, a significant proportion of the responses are generic, containing a very low level of technical content. In this paper, we present a corpus-based approach for identifying common elements in help-desk responses and using them to construct a new response. A help-desk domain is unique in that responses that contain even one incongruous sentence can alienate a user. It is therefore not always possible to automatically generate a complete response, because personalization is often better handled by human operators. Our system is designed to find and collate the generic portions of responses. We have adapted multi-document summarization techniques, and developed a measure that predicts the completeness of a planned response, thus indicating when a fully automated response is possible. Our evaluation shows that 14% of the responses in our corpus can be represented by complete generic responses.
1 Introduction Email inquiries sent to help desks are often repetitive, and generally “revolve around a small set of common questions and issues”.1 This means that help-desk operators spend most of their time dealing with problems that have been previously addressed. Further, a significant proportion of help-desk responses contain a very low level of technical content, replying, for example, to inquiries about returning a product or questions addressed to the wrong group, or pointing out that the customer has provided insufficient detail about his/her problem. Organizations and clients would therefore benefit if an automated process was employed to deal with the easier problems, and the efforts of human operators were focused on difficult, atypical problems. In this paper, we present an initial report of our corpusbased approach to achieving this objective with respect to 1 http://customercare.telephonyonline.com/ ar/telecom_next_generation_customer/C.
email inquiries sent to Hewlett-Packard (HP). We are developing a system to automatically generate responses to users’ requests on the basis of responses seen in a corpus of email dialogues. Since help-desk inquiries revolve around a small set of common problems, there is significant overlap in the content of the responses, but there are also differences arising from tailoring responses to particular user needs. For example, a response could consist of a generic description of how to install new printer drivers (the same for all printer models), preceded by a reference to a specific download location (different for each model). Also, a response in the corpus may refer to several, distinct problems raised by a user, where the answer to each problem appears repeatedly in the corpus, but the complete response does not. In some cases, a new request might match a previous one very well, suggesting a traditional document retrieval approach, where a response document in the corpus can be reused in its entirety. However, when a new request matches several previous requests whose responses have common but also different elements, document re-use is not appropriate. Instead, a response should be composed from parts of different responses. This task is similar to query-relevant, multi-document summarization in the sense that different documents (i.e., candidate responses) must be combined to produce one response that is relevant to a user’s request or interests. However, there is a significant difference between these tasks. Users of summarization systems will gloss over items of information that are not entirely relevant, whereas a help-desk response that contains even a single incongruous sentence will alienate the user. Therefore, the responses generated by our system must have very high relevance, even if this comes at the expense of completeness. If a complete response is not possible, it is more sensible to prompt a human operator to complete a partial response than to risk presenting incongruous information. We postulate that there are two main types of information items that should be included in a response: generic, which are common to all (or most of) the responses that match a user’s query, and specific, which address particular issues in the user’s query. In the above example about drivers for printers, the general information about drivers would appear in most of the responses that match the given query, while the download information about a particular printer would appear only in specific replies. The approach proposed in this pa-
per identifies the former, i.e., information items that can be “safely” included in a reply. Further, we propose a measure to model our system’s confidence in the completeness of a planned response composed of such safe elements. These are typically generic responses that have a low technical content. The rest of this paper is organized as follows. In Section 2, we describe our corpus. Section 3 details our approach for generating the generic portions of help-desk responses and for assessing the completeness of planned responses. The evaluation of our approach is presented in Section 4. In Section 5, we discuss our first attempts at personalizing responses. Section 6 considers related work, followed by concluding remarks.
2 Corpus Our corpus consists of 30000 email dialogues between users and help-desk operators at HP. These dialogues deal with a variety of user requests, which include requests for technical assistance, inquiries about products, and queries about how to return faulty products or parts. We have divided the corpus into topic-related datasets. For example, there is a “product replacement” (PRDRP) dataset with 1416 dialogues, and a “desktop” (DESKTOP) dataset with 590 dialogues. Further, we are focusing on 2-turn dialogues, as we are targeting user requests that can be dealt with using one response (about 80% of our corpus consists of 2-turn dialogues). Owing to time limitations, the procedures described in this paper were applied only to datasets comprising between 300 and 1500 (2-turn) dialogues, which corresponds to a total of 8000 dialogues. Below are two responses from the PRDRP dataset. R1: I apologize for the delay in responding to your issue. Your request for a return airbill has been received and has been sent for processing. Your replacement airbill will be sent to you via email within 24 hours. R2: I apologize for the delay in handling your issue. Your request for a return airbill has been received and has been sent for processing. Your replacement airbill will be sent to you via email within 24 hours.
We can identify three functional “building blocks” for both responses: apologize, confirm and inform. Even though there is a minor difference between their opening sentences (“responding to” vs. “handling”), the responses are essentially identical. In contrast, response R3 below contains rather different building blocks, although it shares the first one with R1 and R2. R3: I apologize for the delay in responding to your issue. We are unable to send out replacement labels for return boxes. Please contact Technical Support at 1-800-OKCOMPAQ to have another box dispatched to you.
In the next section we present our approach for representing and collating building blocks of responses.
3 Approach — Building blocks for responses In order to find similarities between responses in our corpus, we believe it is necessary to represent building blocks at the sentence level. This is motivated by the characteristics of our
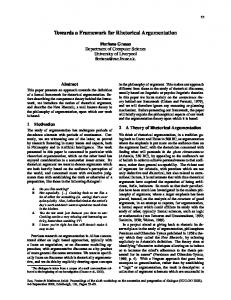
task and domain: (1) the corpus contains repeated information at an intermediate level of abstraction (between entire responses and individual words), and (2) even a single incongruous sentence in a generated response could alienate a user. Further, the similarities between parts of responses should be abstracted from their exact wording, so that sentences that convey essentially the same meaning can be treated as the same building block. When doing so, care must be taken to ensure that we are able to confidently select representative sentences in the response generation stage. We have developed a system that finds response building blocks by clustering sentences. We extract all the sentences from the responses in a particular dataset, and then cluster them into Sentence Types (STs). This procedure should yield cohesive clusters for similar sentences, from which it is easy to select a representative sentence. In contrast, sentences that have differences would yield less cohesive clusters, thereby making it more difficult to select a representative sentence. This motivates a measure of cluster cohesion. When generating a response to a new request, the system needs to know the building blocks for this response, i.e., the sentence types to use. In this paper we focus on the generation of the generic portion of responses. This generic portion may actually yield a complete response, such as R1 and R2, or a few sentences in a response, such as the first two sentences in R3. Our approach consists of three steps: 1. Finding Response Types (RTs): groups of responses that share similar building blocks. Each group specifies the set of sentence types that the responses in the group agree on. We refer to this agreement as the support for the STs. In addition, we define a “semantic compactness” measure for the completeness of a response type, measured as the proportion of cohesive sentence types that are highly supported. 2. Producing a “model” response for each response type. This is achieved by selecting representative sentences from the cohesive sentence types that are supported by the group of responses. 3. Matching a new request with one or more response types. If only one response type is matched and it is considered complete by the semantic compactness measure, then its generated response can be sent directly to the user. Otherwise, a single response that is incomplete or several candidate responses (complete or otherwise) can be passed to an operator. In this paper, we focus on the first two steps, i.e., constructing groups of responses, and generating a representative response for each group. In Section 5, we report on results of preliminary experiments involving the third step. In the remainder of this section we give more detail on the different parts of the system: (1) identifying sentences types; (2) clustering responses according to the sentence types they contain; (3) calculating the “semantic compactness” of the response clusters; and (4) selecting sentences for inclusion in a response (Figure 1 illustrates Steps 1, 2 and 4).
RD1
RD2
s1 s2 s3 s4
ST1
0.9
s1(0.9) s3(0.95) ... s3595(0.7)
0.95
RM1 0.05
ST2 s3(0.05) ... s3595(0.3)
s5 s6 s7
.. .
. . .
0.7 0.3
0.1
s3595
RV1
RM2
ST1 ST2 . . . ST25 0.9 0 . . . 0.1 . . . 0.95 0.05 . . . 0 . . . ( 1
. . . . . . . . .
s5 s6 s7 RV2
0 ... 1 )
( 1
.. 1 .
ST25 s1(0.1)...
s3596 RM1205 s3597 s3598
CLUSTERING SENTENCES
RT2 ... R1205(0.6)
0.1
. . .
0.2
RT10
1 ... 0 )
Notation: ST(p ; q)
RT3
0.8
... 1 )
. . . . . . . . .
RV1205 ( 1
RT1 R1(0.8) R2(0.1) ...
0.6
s3595 0.7 0.3 . . . 0
RD1205 s3596 s3597 s3598
s1 s2 s3 s4
R1(0.2) ...
CLUSTERING RESPONSES BASED ON SENTENCE TYPES
ST10(0.949;1) ST12(0.838;0.97) ST22(0.95;0.62) ST24(0.842;0.46) ST25(0.844;1) Pr(ST12|s11)=0.99;Pr(s11|ST12)=0.316 Pr(ST12|s20)=0.99;Pr(s20|ST12)=0.0014
RT10 ST3(0.795;0.97) ST12(0.999;0.97) ST25(0.999;1) Pr(ST3|s5)=0.99;Pr(s5|ST3)=0.323 Pr(ST3|s8)=0.99;Pr(s8|ST3)=0.0006
s5: "I apologize for the delay in responding to your issue" s8: "I apologize for the delay in handling your issue" SELECTING SENTENCES FOR RESPONSE TYPES
Figure 1: Sentence and response clustering, and response generation, for the PRDRP dataset.
3.1
Identifying sentence types
The representation used for clustering sentences is crucial, because it determines what constitutes similarity. In R1 and R2 the minor difference between ‘handling’ and ‘responding’ is inconsequential. However, if the last sentence of R1 were “Your replacement airbill will be sent to you via email within 48 hours”, the difference would be important (24 hours versus 48). Our current implementation uses a bag-of-words approach with binary values. That is, each sentence is represented by means of a binary vector of size N (number of feature words in the dataset), where element j is 1 if (lemmatized) word wj is present in the sentence, and 0 otherwise. Although this representation treats both of the above examples in the same way, we have found it a useful starting point. In the future, we plan to investigate context-dependent representations, such as that proposed by Lin [1998], and automatic tagging of certain types of words, such as numbers and case identifiers. Once all the sentences have been extracted from the responses in a dataset, they are passed on to SNOB, a clustering program based on the Minimum Message Length principle [Wallace and Boulton, 1968]. SNOB yields m sentence types, where m varies for each dataset. For example, the PRDRP dataset has 25 sentence types, and the DESKTOP dataset has 40. Each sentence type STi , i = 1, . . . , m, is represented by means of a centroid CSTi — an N -dimensional vector, such that CSTi [j] = Pr(wj ∈ STi ) is the probability that word wj is used in STi . The left panel of Figure 1 illustrates the sentence-clustering process for the PRDRP dataset, which contains 1205 response documents (RD1, . . ., RD1205) comprising a total of 3598 sentences. As seen in this example, a sentence may probabilistically belong to more than one sentence type, e.g., Pr(ST 1|s1) = 0.9 and Pr(ST 25|s1) = 0.1 (these probabilities are provided by SNOB).
3.2
Clustering responses
We apply SNOB again to cluster responses into response types, but first we perform the following steps to represent responses by means of sentence types (these steps are illustrated in the middle panel of Figure 1 for the PRDRP dataset).
Representing sentences in terms of sentence types. We represent each sentence sj by means of an m-dimensional vector, where m is the number of sentence types. Element i in the vector for sentence sj contains Pr(STi |sj ) (the probability that sj belongs to sentence type STi ). We then combine the vector for each sentence in response Rk into a Response Matrix RMk of size nk ×m, where nk is the number of sentences in Rk . For instance, as seen in the middle panel of Figure 1, RM1, the response matrix for response R1, comprises the vectors for sentences s1, s2, s3 and s4; the vector for s1 indicates that Pr(ST 1|s1) = 0.9, Pr(ST 25|s1) = 0.1 and Pr(STj |s1) = 0 for j = 2, . . . , 24 (these probabilities sum to 1). Representing responses in terms of sentence types. For each response matrix RMk , we derive an m-dimensional Response Vector RVk , such that for i = 1,. . . ,m � 1 if ∃RMk [j, i] ≥ 0.1 for j = 1, . . . , nk (1) RVk [i] = 0 otherwise That is, RVk [i] = 1 indicates that sentence type STi has some presence in response Rk (with probability ≥ 0.1). We use a binary representation for the RVs because (1) it provides a reasonable first baseline for our system, and (2) the centroids of the resultant clusters have clear probabilistic semantics. In the future, we intend to investigate real-valued representations, e.g., set RVk [i] to be the maximum of the RMk [j, i] for all j. Clustering. The response vectors are given to SNOB, which clusters them into response types. The number of response types varies for different datasets. For instance, PRDRP and DESKTOP have 10 and 9 response types respectively. Each response type RTl is represented by means of a centroid CRTl — an m-dimensional vector, such that CRTl [i] = Pr(STi ∈ RTl ) is the probability that sentence type STi is used in response type RTl .
3.3
Calculating semantic compactness
The response clustering process yields a centroid for each response type. The centroid of a response type can be interpreted as a set of probabilities, p = {p1 , p2 , . . . , pm }, where
pi represents the support in the response type for sentence type STi . In other words, pi corresponds to the proportion of responses in the response type that use STi . The Semantic Compactness (SemCom) measure predicts whether a complete, high-precision response can be generated for a response type. This measure is based on the support and cohesion of each sentence type. The former can be obtained from the support probabilities p, while for the latter we define the following measure of cohesion q = {q1 , q2 , . . . , qm }, where qi for sentence type STi is defined as follows. qi =
N 1 X δ (CSTi [j] ≤ α ∨ CSTi [j] ≥ 1 − α) N j=1
(2)
where N is the number of feature words in the data set, α is an empirically determined threshold, and δ is the boolean function � event A is true δ (A) = 10 ifotherwise By choosing a value for α close to zero, Equation 2 specifies that a sentence type is cohesive if there is a high proportion of words that are almost certainly present or almost certainly absent from this sentence type.2 The rationale for this measure is that a cohesive group of sentences should agree strongly on the words they use and the words they omit. Hence, it is possible to obtain a sentence that adequately represents a cohesive sentence type, while this is not the case for a loose sentence type. For example, the opening sentences in R1 and R2 belong to a sentence type which is a cluster consisting of 810 identical repetitions of the sentence from R1, and 15 identical repetitions of the sentence from R2. The cohesion of this sentence type is 0.97. An example of a non-cohesive sentence type is one which consists of sentences about part numbers and order numbers, such as “Your part has been received”, “Please verify that this is the correct order number”, “No part return is required on this order”, and “The case number provided is not coming up in our system”. These sentences share a few words (mainly ‘part’, ‘order’ and ‘number’), but do not discuss anything specific about these words — we could not confidently select a representative sentence from this sentence type. The cohesion of this sentence type is 0.65. The semantic compactness of a response type with support p and cohesion q is calculated as follows. Pm δ (pi ≥ τ Hi ∧ qi ≥ τ Coh ) (3) SemCom(p, q) = i=1 Pm i=1 δ (pi ≥ 0.1)
where τ Hi and τ Coh are empirically determined thresholds. SemCom measures the proportion of highly supported and cohesive sentence types among the sentence types that have some support (hence the low threshold of 0.1 in the denominator). If this proportion is high, the proposed response is deemed semantically compact, which means that it is a good candidate for automatic response generation. As the value of 2
This measure is a simplification of entropy, in the sense that it yields non-zero values for extreme probabilities.
this proportion decreases, so does the confidence of automatically generating a complete response. During response generation, our system compares the semantic compactness of a proposed response with an empirically determined threshold, in order to determine whether a human operator should participate in the composition of a reply. In Section 4.2 we evaluate the semantic compactness measure, and suggest a value for its threshold. Further, the results we report in that section were obtained with rather stringent thresholds (τ Hi = 0.75, τ Coh = 0.9 and α = 0.01), in order to implement a cautious approach that avoids including potentially incongruous sentences in automatically generated responses. However, our sensitivity analysis shows that the quality of our responses is largely maintained even if we relax some of these thresholds [Marom and Zukerman, 2005].
3.4
Selecting sentences for inclusion in a response
Sentences can be (probabilistically) associated with multiple sentence types, so we need a method of selecting the most representative sentences to include in a response, while avoiding repetition. Filatova and Hatzivassiloglou [2004] address this problem, and we have implemented a modified version of their adaptive greedy algorithm for scoring sentences. Our system selects the most representative sentences from the most supported and cohesive sentence types. The clustering program SNOB provides Pr(sj |STi ), the probability of a sentence sj given a sentence type STi , which we can use as an indication of how representative this sentence is of the sentence type.3 For example, when selecting a sentence from the sentence type corresponding to the opening sentences in R1 and R2, the sentence in R1 has a higher probability because it appears more frequently in that cluster. The score of each sentence is calculated as follows. m X Score(sj ) = Pr(sj |STi ) × pi × δ (qi ≥ τ Coh ) (4) i=1
The last factor ensures that only cohesive sentence types contribute to the score of a sentence, thus safeguarding against potentially incongruous sentences. Following the adaptive greedy algorithm, the system scores and sorts all the sentences, and then identifies which sentences represent sentence types that are already represented by higher-scoring sentences. The score of the lower-scoring sentences is then reduced by the contribution from the shared sentence type, thus reducing the chances of repetition in the response. We include in the response only sentences whose score is greater than zero. It is worth noting that our system does not currently address the order of sentence presentation, and therefore our evaluation is based purely on the content of a response. The right panel of Figure 1 illustrates the generation of a response for two response types, RT3 and RT10 (for example, in RT3, the notation ST12(0.838;0.97) means that p12 = Pr(ST 12 ∈ RT 3) = 0.838 and q12 = 0.97). RT3 contains five sentence types with a high value for 3
Note that Pr(sj |STi ) is different from the posterior Pr(STi |sj ), which can be interpreted as the probability that sj belongs to sentence type STi (shown in the left panel of Figure 1).
R5: I apologize for the delay in responding to your issue. Your request for a return airbill has been received. Additional information is needed to process your request. Please provide a case number or an order number so that we may send you a replacement label.
1
10
0.5 0
1
2 4 8 97
3
5
−0.5 −1 −1.5 0.5
6
0
1.5
−0.5
1 −1
0.5 −1.5
0 −2
−0.5
Figure 2: Response types for the PRDRP dataset. Pr(STi ∈ RT 3), but only three of them have high cohesion (ST10, ST12 and ST25). Hence, we only include sentences from these sentence types in the response generated from RT3. In contrast, all the sentence types in RT10 have a high value for Pr(STi ∈ RT 10) and high cohesion — this response type has a semantic compactness of 1.0. Hence, a complete summary can be generated from these sentence types. As seen in Equation 4, since the ps and qs are high for all the sentence types in RT10, the selection of a representative sentence for these sentence types depends mainly on Pr(sj |STi ). In this example, s5 is selected to represent ST3, as Pr(s5|ST 3) is much higher than Pr(s8|ST 3). The resultant generated response is identical to response R1.
4 Evaluation In this section, we first illustrate the output produced by our system for two datasets (including the previously discussed PRDRP dataset). We then examine the predictive performance of our SemCom measure, and finally make some overall observations about the coverage and completeness of model responses.
4.1
Sample datasets
The PRDRP dataset Figure 2 shows a 3D projection of the centroids of the response types discovered for the PRDRP dataset (the response types are represented by their numbers).4 The figure shows (to some extent) how different the RTs are from each other. Response Type 10, discussed above, is the most significant one as it accounts for 862 responses (71%). According to Figure 2, the RTs most different from RT10 are RT1 and RT6. Both RTs have a perfect semantic compactness, they account for 72 and 49 responses respectively, and their generated responses are R4 and R5, respectively. R4: Your request for a return airbill has been forwarded to the proper group. You will receive your replacement airbill within 24 hours. 4
This figure is generated using Principal Component Analysis (PCA); it is a projection of the 25-dimensional centroid values onto the first three principal components discovered by PCA, which correspond to the axes in the figure. These components account for approximately 70% of the variability in the data (measured as the relative contribution of the first three eigenvalues of the covariance matrix).
These three response types together account for about 81.5% of the responses in the dataset. That is, the system is able to find three different kinds of generic responses, and confidently generate complete automatic responses that account for 81.5% of the actual responses. The response-clustering procedure also finds groups of responses that cannot be replaced by model responses. For example, RT9 accounts for 55 responses, but has a semantic compactness of 0.0. This means that the responses in this cluster strongly disagree about which sentence types to use, or that the sentence types that they agree on are non-cohesive. Thus RT9 does not generate any sentences. An example of a response in this response type is R6, a fairly specific, personalized response. R6: It is usually required that the case number and order number are provided, however in your circumstances we will see what we can do to help. What other information can you provide? Do you have the serial number of the unit?
The TAPEDRV dataset Our findings show that different datasets have different proportions of responses that can be replaced by generic responses. The PRDRP dataset has the highest potential for the generation of a complete response, while only 35% of the responses in the TAPEDRV dataset (concerning tape drives) can be generated by our system in their entirety. However, our system can also generate partial responses from a response type. These responses contain sentences extracted from a subset of highly cohesive sentence types in the response type. An example of a partial response for the TAPEDRV dataset is R7. R7: Thank you for contacting HP’s Customer Care Technical Center. We are only able to assist customers with in warranty products through our email services. At the present time, we have the following numbers to contact technical support for your out of warranty product.
The response type that generated this response accounts for 19 responses, and has a semantic compactness of 0.25, which means that, on average, the generated response covers only a quarter of the actual responses. Examples of sentences that appear in the actual responses that make up this response type are: “As your product is out of warranty, you can visit the link given below for complete details regarding the COLORADO 8GB TRAVAN tape drive: URL”, and “The 5 BG Internal travan drives should be recognized and configured automatically by Windows XP using the native QIC157 driver”. The additional information in these sentences is very specific and quite unique, which accounts for the low semantic compactness of the response type. The part of the response generated by our system can be regarded as a generic opening segment, with the remainder of the response to be completed by an operator.
Avg Precision/Recall Average F−score
1
0.5
0 0
Precision Recall 0.2
0.4
0.6 SemCom
0.8
1
0.2
0.4
0.6 SemCom
0.8
1
1 0.75 0.5 0.25 0 0
Figure 3: Relationship between semantic compactness and precision and recall (top plot), and F-score (bottom plot).
4.2
Predictive performance of SemCom
Our SemCom measure is designed to predict the completeness of an automatically-generated response composed of highprecision sentences. In order to determine the utility of this measure, we examine how well it correlates with the quality of the generated responses. We assess the quality of a generated response rg by comparing it with the actual responses in the response type from which rg was sourced. To this effect, we use three wellknown information retrieval measures: precision, recall and F-score [Salton and McGill, 1983]. Precision gives the proportion of words in rg that match those in an actual response; recall gives the proportion of words in the actual response that are included in rg ; and F-score is the harmonic mean of precision and recall. Precision, recall and F-score are then averaged over the responses in rg ’s response type to give an overall evaluation of rg .5 For example, RTs 1, 6 and 10 have respective average F-scores of 0.78, 0.82 and 0.80. Figure 3 shows the relationship between semantic compactness and precision, recall and F-score for the 135 response types created for the different datasets. From the figure we see that precision is generally high, and is uncorrelated with SemCom. This is not surprising, as the sentenceselection process is designed to select high-precision sentences. Hence, so long as at least one sentence is selected, the text in the generated response rg will agree with the text in the responses that are represented in rg ’s response type. In contrast, recall is highly correlated with SemCom. A decrease in SemCom indicates that fewer sentences are included in the generated response, which therefore covers less of the information in the original responses. As expected from these results, the overall F-score is also highly correlated with semantic compactness. The linear and log correlations between 5
In addition to these measures, which are calculated on a wordby-word basis, we experimented with the ROUGE evaluation procedure, which also takes into account word sequences [Lin and Hovy, 2003]. The simpler word-by-word evaluation correlated well with ROUGE , hence we only report on the former.
the semantic compactness measure and F-score are 0.89 and 0.9 respectively, which demonstrate the high predictive power of the SemCom measure. However, for the predictions made by SemCom to be useful, they must also agree with users’ views. To test whether this is the case, we conducted a small, preliminary study as follows. We constructed four evaluation sets by selecting four response types with high semantic compactness (≥ 0.7), automatically generating a response from each response type, and selecting 15 actual responses from each response type for comparison.6 Each evaluation set was given to two judges, who were asked to rate the precision and completeness of the generated response compared to each of the 15 responses in the set. Our judges gave all the automatically generated responses high precision ratings, and completeness ratings which were consistent with our semantic compactness measure.
4.3
Overall observations
Once we were confident that our semantic compactness measure can reliably predict the completeness of a generated response, we were interested to get an overall impression of the proportion of generic responses in our corpus. That is, we wanted to find out what proportion of responses could be represented by complete or partial model responses. For example, we saw in Section 4.1 that 81.5% of the responses in the PRDRP dataset can be represented by complete model responses. Model responses are complete if their response types have a high semantic compactness. Figure 3 suggests that SemCom > 0.7 results in a high F-Score. If we consider this threshold to indicate a complete response, the response types that exceed it account for approximately 14% of the actual responses in the various datasets. If we consider a threshold of 0.4 to indicate a medium semantic compactness, then the additional response types that exceed it account for a further 6% of the responses — these response types would produce partial responses. The remaining 80% of the responses would have to be mostly written by an operator. However, this may be a pessimistic estimate, as some response types with a low SemCom yield reasonable partial responses, such as R7 whose response type has a SemCom of 0.25 (Section 4.1).
5
Tailoring responses to users’ requests — preliminary trials
In order to enable the system to respond flexibly to specific user requests, user-driven summarization must be implemented. To this effect, we are considering two approaches: (1) predicting response types from request features in order to test whether model responses can be used to address some requests; and (2) predicting sentence types from request features in order to construct a response from parts of multiple responses in the corpus. Here we report on our preliminary trials for the first option, and present our ideas for the second option. 6
Several of our automatically-generated responses match perfectly the operators’ responses. Since these are obvious matches, they were not included in our study.
5.1
Predicting response types
We trained a Decision Graph [Oliver, 1993] (an extension of the decision trees described in [Wallace and Patrick, 1993]) to predict which RT is most appropriate for a given user request. We extracted various features as input to the Decision Graph, e.g., word unigrams with TF. IDF weights; word bigrams with binary weights; noun, verb, adjective and adverb frequencies; and email length (number of sentences). The features that turned out to be most significant were the word unigrams and bigrams. For example, in one dataset the Decision Graph contained a split on the word ‘xp’, which differentiated two response types. These response types were very similar, both requesting more information from the user, and providing contact numbers for out-of-warranty products. The main difference between them was the sentence “However, the software support for the Windows XP platform will be offered through a solution supplied by VERITAS. Please visit the link given below in order to get in touch with VERITAS”. In a different dataset, the responses were so varied that for most of them the system could only generate the sentence “Thank you, HP eServices”. However, the Decision Graph predicted that if the words ‘cp-2e’ or ‘cp-2w’ (referring to specific router models) were present in the request, then a response type with very high semantic compactness could be used, resulting in response R8. R8: Based on the serial number or other information you’ve provided, your system is a consumer (home) product that is supported by a different group. The Consumer Product Support Group has been trained in the support of the Presario product line and they are best equipped to answer your questions. Please resubmit your question at URL.
If the Decision Graph predicts a single response type with a high semantic compactness, then a fully automated response is possible. If, however, the response type is not complete, or more than one response type have been matched, then a human operator is presented with the response(s). This was generally the case in the trials we conducted. We built Decision Graphs for five datasets that had at least one response type with a high semantic compactness. The resultant graphs had between three and five leaves, most of which pointed to 2-3 response types with varying degrees of certainty.
5.2
Predicting sentence types
Our results indicate that only a small proportion of requests can be addressed with complete model responses. We are currently investigating an alternative approach whereby we map features in users’ requests directly to sentence types, and then compose a reply from sentence types. We believe that this level of granularity will enable our system to exhibit the functionality required for flexibly addressing user requests. The general framework is shown in Figure 4, where a generalization module is used to learn mappings from features in users’ requests to sentence types in the responses to these requests. The former would be similar to the features extracted for the Decision Graph approach, while an example of the latter is a binary pattern similar to the response vector RV defined in Equation 1 (also shown in the middle panel of Figure 1). The generalization module is essentially a supervised
Request features
Response Generalization Module
sentence types
(a) learning mappings between request features and sentence types, using all request-response pairs in the corpus features New Request
Generalization Module
sentence types
(b) predicting a set of sentence types for a new user request Figure 4: Framework for a sentence-type based approach. learning system that is trained on request-response pairs in the corpus (Figure 4(a)). The trained system is then used to predict which sentence types to use in a response to a new user request (Figure 4(b)). These predictions can be interpreted as the support for the sentence types given the request features. The procedure described in Section 3 can then be applied: the SemCom measure can be used to assess the completeness of a response comprising highly supported sentence types (Equation 3), and actual sentences can be scored and selected using Equation 4. For example, we envisage that a feature corresponding to the time since the arrival of the user’s request can predict the usage of the sentence type corresponding to the opening sentences in R1 and R2 (apologizing for the delay in the response). In another example, we envisage that the unigram feature ‘xp’ would predict the usage of two sentence types corresponding to the sentences shown in the example in Section 5.1 (providing a specific address for XP users).
6 Related Research The idea of clustering text and then generating a summary from the clusters has been previously implemented in multi-document summarization systems [Radev et al., 2000; Hatzivassiloglou et al., 2001; Filatova and Hatzivassiloglou, 2004]. A key issue highlighted in such work is the choice of features used in the clustering. Radev et al. used lowlevel word-based features [Radev et al., 2000], while Hatzivassiloglou and colleagues used higher-level, grammatical features obtained through part-of-speech tagging [Hatzivassiloglou et al., 2001; Filatova and Hatzivassiloglou, 2004]. Our work differs from previous work on clustering and summarization in three respects. Firstly, the high-level features (sentence types) we use to cluster documents are learned from the corpus in an unsupervised manner, using as input only lowlevel, word-based features. Secondly, our reliance on sentence types enables us to identify response patterns beyond those identified by topic words, and hence allows us to generate multiple summaries within a single topic. Thirdly, our system avoids the inclusion of incongruous sentences, a restriction that is not traditionally addressed in multi-document summarization. The completion of the user-driven implementation of our system will enable comparisons with other user-driven ap-
proaches, in particular those involving information retrieval (IR) techniques, such as [Berger and Mittal, 2000; Carmel et al., 2000]. It will be interesting to test the effectiveness of our system in situations where a user’s request retrieves multiple responses that do not overlap completely. In such situations, a traditional IR approach of simply finding the most suitable response document will not suffice, instead the response will need to be collated from multiple response documents.
7 Conclusion The framework we are developing for collating help-desk responses from multiple documents is unique with respect to previous work on question answering and user-driven summarization. This is largely due to the nature of our domain, which is characterized by repetition and redundancy in request-response pairs, and by the strict demands placed by users on the relevance and coherence of a response. In addition, a help-desk corpus represents interactions with a typically large community of users, which introduces the scope for generalizing types of interactions, while at the same time affording the personalization of responses. Uncertainty arises in the help-desk domain due to the presence of multiple responses that seem appropriate for a given query. To address this problem, our system extracts as much information for which there is support in the corpus, collating it into a planned response; measures the cohesion and completeness of this response; and produces complete or partial responses that have a high level of confidence. The initial implementation of our system shows that a small fraction of the responses in our corpus can be represented by generic model responses. We have also presented a method for matching users’ requests with model responses. However, in many cases a response to a user’s request will require matching the user’s request to individual sentence types, rather than complete responses, and we are currently investigating this issue. The main application of our framework is the automation (or semi-automation) of help-desk responses. However, we believe that it can have other applications, such as automatic FAQ generation and extraction of answers from newsgroup discussions.
Acknowledgments This research was supported in part by grant LP0347470 from the Australian Research Council and by an endowment from Hewlett Packard. The authors also thank HP for the extensive help-desk data, and Tony Tony for assistance with the sentence-segmentation software.
References [Berger and Mittal, 2000] Adam Berger and Vibhu O. Mittal. Query-relevant summarization using FAQs. In ACL2000 – Proceedings of the 38th Annual Meeting of the Association for Computational Linguistics, pages 294– 301, Hong Kong, 2000. [Carmel et al., 2000] David Carmel, Menachem Shtalhaim, and Aya Soffer. eResponder: Electronic question responder. In CooplS ’02: Proceedings of the 7th International
Conference on Cooperative Information Systems, pages 150–161, Eilat, Israel, September 2000. [Filatova and Hatzivassiloglou, 2004] E. Filatova and V. Hatzivassiloglou. Event-based extractive summarization. In Proceedings of ACL’04 Workshop on Summarization, pages 104–111, Barcelona, Spain, 2004. [Hatzivassiloglou et al., 2001] V. Hatzivassiloglou, J.L. Klavans, M.L. Holcombe, R. Barzilay, M.Y. Kan, and K.R. McKeown. SimFinder: A flexible clustering tool for summarization. In Proceedings of the NAACL Workshop on Automatic Summarization, Pittsburgh, Pennsylvania, 2001. [Lin and Hovy, 2003] C.Y. Lin and E.H. Hovy. Automatic evaluation of summaries using n-gram co-occurrence statistics. In Proceedings of the 2003 Language Technology Conference (HLT-NAACL 2003), Edmonton, Canada, 2003. [Lin, 1998] Dekang Lin. Automatic retrieval and clustering of similar words. In COLING-ACL’98 – Proceedings of the International Conference on Computational Linguistics and the Annual Meeting of the Association for Computational Linguistics, pages 768–774, Montreal, Canada, 1998. [Marom and Zukerman, 2005] Yuval Marom and Ingrid Zukerman. Corpus-based generation of easy help-desk responses. Technical Report 2005/166, School of Computer Science and Software Engineering, Monash University, Clayton, Australia, 2005. [Oliver, 1993] Jonathan J. Oliver. Decision graphs – an extension of decision trees. In Proceedings of the Fourth International Workshop on Artificial Intelligence and Statistics, pages 343–350, Fort Lauderdale, Florida, 1993. [Radev et al., 2000] D.R. Radev, H. Jing, and M. Budzikowska. Centroid-based summarization of multiple documents: sentence extraction, utility-based evaluation, and user studies. In Proceedings of the ANLP/NAACL2000 Workshop on Summarization, Seattle, Washington, 2000. [Salton and McGill, 1983] G. Salton and M.J. McGill. An Introduction to Modern Information Retrieval. McGraw Hill, 1983. [Wallace and Boulton, 1968] C.S. Wallace and D.M. Boulton. An information measure for classification. The Computer Journal, 11(2):185–194, 1968. [Wallace and Patrick, 1993] C.S. Wallace and J.D. Patrick. Coding decision trees. Machine Learning, 11:7–22, 1993.