In: Kokinov, B., Karmiloff-Smith, A., Nersessian, N. J. (eds.) European Perspectives on Cognitive Science. © New Bulgarian University Press, 2011 ISBN 978-954-535-660-5
Towards A Generative Model of Causal Cycles Bob Rehder (
[email protected]) Jay B. Martin (
[email protected]) Department of Psychology, New York University 6 Washington Place, New York, NY 10003 USA Abstract Causal graphical models (CGMs) have become popular in numerous domains of psychological research for representing people’s causal knowledge. Without modification, however, CGMs do not allow representation of causal cycles. Building on previous work, we propose an extension of CGMs that allows cycles, and then apply that representation to one realworld reasoning task, namely, classification. The predictions of our model were assessed in two experiments that tested probabilistic and deterministic causal relations, respectively. The results were qualitatively consistent with the predictions of our model and inconsistent with those of an alternative model.
Causal cycles are ubiquitous. In the domain of economics, we understand that an increase in corporate hiring will increase consumers’ income and thus their demand for products, leading to a further increase in hiring. In the domain of psychology, we expect that clinicians will affect (hopefully help) their clients but also recognize the clients often affect the clinicians. Recent research has used a formalism known as Bayesian networks or causal graphical models (hereafter, CGMs) as a hypothesis for how people learn and reason with causal knowledge. In the domain of learning, there are claims that causal learning amounts to acquiring the structure and/or parameters of a CGM (Cheng, 1997; Gopnik et al., 2004; Griffiths & Tenenbaum, 2005; 2009; Lu et al., 2008; Sobel et al., 2004; Waldmann et al., 1995). And, several models of causal reasoning assume that people honour the inferential rules that accompany CGMs (Holyoak et al., 2010; Lee & Holyoak, 2008; Rehder & Burnett, 2005; Rehder, 2003a; b; 2009; Rehder & Kim, 2006; 2010; Shafto et al., 2008; Sloman & Lagnado, 2005; Waldmann & Hagmeyer, 2005). Unfortunately, however, standard CGMs do not allow the presence of cycles among variables. As a consequence, none of the theories described above are applicable without modification to the many domains in which cycles are present. In this article we take initial steps to extending CGMs to include cycles for one class of reasoning problem, namely, classification. There is a rich literature on how causal knowledge among the features of a category (e.g., in birds, that building nests in trees is caused by flying, that flying is caused by wings, etc.) changes how people classify. We first review evidence for the existence of cycles among category features and one proposal for explaining how they affect classification. We then present our own model for extending CGMs to represent cycles in people’s mental representations of categories. We then report two experimental tests of our account.
Unfolding Cycles One technique used to elicit subjects’ beliefs about the causal structure of categories is the theory drawing task. Subjects are presented with features of a category and asked to draw directed edges indicating how those features are related. Subjects might be asked to draw how features cause one another (e.g., Kim & Ahn, 2002) or, more generally, how they depend on one another (where a causal link is a type of dependency relation: the effect feature depends on its cause, e.g., Sloman et al., 1998). In fact, subjects typically draw large numbers of relations between features, indicating that their representation of categories consist of not only a static list of features but also a rich repository of causal and explanatory knowledge. More importantly for present purposes, these drawings show that causal cycles are common. For example, Kim and Ahn found that 65% of subjects’ representations of mental disorders such as depression included cycles. Sloman et al. found cycles in subjects’ theories of everyday biological kinds and artifacts. In a first attempt to account for how cycles affect categorization, Kim et al. (2009) made two assumptions. The first was that causal knowledge affects classification in a manner specified by the dependency model proposed by Sloman et al. (1998). According to this model, individual features can vary in their importance, or conceptual centrality, such that more central features provide greater evidence for category membership. A feature’s centrality is a function of the category’s interfeature causal relations: A feature is more central to the extent that it has many (direct or indirect) dependents (i.e., effects). Specifically, feature i's centrality ci, can be computed from the iterative equation, ci,t+1 = ∑dijcj,t (1) where ci,t is i's weight at iteration t and dij is the strength of the causal link between i and its dependent j. For example, if a category has three category features X, Y, and Z, and X causes Y which causes Z, then when cZ,1 is initialized to 1 and each causal link has a strength of 2, after two iterations the centralities for X, Y, and Z are 4, 2, and 1. That is, feature X is more important to category membership than Y which in turn is more important than Z. Stated qualitatively, the dependency model predicts this because the features vary in their number of dependents: X has two (Y and Z), Y has one (Z), and Z has none. Kim et al.’s second assumption concerned people’s mental representation of causal cycles. They argued there are two reasons for expecting that people may reason with a simplified representation of a cycle. First, because variables rarely cause each other constantly and simultaneously, it is
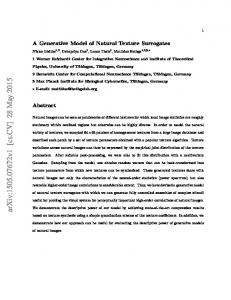
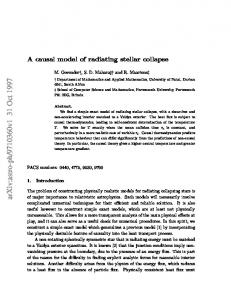
Figure 1. (A) Causal structure tested in Kim et al. (2009). (B) A representation of that structure unfolded one time step. likely that people assume that they influence each other in discrete time steps. Second, because it is implausible that people represent time steps extending into infinity, only a limited number of steps are likely to be considered. For example, for the category in Fig. 1A, feature C causes feature E and features X and Y are related in a causal cycle. Fig. 1B shows the cycle “unfolded” by one time step. The assumption is that in generation 1, X and Y mutually influenced one another, resulting in their states in generation 2 (X2 and Y2). Kim et al. proposed that feature importance would correspond to the predictions of the dependency model applied to the unfolded representation in Fig. 1B, where the centralities of X and Y corresponded to their first generation instantiations (X1 and Y1). For the unfolded representation, features X1, Y1, and C are equally central because they each have one dependent (X2, Y2, and E, respectively) and more central than E, which has zero.1 To test this prediction, Kim et al. instructed subjects on artificial categories. For example, subjects learned about a mental disorder called hadronuria with four symptoms (e.g., easily fatigued, lack of empathy, depersonalization, etc.) that caused each other as in Fig. 1A (e.g., being easily fatigued tends to cause a lack of empathy). To assess feature importance, subjects were then presented with test items described as having all category features except one and asked to rate the likelihood that it was a category member. The categories and the exact wording of the classification test were varied over five experiments. The results, shown in Fig. 2, confirmed the predictions. The test item missing only feature E was rated higher than the one missing C, suggesting that E was less important to category membership than C. (The phenomenon in which “more causal” features are more important to category membership is referred 1
Note that dependency model’s original formulation makes it technically inapplicable to certain causal networks, including the one if Figure 2B. However, Kim et al. proposed new variants of the dependency model that address these issues (e.g., one of the variants computes what is known as alpha centralities). Nevertheless, these variants inherent the same qualitative properties (and problems) as their predecessor (see below).
Figure 2. Classification results from Experiments 2-6 of Kim et al. (2009). to as the causal status effect, Ahn et al., 2000). And, the ratings of the test item missing C did not significantly differ from those missing only feature X or only Y. In another experiment, Kim et al. compared two-feature causal cycles with more complicated acyclic structures and found evidence they interpreted as consistent with their model.
Questions About the Model The empirical results of Kim et al. (2009) are important insofar as they provide an initial assessment of how causal cycles affect classification. Moreover, their model is the first to address the difficult problem of how people represent and reason with causal cycles. Virtually all attempts to address cycles involve “unfolding” them in some manner (e.g., Hayduk, 2009), and our own model below will also incorporate this insight. Nevertheless, as it stands, the Kim et al. model is likely to face a number of difficulties. The first set of difficulties derives from the central assumptions of the dependency model. Although the dependency model predicts how causal knowledge affects the importance of individual features, previous research has shown it has a much larger effect on the combinations of features that are acceptable to category membership. For example, Rehder (2003a; b; Rehder & Kim, 2006; 2010) have demonstrated coherence effects in which good category members are those that exhibit the pattern of interfeature correlations one expects to be generated by causal relations. Coherence effects are likely to have contributed to the Kim et al. results in Fig. 1. For example, a test item missing only feature X was likely given a low classification rating not just because of the importance of feature X but also because its absence violates two causal relations: X is absent despite the presence of Y and vice versa. Moreover, because they differ in how many causal links they violate, differences in the ratings of the four test items may reflect not only differences in the importance of the features themselves but differences in the items’ coherence. For this reason, in addition to not providing an assessment of coherence, these experiments fail to provide an unambiguous measure of the importance of features involved in a causal cycle. A second issue surrounding the dependency model concerns its predictions regarding the strength of causal links.
Figure 3. (A) An improper CGM of the category in Figure 1A. (B) That CGM unfolded one time step. According to that model, a feature’s centrality increases not only with its number of dependents but also with the strength of the links with those dependents (the ds in Eq. 1). For example, as the causal link between feature C and E in Fig. 1 grows stronger, so too should the causal status effect (the centrality of C relative to E). However, research has shown that the causal status effect grows smaller as the strength of the causal link grows larger (Rehder & Kim, 2010). In fact, the model we propose below predicts a stronger causal status effect for weaker causal links., a prediction tested in the upcoming experiments. Finally, the Kim et al. model has what we believe to be a conceptual problem, namely, that there is no principle guiding which time step should be used to compute centralities. To account for the results, the model assumes that the centralities for X and Y in Fig. 1A should correspond to X1 ! and Y1 in Fig. 1B. However, no rationale is provided for why they shouldn’t instead correspond to X2 and Y2. ! In summary, a number of important empirical and theoretical questions remain regarding the effect of causal cycles on categorization. We now present our initial attempt to answer these questions.
Towards A Generative Model of Causal Cycles An alternative account of the effect of causal knowledge is the generative model (Rehder, 2003a; b; Rehder & Kim, 2006). The generative model assumes that interfeature causal relations are represented as probabilistic causal! mechanisms and that classifiers consider whether an object is likely to have been produced or generated by those causal! mechanisms. Objects that are likely to have been generated ! are considered to be good category members and those un! likely to be generated are poor ones. One important advantage of the generative model is that it provides a straightforward account of coherence effects: A population of category members generated by a causal net-
!
work should exhibit the expected pattern of correlations between causally related features. Thus a likely category member is one that maintains those correlations. For example, two features will be correlated (will usually be both present or both absent) when they are directly linked by a causal relation (e.g., C and E in Fig. 1A). In addition, Rehder & Kim (2010) showed that the generative model predicts the observed sensitivity of the causal status effect to causal strength. Specifically, if a causal link is deterministic, then an effect should be at least as prevalent among category members as its cause (and more prevalent when the effect has additional causes), and thus the cause can be less important to category membership decisions than the effect. In contrast, if a causal link is probabilistic, the effect can be less prevalent than the cause, in which case it should have less weight on classification decisions. We now propose an extension to the generative model that addresses causal cycles. Importantly, this proposal builds on the basic insight provided by Kim et al. (2009) regarding the “unfolding” of causal cycles one time step. However, our account will enjoy the advantages of the generative model, including an account of coherence effects and correct predictions regarding the strengths of causal links. The generative model assumes that a category’s causal knowledge is represented as a type of parameterized CGM. For example, a CGM associated with the category in Fig. 1A is presented in Fig. 3A. The causal mechanism between feature C and E is assumed to operate (i.e., to bring about E) with probability mCE when C is present and any other potential background causes of E collectively operate with probability bE. C and E’s background causes are assumed to form a "fuzzy-or" network that together produce E in members of category k conditioned on C with probability, (2) pk ( E = 1 | C = 1) = mCE + bE " mCE bE When C is absent it has no effect on E. (3) pk ( E = 1 | C = 0) = bE The probability of the root cause C is a free parameter cC. As mentioned however, graphs with cycles are not proper CGMs because the standard inferential procedures that accompany CGMs are undefined. For example, there is no analog of Eq. 2 that specifies the probability of X in Fig. 3A conditioned on Y (or vice versa). Accordingly, we work instead with the unfolded representation in Fig. 3B. In this representation, the state of variable X2 is a fuzzy-or function of X1 and Y1, pk ( X2 = 1 | X1 = 1,Y1 = 1) = m X X + mYX " m X X mYX (4) 1
2
pk ( X2 = 1| X1 = 0,Y1 = 1) = mYX pk ( X2 = 1 | X1 = 1,Y1 = 0) = m X1 X 2 pk ( X2 = 1 | X1 = 0,Y1 = 0) = 0
1
2
(5) (6) (7)
An analogous four equations specify how Y2 is a fuzzy-or function of X1 and Y1. To represent that a variable present in generation 1 is guaranteed to be present in generation 2, we assume, (8) m X1 X 2 = mY1Y2 = 1 Finally, we assume no information is available concerning the presence of root causes X1 and Y1, that is, cX = cY = .5.
According to the generative model, an object t is a member of category k, pk(t), is given by joint probability over its observed features X2, Y2, C, and E. For the model in Fig. 3B, (9) pk (t ) = pk ( X2 ) pk (Y2 ) pk ( E | C ) pk (C ) where pk(X2) and pk(Y2) are computed by summing over the possible states of the unobserved variables X1 and Y1,
!
pk ( X 2 ) = "
pk (Y2 ) = "X =0,1 1
!
!
" "
X1 =0,1
Y1 =0,1
pk ( X2 | X1Y1 ) pk ( X1 ) pk (Y1 )
Y1 =0,1
pk (Y2 | X1Y1 ) pk ( X1 ) pk (Y1 )
where pk(X1 = 1) = cX and pk(Y1 = 1) = cY. We now present two experiments testing the predictions of these models, one in which causal links are probabilistic and one in which they are deterministic instead.
Experiment 1: Probabilistic Causal Relations Following Kim et al. (2009), subjects were instructed on a novel category with interfeature causal relations as in Fig. 1A. Those causal links were described as being probabilistic by telling participants that the strength of the causal links was 75%. However, in order to discriminate between the models, this experiment was designed to also test for the presence of coherence effects. This was accomplished by presenting participants with not only test items missing a single feature but also items with all four features (that is, the category “prototype”) and items missing two features: One missing both X and Y and one missing both C and E. According to the generative model, items missing two features can have a higher categorization probability than ones missing only one because the former are coherent whereas the latter are incoherent. To illustrate, Fig. 4A presents the predictions of our model (Eq. 9) for this experiment. We assumed mXY = mYX = mCE = .75, consistent with the experimental instructions. We also assume cC = .70, consistent with the assumption that C is a typical category feature (also part of our experimental instructions), and bE = .20, consistent with the possibility of weak alternative causes of E. These parameter values allow the generative model to reproduce the pattern of ratings for the test items missing only one feature in Fig. 2: The missing-E item has higher categorization probability than the other three items, which are about the same (gray bars in Fig. 4A). Importantly, however, our model also predicts coherence effects: The item missing both X and Y, and the item missing both C and E, have higher categorization probability than the items missing a single feature. Finally, the prototype of course receives the highest categorization probability. The Kim et al. model, in contrast, predicts that an object’s degree of category membership is a monotonic function of its number of features. As a result, it is unable to predict the nonmonotonicity in Fig. 4A where items with two features are more likely category members than those with one. The purpose of Expt. 1 is to test whether subjects in fact exhibit the response pattern in Fig. 4A.
Method Materials. Three novel categories each with four features were tested: Myastars (a type of star), Romanian Rogos (a
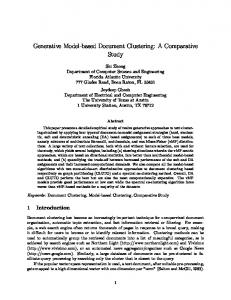
Figure 4. (A) Model predictions. (B) Classification results from Experiment 1. type of automobile), and Lake Victoria Shrimp. Each typical feature was described as occurring in most category members whereas the opposite, non-typical value was described as occurring in some category members. For example, participants were told "Most Myastars have high density whereas some have low density." Participants learned three causal links arranged as in Fig. 1. Each link specified the cause and effect (e.g., "Ionized helium causes the star to be very hot.") and some detail regarding the causal mechanism (e.g., "Ionized helium participates in nuclear reactions that release more energy than the nuclear reactions of normal hydrogen-based stars, and the star is hotter as a result."). In addition, a sentence described the strength of the causal link (e.g., "Whenever a Myastar has high density, it will cause that star to have a large number of planets with probability 75%."). Features 14 of each category were assigned to the causal roles shown in Fig. 1 in four different ways: XYCE, XYEC, CEXY, and ECXY. As a result, each feature appeared in each role an equal number of times across subjects. Procedure. Participants first studied several screens of information about the category. Initial screens presented the category's cover story and which features occurred in "most" versus "some" category members. Features were presented in one order for half the subjects and in the reverse order for the other half. The fourth screen presented the three causal links, including the mechanism and causal strength information. The fifth screen was a diagram similar
to the one in Fig. 1. Subjects were required to pass a multiple-choice test to ensure they learned this information. Participants then rated the category membership of the seven test items shown in Fig. 4A. On each trial, the four dimension values were listed in one of the two counterbalanced orders. Responses were entered by positioning a slider on a scale where the right end was labeled "Sure that it is" (a category member) and the left end was labeled "Sure that it isn’t.” The position of the slider was scaled into the range 0-100. Each test item was presented twice in separate blocks and the order of the trials within a block was randomized for each participant. Participants. 48 New York University undergraduates received course credit for participating in this experiment. There were three between-subject factors: the four assignments of physical features to roles of X, Y, C, and E, the two feature presentation orders, and which of the three categories was learned. Participants were randomly assigned to these 4 x 2 x 3 = 24 between-participant cells subject to the constraint that an equal number appeared in each cell.
Results and Discussion Initial analyses revealed no effects of which category subjects learned, the assignment of features to causal roles, or feature presentation order, and so the classification results are presented in Fig. 4B collapsed over these factors. As expected, the prototype item received a high rating (95.3) indicating that it was viewed as a very likely category member. In addition, the ratings of the four test items with one missing feature were similar to those of Kim et al. (2009) shown in Fig. 2: The item missing only the effect feature E (the “wo/E” item) was rated higher than the one missing only the cause C (“wo/C”), which in turn was rated about the same as those missing one of the cycle features. As predicted by the generative model, the two test items missing two features (either missing both X and Y, or both C and E) were rated lower than the prototype (M = 69.4 vs. 95.3). Importantly, however, they were rated higher than the items missing one feature (M = 33.9). This result reflects the effect of coherence: Although these items have only two typical features, they are consistent with the causal relations (i.e., causally-related features are either both present or both absent). In contrast, items with only one missing feature necessarily have to violate those causal relations and they receive a lower rating as a result. Recall that the Kim et al. model of causal cycles is unable to account for coherence effects. Note that the overall correlation between the observed categorization ratings (Fig. 4B) and those predicted by the generative model (Fig. 4A) was .947. A one-way ANOVA revealed an effect of test item, F(6, 282) = 67.71, MSE = 448.5, p < .0001. The item missing the effect feature E was rated significantly higher than the one missing C (36.9 vs. 31.7), t(47) = 3.64, p < .001, which in turn did not differ from the cycle features, t(47) = 1.28, p > .20. In addition, features missing one feature were rated lower than those missing two, t(47) = 6.07, p < .0001, which in turn was rated lower than the prototype item, t(47) = 7.32, p < .0001. The ratings of the two items missing two features were not significantly different.
Experiment 2: Deterministic Causal Relations The purpose of Expt. 2 was to conduct another test of the models using deterministic causal links (i.e., strength of 100%, the cause always produces the effect). The predictions of the generative model for this experiments with the same parameter values as Expt. 1 are shown in Fig. 5A. The model once again predicts coherence effects (items with only two features have a higher categorization probability than those missing one feature). In addition, the pattern of ratings among items missing a single feature has changed as compared to Expt. 1. The item missing only feature C now has a higher categorization probability than the one missing only feature E, implying that E is more important than C (i.e., a reverse causal status effect is predicted). It predicts this because E is more prevalent than C: C not only always causes E, E has some additional background causes (represented by bE = .20). The dependency model, in contrast, predicts that the size of the causal status effect in Expt. 2 should be larger than that in Expt. 1.
Method The methods were identical to that in Expt. 1 except for the causal strengths of 100%. 48 NYU undergraduates were assigned to the same conditions as in Expt. 1.
Results and Discussion Analyses again revealed no effects of the counterbalancing factors and so the classification results are presented in Fig. 5B collapsed over these factors. The prototype again received the highest rating (96.1). More importantly, the use of deterministic causal links in this experiment resulted in a different pattern of ratings among the test items missing a single feature. Whereas in Expt. 1 the item missing the cause feature C was rated lower than the one missing the effect E (a causal status effect), in Expt. 2 it was rated higher (32.1 vs. 16.7), that is, the reverse causal status effect predicted by the generative model obtained. Recall that the Kim et al. (2009) model predicts the opposite: that the causal status effect in this experiment should be larger than the one in the first experiment rather than smaller. As in Expt. 1, the two items that were missing two features but maintained coherence were rated much higher than the four items missing just one feature (66.6 vs. 21.1). An ANOVA revealed an effect of test item, F(6, 282) = 97.80, MSE = 491.4, p < .0001. The item missing the cause C was rated significantly higher than the one missing E, t(47) = 3.92, p < .001, which in turn did not differ from X and Y, t < 1. In addition, features missing one feature were rated lower than those missing two, t(47) = 8.41, p < .0001, which in turn was rated lower than the prototype, t(47) = 7.76, p < .0001. The correlation between the observed ratings (Fig. 5B) and the predicted ones (Fig. 5A) was .941.
General Discussion We have presented a new model of how people represent causal cycles and applied that model to classification data. Recall that CGMs are used extensively throughout cognition research but are unable to represent cycles among variables.
converge to a steady state. Tests of these and other possibilities await additional theoretical and empirical work.
References
Figure 5. (A) Model predictions. (B) Classification results from Experiment 2. We have built on the insight provided by Kim et al. (2009) that, in people’s minds, cycles may be broken by unfolding them. However, our model is a type of generative model that has been shown to exhibit a number of other favorable qualities, such as accounting for coherence effects and effects of causal link strength. By applying the generative model to an “unfolded” model that breaks cycles, we preserve these advantages. The dependency model, in contrast, is unable to account for either of these effects. This work is at an early stage. At this point our claim is only that our model captures the qualitative trends in human classification judgments. Indeed, comparing our model’s predictions (Figs. 4A and 5A) with the empirical results (Figs. 4B and 5B) suggests that the model might be overpredicting the magnitude of differences in features weights while underpredicting the magnitude of coherence effects. Recall, however, that the predictions were generated assuming arbitrary values for some parameters. Determining whether these discrepancies are theoretically important awaits additional work in which we fit the parameters of the unfolded causal model to these data. A perhaps more fundamental issue concerns the number of time steps a causal cycle is unfolded. Both we and Kim et al. assume one time step, but one might question whether people’s representation of cycles is so simplified. An alternative would be to assume that cycles are unfolded through a large number of time steps but that causal strengths get weaker with each subsequent step, allowing the model to
Ahn, W., Kim, N. S., Lassaline, M. E., & Dennis, M. J. (2000). Causal status as a determinant of feature centrality. Cognitive Psychology, 41, 361-416. Cheng, P. (1997). From covariation to causation: A causal power theory. Psychological Review, 104, 367-405. Gopnik, A., Glymour, C., Sobel, D. M., Schulz, L. E., & Kushnir, T. (2004). A theory of causal learning in children: Causal maps and Bayes nets. Psychological Review, 111, 3-23. Griffiths, T. L., & Tenebaum, J. B. (2005). Structure and strength in causal induction. Cognitive Psychology, 51, 334-384. Griffiths, T. L., & Tenenbaum, J. B. (2009). Theory-based causal induction Psychological Review, 116, 56. Holyoak, K. J., Lee, J. S., & Lu, H. (2010). Analogical and category-based inferences: A theoretical integration with Bayesian causal models. J. of Exper. Psych.: General, 139, 702-727. Kim, N. S., & Ahn, N. S. (2002). Clinical psychologists' theory-based representation of mental disorders affect their diagnostic reasoning and memory. J. of Exper. Psych.: General, 131, 451-476. Kim, N. S., Luhmann, C. C., Pierce, M. L., & Ryan, M. M. (2009). Causal cycles in categorization. Memory & Cognition, 37, 744-758. Lee, H. S., & Holyoak, K. J. (2008). The role of causal models in analogical inference. J. of Exper. Psych.: Learning, Memory and Cognition, 34, 1111-1122. Lu, H., Yuille, A. L., Liljeholm, M., Cheng, P. W., & Holyoak, K. J. (2008). Bayesian generic priors for causal learning. Psychological Review, 115, 955-984. Rehder, B. (2003a). Categorization as causal reasoning. Cognitive Science, 27, 709-748. Rehder, B. (2003b). A causal-model theory of conceptual representation and categorization. J. of Exper. Psych.: Learning, Memory, and Cognition, 29, 1141-1159. Rehder, B., & Burnett, R. C. (2005). Feature inference and the causal structure of object categories. Cognitive Psychology, 50, 264-314. Rehder, B. & Kim, S. (2006). How causal knowledge affects classification: A generative theory of categorization. J. of Exper. Psych.: Learning, Memory, and Cognition, 32, 659-683. Rehder, B. & Kim, S. (2010). Causal status and coherence in causal-based categorization. J. of Exper. Psych.: Learning, Memory, and Cognition, 36, 1171-1206. Shafto, P., Kemp, C., Bonawitz, E. B., Coley, J. D., & Tenebaum, J. B. (2008). Inductive reasoning about causally transmitted properties. Cognition, 109, 175-192. Sloman, S. A., Love, B. C., & Ahn, W. (1998). Feature centrality and conceptual coherence. Cognitive Science, 22, 189-228. Sloman, S. A., & Lagnado, D. A. (2005). Do we "do"? Cognitive Science, 29, 5-39. Sobel, D. M., Tenenbaum, J. B., & Gopnik, A. (2004). Children's causal inferences from indirect evidence: Backwards blocking and Bayesian reasoning in preschoolers. Cognitive Science, 28, 303 -333. Waldmann, M. R., & Hagmayer, Y. (2005). Seeing versus doing: Two modes of accessing causal knowledge. J. of Exper. Psych.: Learning, Memory, & Cognition, 31, 216-227.