munication between nodes is based on the TCP network protocol. The ROS ... is provided with homing capabilities and is able to dock to a recharging station. ..... be able to navigate in absence of light (e.g. at night), so traditional vision based ...
Towards A ROS-Based Autonomous Cloud Robotics Platform for Data Center Monitoring Stefano Rosa, Ludovico Orlando Russo, Basilio Bona Dip. di Automatica e Informatica Politecnico di Torino Corso Duca degli Abruzzi 24, 10129 Torino {name.surname}@polito.it
Abstract
solution increases the risk of hot spots and thus requires better accurate monitoring of temperature and humidity.
Data-center monitoring has been a critical subject of research in recent years. In this paper we present a robotic system, based on the Robot Operating System (ROS), in which a mobile robot equipped with a laser range sensor and an IMU is able to autonomously navigate in a data-center room for accurate monitoring of critical measurements, such as servers’ external temperature, humidity and other physical quantities. The robot is able to autonomously create a map of a previously unknown room, localize therein and execute a list of measurements at different locations, which are provided by the user via a web Graphical User Interface (GUI). The application is based on a cloud robotics infrastructure which encloses the ROS nodes and exposes REST APIs to the user. We discuss our implementation choices with regards to the particular requirements of the scenario, both in terms of robot navigation and software infrastructure, and present some preliminary results in a real scenario.
The dimensions of a typical data-center room makes it very difficult in practice to instrument the whole environment with a dense networks of humidity and temperature sensors. As of now, a solution is to monitor the perimeters of the room, while other parts are periodically inspected by human operators. This increases management costs. Moreover, recording measurements is a repetitive job and has to be carried out in difficult operating conditions, since in a data-center room temperatures ranges from 16o C to 32o C. For these reasons, intelligent monitoring through robotic systems is a good solution to cut down on costs.
1. Introduction In recent years autonomous robots and automated systems have been used more and more in the industrial field [1], [6]. In this paper, we propose an application of these techniques to the well known problem of data-center monitoring. Data-center administrators have to guarantee privacy, robustness and availability of all servers at any time [22]. This is achieved by intense monitoring and diagnostics procedures, that become even more challenging with the increasing dimensions of data-centers. Moreover, data-centers are among the most intensive energy consumption buildings in the world [14, 20, 7]. In particular, energy consumption is due to cooling systems that maintain the machines in safe working conditions and to power used in computing. In order to save energy, temperature is often kept as high as possible, near the maximum admissible for the machines. As a drawback, this
Data-center monitoring refers to all the solutions aimed at measuring environmental variables (usually temperature and humidity) in data-center rooms for monitoring and diagnostics purposes. It has been the subject of several research activities in recent years, devoted to reduce cooling and management costs, but at the same time to reduce machine malfunctions caused by hot spots. Traditionally, data-center rooms are controlled using Computer Room Air Conditioning (CRAC) units aimed at pressurizing a room with cool air. In each room, servers are organized in racks. A single server room contains hundreds of racks, each containing tens of servers. Hence, a datacenter monitoring system have to guarantee efficiency (it should be better in terms of energy consumption and price), scalability (it should be ready for the even bigger dimension of data-centers of the next years) and elasticity (it should be easy to reconfigure also by simply user when changes happen). Early works about data-center energy management have been proposed in [18, 19]. Some of the authors identify inefficiencies in data-center energy management and propose a smart cooling system based on localized cooling and a distributed metrology layer to sense and control temperature and pressure. Other works about efficient monitoring and control are proposed in [21, 5, 16, 10, 17]. However, most of these approaches require to instrument the data-center with a complex sensing network and integrated control knobs. These solutions come with two big
problems, that are scalability and management. In particular, the bigger the size of a data-center is, the more expensive is the sensing and control interface. Moreover, periodical maintenance, verification and calibration are required to ensure the perfect working. Even if some of the cited solutions propose sensing topology that minimized the number of required sensors to monitor the whole room, it is clear that scalability cannot be achieved using a static monitoring network. Mobile solutions have been proposed in order to solve scalability and management problems. For instance, [12, 13] present a Mobile Measurement Technology (MMT) with a mobile sensor cart, which can optionally be integrated with static sensing, for spatially-dense data-center monitoring. Recently, the use of robots has been proposed. In [9] the authors propose a multi-robot system for data-center monitoring, where robots communicate each other wirelessly. Localization is based on NFC Tags placed on the floor. However, this solution requires physical intervention on the environment, i.e., placing the NFC tags. The system does not adapt to changes in the racks position neither is able to work in not instrumented rooms. Moreover, this solution does not provide obstacle avoidance to allow the robots to safely move when people are operating in the room. In [15] the authors propose to use a low-cost autonomous robot for data-center monitoring. In this solution the robot takes advantage of the standard square tiles on the data-center floor for navigation. The robot tries to visit all unobstructed tiles of the data-center. When it visits a tile, it stops in its center and takes measurements. The solution guarantees a complete coverage of the data-center room. The solution is not able react to moving obstacles, neither is able to plan an optimized trajectory in order to measure only a subset of interesting locations. Moreover, the full coverage approach is too slow to guarantee a correct time sampling on each point. Finally, this approach is strongly sensitive to the tiles’ color: it is not suitable with dark tiles as it would be very difficult to recognize edges. In this paper, we propose an application of laser-based mobile service robotics to the well known problem of data-center monitoring based on the Robot Operating System (ROS). ROS [4] is an open-source, meta-operating system for robot software development, providing a collection of packages, software building tools and an architecture for distributed inter-process and inter-machine communication. ROS is nowadays becoming the de-facto standard for robotic software development. The building blocks of ROS-based applications are the so-called nodes. A node is a piece of code which implements a specific functionality. Nodes interact with each other by subscribing or publishing messages on specific ROS topics. Another interaction paradigm, which follows a request/reply model, is based on the so-called ROS services. The communication between nodes is based on the TCP network protocol. The ROS framework makes it easy to write mod-
ular and distributed applications, and is well suited for a cloud robotics scenario. The application takes advantage of a cloud infrastructure that abstracts the underlying services and exposes them as REST APIs and at the same time is able to monitor the condition of the ROS nodes. This paper is organized as follows: Section 2 described the hardware of the robotic platform used in the presented project, Section 3 describes the Software Architecture from a very general point of view, while Section 4 and 5 deepen respectively the application and the navigation layer of the proposed solution; Section 6 presents experiments demonstrating the feasibility of the proposed solution; finally, Section 7 concludes the work and presents ongoing and future works.
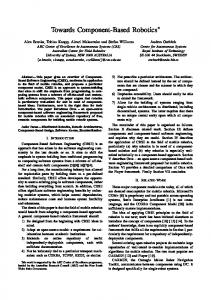
2. Robotic platform In our experiments we used a Corobot Classic mobile robot from Coroware. It is a 4WD rover endowed with wheel encoders, an internal inertial measurement unit (IMU), an Asus XTion camera, front and rear bumpers. The Corobot rover is an open and extendable platform and it is fully compatible with ROS. We also use a Hokuyo URG-04LX laser range finder and an external XSens MTI IMU, which proved to be more accurate than the internal one. The sensors that we use for thermal monitoring are two thermal probes located at different heights and a USB thermal camera. The robot is provided with homing capabilities and is able to dock to a recharging station. The robot has an onboard PC with a 1.6 Ghz CPU and Wi-Fi connectivity. In Figure 1 an image of the robot platform is provided, without the probes and thermal camera.
Figure 1. The robotic platform used in our application.
3. System architecture The software has been developed using the Robot Operating System (ROS) [18] in C++ under Linux. The functional architecture of the approach is shown in Figure 2. The Map Database stores the different maps that have been created by the mapping each different data-center room. Waypoints (goals) and associated tasks to be executed when the robot is on the relative waypoint are stored
in the WP Database. The Web User Interfaces provides interaction with the user via a web browser. The Task Manager block sends the waypoints to the robot. The node also handles the different tasks associated to each waypoint. Finally, it is in charge of collecting environmental data captured by the robot into the WP Database. The Environmental Sensing Manager collects measurements from the environmental sensors. The Localization block provides the pose of the robot inside the map. Finally, the Path Planning block is in charge of finding the best trajectory to reach each waypoint in the map, while avoiding dynamic obstacles. User Web User Interface
Application Layer
WP Database
Map Database
Localization
Task Manager
Waypoints Tasks Measurements
Environmental Sensing Manager
Plath Planning Service Layer Navigation Sensors Laser Scanner IMU Encorders
Actuators Locomotion
Environmental sensors
Hardware Layer
Thermal Camera Thermal Probes
Figure 2. Functional architecture of the proposed solution.
4. Application layer We developed the proposed system in order to expose a simple and intuitive Graphical User Interface (GUI) to the final user. Our platform propose a web-based GUI that allows one or more users to monitor the robot activities, to get informations the robot have collect, and to manage the robot activities by setting new tasks ore delete one, but also by take control of the robot entirely. Moreover, the proposed system and its web GUI is based on a cloud robotics platform, that allows to move part of the robot intelligence in the cloud, in order to both use simpler and cheeper hardware on board the robot and remotely provide information and management tools to user. In this Section we describe in details the GUI of the proposed system (Section 4.1) and the architecture of the Cloud Robotic Platform (Section 4.2). 4.1. Graphical User Interface We developed a web-based graphical User Interface (GUI) which provides an intuitive tool for a user to obtain the data collected by the robot, as well as to monitor the state of the robot and control its motion. The GUI is connected with the underlying ROS nodes via REST APIs which are exposed by the cloud infrastructure described in Section 4.2, and does not depend on ROS: an
user can login into the service via Internet using a modern web browser. The GUI is divided into two different views, as shown in Figure 3. On the left, the Map View provides information about the environment and the robot position and localization state, while on the right, the Control and Information View provides different panels that allows the user to get information and interact with the robot. The Map View shows the map of the current data-center room and the estimated robot location within the map. It also shows the targets points (goals) that the robot is supposed to reach in oder and take measurements. The targets are colored in order to provide quick information about their status. When the target is green, it means that it is in the normal working temperature range; a yellow color shows that the last measured temperature is near to the alert limit, while red color shows that the temperature is over that limit. Finally, a yellow circle indicates a goal in front of the docking station, that the robot automatically reaches when the battery charge is low. The next target the robot is going to reach is highlighted by blinking. In the Control and Information View, the GUI exposes some panels (the Information Panel, the Targets Panel and the Control Panels) that allow the user to look at the collected information and control the path followed by the robot. • The Information Panel provides the collected data relative to the selected target (the user can select the target by simply clicking on it from the Map View): in particular, it provides a plot of the temperature data over time and all the collected thermal images. • The Targets Panel allows the user to create, delete and rearrange targets: to each target it is possible to associate one or more tasks (such as “take a thermal image” or “measure temperature”) that has to be performed when the robot reaches the target. Moreover, it also allows to add forbidden areas where the robot can not pass, for instance, in order to force the robot to avoid areas where technicians are working. • The Control Panels expose low and high level controls that allow to stop, start or pause the monitoring phase (in case of stop, the robot automatically goes to the docking station), to force the robot to reach a specific target (by selecting it from the Map View) and finally to manually tele-operate the robot. In this last case, the user interface also provides video streaming of the camera mounted on the robot, if available.
4.2. The cloud architecture The application is based on a cloud robotics platform. The platform is based on ROS and has been designed to be generic and builds on the concepts of Platform-as-aService (PaaS) presented in Rapyuta [2] and RObotics in CONcert (ROCON) [3].
Figure 3. The Web User Interface. The cloud robotics platform proposed in this paper has been designed in order to abstract the hardware and software layers, to be robust in case of failures (the state of ROS nodes is known), to offload demanding computations and finally to expose simple RESTful APIs to the final user. The cloud robotics platform is important to guarantee the robustness needed for long-term operativity in an industrial application. The infrastructure knows the state of every node of the system and is in charge of distributing the computational load in a remote location which is able to provide better computational performances than the robot’s onboard PC. The basic elements of the developed cloud platform, shown in Figure 4, are:
Figure 4. The platform objects and their relationships.
commands are accessed through the Platform API Manager (PAM) object.
• Node (N): represents the ”building block” of a platform service. Can be installed if it resides in an instance, or started if it resides in a service container. It is connected if it has internal or external endpoints. • Internal Endpoint (IE): connects a node to other nodes in the current service container, or connects a node to an external endpoint.
Figure 5. The Platform Manager logic architecture.
• External Endpoint (EE): belongs to a service container. Connects nodes belonging to different service containers.
The Event Engine (EE) has a set of controlled counteractions triggered when previous configured classes of events occur. This has been conceived to make the platform service robust and resilient. The counteractions can be both service commands (e.g. publish a message) and platform commands (e.g. create a SC). The first ones are accessed by Service API Manager while the second ones are directly accessed by PAM. The counteractions can be created, read and deleted from users and applications throughout the Rule API Manager (RAM). Service API Manager (SAM) is a special node that needs to be started in a SC. It exposes APIs to external world for managing service commands and events.
• Service Container (SC): groups a set of nodes into a service. • Instance: it is the object where the platform manager (PM) and the elements described before reside. The instance can be Normal (NI) when it contains a SC and installed or started nodes; Simple (SI) when it doesn’t contain any SC but only installed nodes. To start the nodes the SI calls a SC inside a NI. Services for enabling robotics applications are built using these objects. This can be enacted by starting nodes (N), which are installed in instances (SI, NI), into Service Containers. The platform services can be accessed by service APIs and can be built by management APIs. The Platform Manager (PM), shown in Figure 5, is in charge of handling the objects described before. The PM can send and receive commands through the Command Manager (CM) object. It can also listen to and create events through Event Manager (EM) object. Events and
5. Navigation layer 5.1. Sensor fusion for odometry Wheel odometry, in particular when using 4 wheel drive rovers, is affected by large drift, mostly due to wheel slipping and approximations in the velocity estimation. We use a fusion of wheel odometry and angular velocity measured by a gyroscope. In particular, we substitute the
Graph Raw data
Graph Creator graph slam Localized scans
LAGO Optimizer Node poses
Map Creator grid mapper
Figure 6. The SLAM algorithm
rotation estimate given by wheel odometry with the rotation given by integration of the gyro’s velocity on the xy plane. Since gyros are affected by bias errors, we perform bias estimation by averaging its value over a moving window whenever wheel odometry shows that the robot is not moving. 5.2. Map creation For the map creation we developed an online laserbased graph optimization SLAM approach. The approach is composed by three parts (Figure 6): the front-end is in charge the construction of a pose graph; the back-end implements a state-of-the-art 2D graph optimizer; the mapper is in charge of the actual map creation. Graph edges are retrieved using scan matching; both covariance and geometric checks are used in order to reject bad matches. Loop closing episodes are detected using scan matching and geometric clues. The obtained graph is fed to a graph optimizer every time a new loop closure is found. In our approach we keep the mapping process separated from the actual SLAM process. Since graph creation and optimization phases are fast, computation time can be considered negligible even for medium and large-scale environments. The most critical part thus becomes the creation of the actual map. By keeping the mapping process separated we ensure scalability for larger environments. Each time the poses from the trajectory are recalculated by the graph optimizer, we feed the new poses, along with the corresponding laser scans attached to a second process, which is in charge of reconstructing the actual gridmap by raytracing the localized laser scans. The trajectory sent to the mapping node can be sub-sampled in order to lower data transfer between processes and computational time. The source code for our SLAM algorithm is available online1 . The values for the parameters that we used In our experiments were found experimentally and set according to Table 1. 1 https://github.com/rrg-polito/rrg-polito-ros-pkg
Table 1. Parameters used for SLAM Parameter Value nodeStep 10 ξth 0.01 m - 0.01 rad ∆L 10 m θth 0.5 rad ∆tth 1 sec �min 0.1 ICP �max 0.3 ICP τρ 2m τθ 0.05 rad ξres 0.15 m - 0.03 rad
5.3. Adaptive Monte-Carlo localization For robot localization we use the well-known Adaptive Monte-Carlo localization (AMCL) first proposed in [11]. Monte-Carlo localization approaches recursively estimate the posterior about the robot’s pose using particle filters. Particle filters are a sample-based implementation of a Bayes filters, which recursively estimate the pose of the robot pt by representing the belief Bel(pt ) using a set χt of n samples (called particles) distributed according to Bel(pt ). The pose estimated by each particle of the set is indicated by pˆti . Basically particle filters realize the recursive Bayes filter using sampling procedures. AMCL approaches implement a technique that reduces the number of needed particles, called KLD sampling [11]. KLD sampling adapts the number of particles by limiting the error introduced by the sample-based representation. The number of particles is chosen so that the distance between the Maximum Likelihood Estimate based on the samples and the true posterior does not exceed a pre-specified threshold �. The distance between the Maximum Likelihood Estimate and the true distribution is measured using the Kullback-Leibler distance. The number of particles at each step i is set to ni =
1 2 χ 2� k−1,1−δ
where χ2k−1,1−δ is a chi-square distribution with 1 − k degrees of freedom. This value is the required number of particles to guarantee that with probability 1 − δ the Kullback-Leibler distance between the Maximum Likelihood Estimate of the position hypothesis and the true distribution is less than �. This is a clear advantage in terms of both memory occupation and computational resources. In our system we used a modified version of the amcl ROS package. In our version of the algorithm global localization is also possible. We use the likelihood field laser sensor model for particle update, since it is faster and better represent sensor readings compared to the classical beam model, it is smooth with respect to small changes in robot position and is better suited for small obstacles. It should be noted that the choice of the AMCL parameters is critical for achieving low localization error,
Table 2. Parameters used for amcl ROS node Parameter Value max particles 10000 min particles 500 laser z hit 0.5 0.5 laser z rand update min d 0.1 0.25 update min a resample interval 1
Table 3. Parameters used for move base node Parameter Value resolution 0.05 inflation radius 0.35 3 transform tolerance path distance bias 1.0
The values for the most important parameters that we use are shown in Table 3. in particular with a challenging scenario. Good localization is crucial for the subsequent path planning. The most important parameter values that we use in our modified ROS implementation of the AMCL algorithm are reported in Table 2. The error in laser readings caused by the metal grids has been modeled in a trivial way by raising the laser z hit value of the likelihood field sensor model. The higher laser z rand value accounts for the presence of glass-covered racks. We experimentally found that a maximum particle size of 10000 is enough for reliable global localization, and a minimum of 500 is enough for modeling the robot pose during position tracking. 5.4. Path planning and obstacle avoidance For path planning we use the move base ROS package. The package implements a two-stages path planning procedure, composed by a global planner and a local planner. Given the current robot pose, the map of the environment, and a goal to be reached, the global planner tries to find a suitable path to the goal using Dijkstra algorithm. Then, the local planner is in charge of locally adjusting the trajectory for moving obstacle avoidance. The local planner is based on the use of a rolling window centered on the robot. Local obstacles are detected using the laser scanner. Then, at each step, a number of local trajectories are simulated and the best trajectory is chosen. At this point, the local planner converts the trajectory to velocity commands for the robot. We found that the exact tuning of the many parameters of the move base package is crucial for correct planning and is moreover very dependent on the environment and the dynamics of the robotic platform. A tradeoff is needed between the ability of the robot to travel in narrow areas (such as narrow corridors between the racks) and the use of safer distance from the obstacles in order to avoid possible collisions. We found in our experiments that the resolution of the rolling window has to be set higher than default and the infation radius has to be set near the minimum possible value in order to ensure the robot will pass also in narrower corridors. The move base package is also heavy on the computational side, so a tradeoff has to be made between accuracy and CPU load if the package is run onboard of the robot.
5.5. Docking and recharge The Navigation layer is also in charge of homing the robot to the recharge station when the battery is low. This is a necessary feature for a long-term autonomous application that has to work for days or weeks without human intervention. The docking system is composed by a physical part, consisting of a station to which the robot is able to dock and a software algorithm for precisely guiding the robot to the station. Since the Corobot platform does not have native docking abilities, we equipped the robot with a series of electrical pins on the front, that allow to recharge the battery when they are in contact with a suitable station, which has metal strips on its surface. However, in order for the pins to be in contact with the metal on the base, the positioning of the robot must be very precise and standard localization and path planning does not offer enough precision for the task. For this reason, we developed an algorithm to guide the robot to the docking station. The algorithm uses the laser scanner and is based on scan matching, and works under the assumption that the initial position of the robot is near to the docking position. For scan matching we use Censi’s Canonical Scan Matcher [8]. The advantage of using laser scanner for docking is twofold: first, we do not need to add another sensor to the platform; moreover, the robot must be able to navigate in absence of light (e.g. at night), so traditional vision based solutions are not suitable. The algorithm architecture is shown in Figure 7. At the beginning, the robot is localized and placed on the docking station and laser range measures corresponding to the docking position are captured and saved into a target scan, as well as the robot’s pose given by localization. The Task Manager block is in charge of starting/stopping the docking algorithm based on the battery level. When the algorithm is active, at each instant the current laser range scan is matched with the target scan and the the robot is controlled in order to minimize the roto-translation between the two scans. As an initial guess for the scan matching algorithm we provide the difference between the current robot pose estimated by the localization algorithm and the pose associated to the target scan. Since the scan is prone to failures, three consistency checks have been implemented: we first check that the covariance estimated by
Figure 7. Docking algorithm architecture. Figure 8. The created map. the Canonical Scan Matcher are small; then we check the ICP error (sum of squared differences between the two scans); finally, we check that the difference between the initial guess and the roto-translation given by scan matching is small. If any of the checks fails, no command is given to the robot. Another check is done on the time it takes for the robot to dock. After a pre-defined time, if the robot had not reached the docking station, it is sent to the last goal and the process is repeated.
6. Experimental results We tested the proposed system in a real Telecom Italia S.p.A. data-center in order to prove the effectiveness of the various components of the navigation system. The system has been tested in two different data-center rooms of medium dimensions during normal daily operations, in presence of workers and small changes in the environment. Only the ROS nodes for interfacing with sensors and actuators run onboard of the rover, while the Navigation and Application layers run on the remote cloud platform. In this early stage the cloud platform is running on a dedicated server equipped with an Intel Xeon processor and 4 Gb of RAM running ROS Groovy. 6.1. Experiment 1 We first tested our SLAM algorithm. As we said before, since we found that the Hokuyo laser scanner is not accurate enough for scan matching in the presence of metal grids and has a shorter range, we used a SICK LMS200 laser scanner for map creation. The map was created by manually tele-operating the robot. The resulting map is shown in Figure 8. The resolution of the map is 0.05 m/pixel. The effect of metal grids and glass panels can be seen as the surfaces of the racks are irregular in some areas. 6.2. Experiment 2 In this experiment we evaluated the performances of position tracking. We measured the localization accuracy in three different points inside the map. The ground-truth (position and orientation of the points) has been measured by hand. Table 4 show that the average position and rotation errors over 2 hours of operation. It should be noted
Table 4. Average localization errors.
Position [m] Rotation [deg]
Average 0.25 3.9
Point 1 0.33 2.3
Point 2 0.18 5.0
Point 3 0.20 4.3
that the error is higher than the ones reported in other industrial applications [23], but are still adequate for the subsequent path planning, as shown in the next experiment. 6.3. Experiment 3 In this experiment we tested localization and path planning performances in another environment with a previously created map. A path composed by a certain number of waypoints was created. The tasks associated with each waypoint were thermal camera image acquisition and temperature measurement. Figure 9 shows the results of a typical experiment. It can be noted that the robot correctly localized itself and was able to follow the given path. The experiments was done in presence of workers moving along the corridors, as well as obstacles which are not present in the oiginal map (open rack doors, carts, etc.).
7. Conclusion In this paper, we proposed an application of laser-based autonomous robot navigation techniques to the problem of data-center monitoring. Our system is embedded in a cloud-based framework based on the Robot Operating System (ROS). We first described a simple GUI for user interaction, then we detailed the cloud robotic platform. Then, we described the navigation algorithm that we used in our system, as well as the choice of parameter values, motivated by the particular characteristics of the environment. We the showed with experimental results how the robot is able to autonomously create a map of a previously unknown room, localize therein and execute a list of measurements at different locations. Ongoing work is been devoted to long-term experiments. Future work will be devoted to autonomous exploration for coverage maximization and to the extension of the system to the multi-
[11]
[12]
Figure 9. Localization and path planning performances. (a) Trajectory followed by the robot, as estimated by localization, is shown in blue. Waypoints are shown as points.
[13]
[14] [15]
robot case. By exploiting teams of robots it should be possible to increase mapping time, coverage of the environment and increase localization robustness.
8
Acknowledgments
This work has been done in collaboration with Telecom Italia Lab.
[16]
[17]
References [1] Kiva systems. Website. http://www. kivasystems.com. [2] Rapyuta: A platform-as-a-service framework for robots. Website. http://rapyuta.org. [3] Robotics in concert. Website. http://http://www. robotconcert.org. [4] Ros (robot operating system). Website. http://www. ros.org. [5] C. E. Bash, C. D. Patel, and R. K. Sharma. Dynamic thermal management of air cooled data centers. In Thermal and Thermomechanical Phenomena in Electronics Systems, 2006. ITHERM’06. The Tenth Intersociety Conference on, pages 8–pp. IEEE, 2006. [6] B. Bona, L. Carlone, M. Indri, and S. Rosa. Supervision and monitoring of logistic spaces by a cooperative robot team: methodologies, problems, and solutions. Intelligent Service Robotics, pages 1–18, 2014. [7] K. G. Brill. Data center energy efficiency and productivity, 2007. [8] A. Censi. An icp variant using a point-to-line metric. In Robotics and Automation, 2008. ICRA 2008. IEEE International Conference on, pages 19–25. IEEE, 2008. [9] W. Choi, K.-W. Park, and K. H. Park. Scout: Data center monitoring system with multiple mobile robots. In Networked Computing and Advanced Information Management (NCM), 2011 7th International Conference on, pages 150–155. IEEE, 2011. [10] R. Das, J. O. Kephart, C. Lefurgy, G. Tesauro, D. W. Levine, and H. Chan. Autonomic multi-agent management of power and performance in data centers. In Pro-
[18]
[19]
[20]
[21]
[22]
[23]
ceedings of the 7th international joint conference on Autonomous agents and multiagent systems: industrial track, pages 107–114. International Foundation for Autonomous Agents and Multiagent Systems, 2008. D. Fox. Kld-sampling: Adaptive particle filters. In Advances in Neural Information Processing Systems 14. MIT Press, 2001. H. F. Hamann, M. Schappert, M. Iyengar, T. van Kessel, and A. Claassen. Methods and techniques for measuring and improving data center best practices. In Thermal and Thermomechanical Phenomena in Electronic Systems, 2008. ITHERM 2008. 11th Intersociety Conference on, pages 1146–1152. IEEE, 2008. H. F. Hamann, T. G. van Kessel, M. Iyengar, J.-Y. Chung, W. Hirt, M. A. Schappert, A. Claassen, J. Cook, W. Min, Y. Amemiya, et al. Uncovering energy-efficiency opportunities in data centers. IBM Journal of Research and Development, 53(3):10–1, 2009. J. Koomey. Growth in data center electricity use 2005 to 2010. The New York Times, 49(3), 2011. J. Lenchner, C. Isci, J. O. Kephart, C. Mansley, J. Connell, and S. McIntosh. Towards data center self-diagnosis using a mobile robot. In Proceedings of the 8th ACM international conference on Autonomic computing, pages 81–90. ACM, 2011. R. Nathuji, C. Isci, and E. Gorbatov. Exploiting platform heterogeneity for power efficient data centers. In Autonomic Computing, 2007. ICAC’07. Fourth International Conference on, pages 5–5. IEEE, 2007. L. Parolini, B. Sinopoli, and B. H. Krogh. Reducing data center energy consumption via coordinated cooling and load management. In Proceedings of the 2008 conference on Power aware computing and systems, HotPower, volume 8, pages 14–14, 2008. C. D. Patel, C. E. Bash, C. Belady, L. Stahl, and D. Sullivan. Computational fluid dynamics modeling of high compute density data centers to assure system inlet air specifications. In Proceedings of IPACK, volume 1, pages 8–13, 2001. C. D. Patel, C. E. Bash, R. Sharma, M. Beitelmal, and R. Friedrich. Smart cooling of data centers. In ASME 2003 International Electronic Packaging Technical Conference and Exhibition, pages 129–137. American Society of Mechanical Engineers, 2003. M. K. Patterson. The effect of data center temperature on energy efficiency. In Thermal and Thermomechanical Phenomena in Electronic Systems, 2008. ITHERM 2008. 11th Intersociety Conference on, pages 1167–1174. IEEE, 2008. P. Ranganathan, P. Leech, D. Irwin, and J. Chase. Ensemble-level power management for dense blade servers. In ACM SIGARCH Computer Architecture News, volume 34, pages 66–77. IEEE Computer Society, 2006. T. Ristenpart, E. Tromer, H. Shacham, and S. Savage. Hey, you, get off of my cloud: exploring information leakage in third-party compute clouds. In Proceedings of the 16th ACM conference on Computer and communications security, pages 199–212. ACM, 2009. J. Rowekamper, C. Sprunk, G. Tipaldi, C. Stachniss, P. Pfaff, and W. Burgard. On the position accuracy of mobile robot localization based on particle filters combined with scan matching. In Intelligent Robots and Systems (IROS), 2012 IEEE/RSJ International Conference on, pages 3158–3164, Oct 2012.