Computing Department, Lancaster University, LA15SQ Lancaster, United Kingdom. â Perceptual Computing ... the-art wearable multi-accelerometer prototypes.
TOWARDS A WEARABLE INERTIAL SENSOR NETWORK Kristof Van Laerhoven†, Nicky Kern⌂, Hans-Werner Gellersen†, Bernt Schiele⌂ † ⌂
Computing Department, Lancaster University, LA15SQ Lancaster, United Kingdom Perceptual Computing and Computer Vision Group, ETHZ, 8092 Zurich, Switzerland
Abstract. Wearable inertial sensors have become an inexpensive option to measure the movements and positions of a person. Other techniques that use environmental sensors such as ultrasound trackers or vision-based methods need full line of sight or a local setup, and it is complicated to access this data from a wearable computer’s perspective. However, a body-centric approach where sensor data is acquired and processed locally, has a need for appropriate algorithms that have to operate under restricted resources. The objective of this paper is to give an overview of algorithms that abstract inertial data from bodyworn sensors, illustrated using data from state-ofthe-art wearable multi-accelerometer prototypes.
sensors to distinguish basic activities of the wearable computer user (6,8).
INTRODUCTION
RATIONALE
To date, wearable computers are primarily used in specific areas, and are certainly not focused to a large audience like the one for mobile phones or handheld computers. Producing tiny, light-weight computers alone is not enough to make wearable computers break through to a wider market.
This section clarifies two design choices that were made not only by the authors, but also in similar wearable computing research.
The properties of wearable computing (as stated in (12) for example), indicate several advantages over computing devices that follow the desktop paradigm: a computer that is always on, which is close to the wearer and has ways to get input without user interaction, has a far better chance of getting to know its owner than regular computers. We therefore assume that making a computing system that ‘perceives’ what its wearer is doing, would be a step forward for wearable computing.
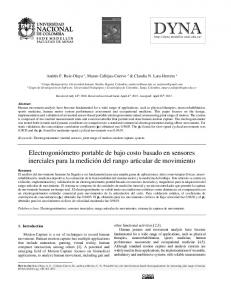
We limit the type of sensor in our research to the acceleration sensor or accelerometer. This sensor can be thought of as a ball that is attached to two springs on opposite sides, and which is placed in a tube to limit its movement in two directions, as depicted in Figure 1. Measuring the position of the ball within the tube is in this metaphor the output of the sensor: shaking the tube to the left and right will move the ball’s position, but tilting it will do so as well (but in a lesser degree). These two effects are called dynamic and static acceleration respectively.
Augmenting a computer with sensors in order to give it some level of insight in what is happening, has been a well-researched topic in AI and robotics and has resurfaced about a decade ago in the field of human-computer interaction (HCI) as context awareness. The goal is to take the strain away from user-interaction and let the computer make decisions autonomously, based on information that was acquired independently from the user via the sensors. Research at Philips (2) concentrated on integration of many small sensors into clothing, while accelerometers were also discovered to be ideal
A range of applications exists in the medical domain, where a patient’s activities might be monitored in combination with other sensing (knowing someone’s activity is crucial in clarifying why the heart rate is suddenly higher, for instance) or for keeping track of a person’s posture in ergonomic applications. Wearable computing scenarios use activity-aware applications in other settings, like meetings (4) or tracking (6). Other future directions might include deducing tell-tale signs for emotions in an individual’s posture and gestures.
Why Accelerometers?
Springs
Tube
Ball
Figure 1. Metaphor for the acceleration sensor, using the location of a ball in a tube that is attached to two springs.
Advantages of a body-network of accelerometers include mainly the cost, power consumption and size of this type of sensor. Other available sensors that might replace or contribute to accelerometers for measuring a person’s body movements, are either more expensive, bigger in size, or require more battery power at the time of writing this paper. Why So Many? The goal of the sensors is to detect motion and position of a person’s body that can be abstracted to a more abstract activity, like sitting, running, or waving. Early research (4, 6, 8) used merely a couple of well-placed accelerometers to distinguish as many of these activities as possible. Among the solutions were placing one or two accelerometers on one hip, or just above one of the knees. This approach is far from error-proof, however: if the sensors are just above the knee for instance, lying on the ground would produce the same sensor values as sitting, and so would lifting the leg the sensors are attached to. A solution would be to attach two more sensors on the other leg, but lying horizontally would still look like 'sitting down' to the system. We can go on like this and even after adding many more sensors of the same type, still come up with situations that make the system incorrectly 'detect' sitting. Having the sensors distributed over the wearer’s body is therefore a straightforward solution in order to make sure that every aspect of the body’s movements and positions will be registered.
The ETH Zurich Sensor Hardware The platform built at ETH Zurich was designed as a more modular, straps-based harness. It is based on smart-its (5), a modular multi-purpose miniature computing platform. Groups of six sensor modules are connected to a smart-it via multiplexers, with each module containing four accelerometers, which can be combined (experiments in this paper used two of these groups, thus giving a total of 2 times 4 sensors per 6 modules = 48 accelerometers). CHALLENGES Noise The main difficulty when translating raw sensor data from sensors in clothing to an activity description is the presence of noise. We differentiate three types of noise: Sensor Noise. This is the distortion of what the actual source looks like (e.g., movement) in the signal that the sensor produces. This includes noise in the electronic circuits around the sensor, and noise introduced during the measurement. Every hardware sensor produces a signal that contains a certain amount of noise. Sensor Distance Noise. We wish to measure movement and position (and in the future maybe other properties) of a person’s body. The sensors, however, are embedded in the person’s clothing. For free-hanging clothing such as skirts, this type of noise will evidently be large, but even tight garments can shift while moving.
HARDWARE PLATFORMS Although the heart of this paper is about the algorithms that can make abstractions from a vast amount of worn sensors, it is necessary to give certain characteristics of the hardware platforms that produce the data. As this paper was a joint effort by two institutions, two distinct, custom-built multi-accelerometer platforms were used. The Lancaster Sensor Hardware The Lancaster multi-accelerometer platform (9) has 30 accelerometers, which are all linked to one microcontroller unit that sends the output straight to a wearable computer’s serial port. Rather than using straps to fasten the sensors to the wearer’s body, the choice was made to embed the accelerometers in trousers and a lab coat. Sensors are grouped per two (in physical packages of the accelerometers).
Time-Domain Noise. The sampling of sensor data might also fluctuate in time, resulting in noise in the time dimension as well. This might complicate things for recognition of gesture-based motion where patterns in time need to be predicted, or where they shift or drift over time (e.g., as walking patterns change slightly as one gets tired). An important factor in both discussed wearable sensor systems is the high number of sensors. This is inevitable as the objective is to measure the wearer’s activity by looking at the motions the body is making. The result: algorithms have to be able to combine or fuse all this data. The algorithms that process the acceleration data become slower and less effective as the number of accelerometers increases. This problem is generally known as the ‘curse of dimensionality’, and is a common obstacle for multi-sensor systems.
Organizing Map, have been applied extensively to analyse the data from wearable sensors, in (9) and (7) for instance. These algorithms map the incoming sensor data to a grid-like map, where similar signals are mapped close to each other on the map, and dissimilar signals are mapped far away from each other. Classification
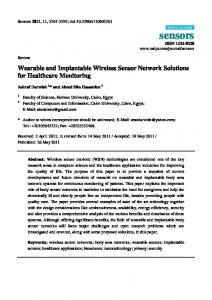
Figure 2. The Lancaster Platform (right) and the ETH Zurich Platform (left). Both were used to capture activity data that were then analyzed at both sites.
Fusion of sensor data Sensor and/or feature selection is the most used method to solve this problem. Not all sensors are equally important to detect a certain activity; walking is mainly detected by leg movement and writing by the arm’s motions, for instance. OVERVIEW OF ALGORITHMS This section gives a short overview on common algorithms that have been used in the past to process data from wearable sensors. Preprocessing Basic statistics, such as the minimum, maximum, average or (co)variance over a certain interval make ideal descriptors for acceleration data. The main advantage is reduction of the data streams: using the aforementioned four values to describe a stream of 100 values, for instance, will make things easier for the algorithms that have to further abstract this information. Peaks in the signals of the accelerometer signals can be expected to reveal a great deal more than the basic statistics discussed before. A promising method is to detect and characterize peaks as soon as they occur. The accelerometer traces can be parsed by first recognizing activity by thresholding the size and length of a running variance. Then, the available peaks within that activity region are measured and roughly classified. Clustering / Topographic Mapping Kohonen Self-Organizing Map. Unsupervised neural networks, such as the Kohonen Self-
Support Vector machines. Loosli et al. (7) use support vector machines (SVMs) to improve on the method in (10), using a selection procedure of parameters. Bayesian Classification. Bayesian classification is a simple classification algorithm based on Bayes’ rule from basic probability theory. It requires labeled training data for the classification. Bayes’ rule states that the probability of a given activity a, given a feature vector x, can be calculated as follows:
p (a | x) =
p ( x | a ) p (a ) p ( x)
p(a) denotes the a-priori probability of the given activity. The a-priori probability p(x) of the data is only used for normalization. It can often be ignored by simply choosing the activity with the highest likelihood as the final classification. The likelihood p(x|a) has to be computed from labeled training data. Graphical Models. Graphical models such as Markov Models are commonly used in combination with previously discussed methods to do additional consistency checks. The Markov Chain was used in (10) for instance to track sequences of activities, such as “sitting” – “standing” – “walking” – “running”, and assign probabilities to these transitions. Kern et al. (4) have used Hidden Markov Models to recognize similar activities. Chambers et al. (11) have used HMMs to recognize Kung-Fu gestures. STUDY: CROSS USAGE OF DATASETS This section describes the results of a cross comparison test between the data sets from authors’ hardware and algorithms, testing data from both platforms on both sites’ algorithms. This is possible since the nature of both hardware configurations is similar enough, using similar sensors and having similar specs. The benefits for this approach include an extra check on the reliability of the data, but more importantly a check for the generality of the algorithms (as they were not prepared for the data).
The intention of this study is not to find out which platform or algorithms are superior (this study is too small for that), but to illustrate the authors’ methods using each other’s ‘unrehearsed’ data and find similarities and common ground in the authors’ research.
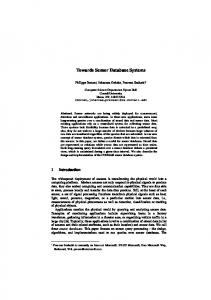
statistics, plus the peak information if the most recent sensor data was part of an area of activity). It is possible to give visual feedback during and after the run through the data set: Figure 4 shows such a visualisation of the created map for the ETH data set by the approach based on topographic mapping.
Datasets data set, 2000 samples, 4 channels, 10-frame, λ=550
We recorded two data sets, one with each hardware platform.
800 1 2 3 4 act
600 400
Lancaster data set. For facilitating further comparison, the Lancaster data set was roughly modelled on the ETH data set, and consists of several activities like lying down on a bed, sitting, standing, walking, stairs up, and stairs down. The accelerometers are attached to the shoulders, upper arms, lower arms, hips, above the knees, below the knees, and above the ankles on both sides, plus an additional one on the chest (two perpendicular sensors per location, see figure 2). Illustration of Methodologies – Mapping Lancaster’s topographic mapping-based method combines topographic mapping algorithms, putting similar sensor data together in categories, with a Markov Chain model that keeps track of sequences of these categories. Before the clustering, however, some pre-processing is done on the data. Apart from simple statistics (minimum, maximum, average and variances per sensor over a window of 50 samples), basic peak-based information per sensor was assembled as well over a varying window. Peak-based Feature Extraction. For detecting the peaks, a two-step algorithm was used that first detects ‘area of activity’ in the data, in which it then starts analysing the peaks per sensor. This method generally works well, although certain limitations apply: the time frame for the area of activity is in practice relatively short (in the order of seconds), and it is not possible to track peaks over multiple dimensions. Topographic Mapping. A combination of the Kohonen Self-Organizing Map, with subhierarchies of k-means clustering layers per cell in the Kohonen Map (as described in 10) was then utilised to further analyse the features (basic
200 0
200 400 600 current activity region
800
1000
580
1200
2000
0
540
520
1400 1600 1800 individual channels
10
560
Peak Information
ETH data set. The ETH data set is a continuous data set lasting ca. 18min and containing the activities: sitting, standing, walking, stairs up, and stairs down. The sensors are attached to shoulder, elbow, wrist, hip, knee, and ankle on both sides of the body (see figure 2).
-10 -20 5
10
global area: (99 unfiltered peaks: 1 -43.1 2 -8.5 3 -18.35 4 -23.25
15
20
150 0.15 75 84.05 39.15
1
168.1
-0.85 -66.5 -65.7 -0.65
81.7)
27.9
0.35
2
3
position: 1174
-5.55
4
size: 20
21.45
-16.95
1.35
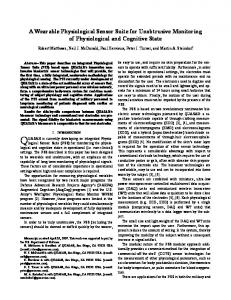
Figure 3. Peak extraction on the ETH data set, part of which is plotted in the top part of the graph, with a specific area of activity visualised in the middle two plots, and information on the detected peaks in the lower part. Only part of the full data set, and only four sensors are visualised for keeping the figure readable.
3
4
2
1
5
Figure 4. Visualization of the Kohonen Map on the ETH data set (known as the U-Matrix), where cells in plateaus of the same colour belong to the various activities in the data set. These different activity plateaus are in fact generated clusters that have been assigned a number in order of occurrence (1-5). The following clusters belong to the activities: 1 – sitting, 2 – standing, 3 comprises both walking up and down the stairs, 4 – walking down the stairs, and 5 - walking.
Table 1 shows the final recognition rate over the entire ETH data set. As this algorithm does one
pass over the data, a lot of the errors occur in the initial phases whenever a new activity presents itself. Apart from a weak performance in distinguishing the “walking up the stairs” and “walking down the stairs” activities, most other errors occur in transitions between activities. Recognized Activity Sit
Sit Stand Walk Lying Stairs Up Stairs Down
Walk
Lying
Stairs Up
Stairs Down
93.22
0.1
2.16
0.05
2.51
1.96
0.14
93.78
4.8
0.04
0.92
0.31
2.74
4.49
74.98
3.77
4.95
9.06
0.19
0.24
1.94
92.62
2.28
2.72
0.18
0.54
16.82
0.92
45.52
36.02
0.41
0.76
14.87
1.03
34.5
48.41
Sit Sit Stand Walk Stairs Up Stairs Down
Stand
92.28 0 1.62
Recognized Activity Stand Walk Stairs Up 0 3.84 1.2 93.11 2.15 1.94 0.56 73.2 12.68
Stairs Down 2.67 2.78 11.94
3.23
2.66
16.64
38.83
38.63
1.28
1.14
8.79
30.88
57.9
Table 1: Recognition Results of the Lancaster (top) and ETH (bottom) data sets using classification on the map that was generated by the Kohonen-based algorithm. The overall recognition is 71.05%
Markov Chain. It made less sense to generate a Markov Chain, as the transitions of activities in the data set are not occurring often enough to extract a valuable model. This method is mainly aimed at providing a second opinion when the system is used for longer periods. Illustration of Methodologies – Naive Bayes The naive Bayes approach uses labelled data to recognize clearly defined activities. A running mean and variance, computed over the last 50 data vectors, is used as features. Lancaster Data Set. The Lancaster data set is divided into three sequences, comprising of the activities lying-sitting-standing-sitting-lying (bed), sitting-standing-walking-stairs (sit), and stairs down-up (stairs). Three Bayes’ classifiers are trained on the entire sequences. A classification is done for every feature vector.
Bed Sit Stairs
Recognized Activity Bed Sit Stairs 92.30 7.61 0.08 1.73 98.20 0.06 1.69 10.71 87.59
Table 2: Recognition Results of the Lancaster Data Set using Bayes’ Classification
Sit Sit Stand Walk Stairs Up Stairs Down
99.27 2.37 2.12
Recognized Activity Stand Walk Stairs Up 0.34 0.33 0.04 96.23 1.39 0 6.48 87.54 0.32
Stairs Down 0 0 3.52
4.44
0.03
18.79
72.98
3.72
4.20
0
15.47
0.01
80.30
Table 3: Recognition Results of the ETH data set using Bayes' Classification. The overall recognition rate is 87.26%.
Table 2 shows the resulting confusion matrix of the recognition. The overall recognition rate is 92.7%. The confusion between sit and stairs is due to the fact that they both contain walking up and down stairs. The same applies to confusion between bed and sit, which both contain sitting and standing. ETH Data Set. Five Naive Bayes classifiers have been trained on the ETH data set. Table 3 summarizes the recognition results. Apart from the activities stairs up and stairs down, the recognition rate is between 87-99%. The principal confusion is between walking and stairs up/down, which is mainly due to the similarity of the three activities. Compared to the topographic mapping approach, the overall recognition rate is improved by 16%. CONCLUSIONS We aimed at giving an overview of up to date research on multi-sensor wearable platforms, specifically focusing on the algorithms that interpret the many streams of data these produce, with a closer view at the approaches of this paper’s authors. This was illustrated by applying the algorithms on data sets that were created using each others’ sensing platforms. Both algorithms have proven that they are suitable for practical use before, and performed well in recognizing a variety of different activities. Both approaches deal differently with noise. The ETH platform has the accelerometers strapped tightly to the body to avoid noise being created by clothing (which is present in the Lancaster
platform). On the algorithms’ side, noise is mainly reduced by using adequate pre-processing, but also by using algorithms that are known to operate well for noisy data. Rather than proving or disproving superiority in the choice of algorithms, the two discussed approaches proved to be built for slightly different application domains. The topographic mapping approach of automatically clustering the data is well suited for applications with activities that are not well defined, that can change over time, or for which there is no labelled training data available. It allows capturing activities that are relatively arbitrary and even can be chosen by the user. The Bayesian approach requires labelled training data and hence needs more effort in the data acquisition phase. Given these labels however, it is possible to recognize activities such as walking, sitting, standing, lying in bed, etc. with high accuracies. In applications where high recognition rates are for a selection of predefined activities, such a supervised approach is usually optimal. In conclusion, we stress that progress in this particular area of multi-accelerometer activity tracking is progressing rapidly. Multi-sensor hardware platforms such as the ones presented here were only constructed in the last year, using components that only recently have shrunk to comfortable sizes. As new iterations of both hardware and algorithms will be put through, we expect to see reliable versions that eventually will go beyond lab experiments and become appropriate for a wider use in wearable computing. ACKNOWLEDGEMENTS This research was in part funded by Equator, an EPSRC funded IRC project, and the Smart-Its Project, funded by the Commission of the European Union (contract IST-2000-25428). REFERENCES 1.
2.
Cakmakci, O., Coutaz, J., Van Laerhoven, K., and Gellersen, H.-W. 2002. Context Awareness in Systems with Limited Resources. In Proc. of the third workshop on Artificial Intelligence in Mobile Systems (AIMS), ECAI 2002, Lyon, France. pp. 21-29. Farringdon, J., Moore, A., Tilbury, N., Church, J., and Biemond, P. 1999. Wearable Sensor Badge & Sensor Jacket for Context Awareness. In Proc. of the Third International Symposium on Wearable Computers, ISWC’99, San Francisco, pp.107-113.
3.
Gellersen, H.-W., Schmidt, A. and Beigl, M. 2002. Multi-Sensor Context-Awareness in Mobile Devices and Smart Artifacts, in Mobile Networks and Applications (MONET), Oct 2002.
4.
N. Kern, B. Schiele, H. Junker, P. Lukowicz, and G. Tröster. 2002. "Wearable Sensing to Annotate Meeting Recordings". In Proceedings of the sixth International Symposium on Wearable Computers, ISWC 2002, Seattle, WA. IEEE Press, pp. 186-194.
5.
Smart-Its: http://ubicomp.lancs.ac.uk/twiki/bin/viewauth/ Smartits/WebHome
6.
Golding, A.R. and Lesh, N. 1999. Indoor navigation using a diverse set of cheap, wearable sensors. In Proceedings of the First International Symposium on Wearable Computers, pp. 29-36.
7.
Loosli, G., Canu, S. Rakotomamonjy, A. 2003. Détection des activités quotidiennes à l'aide des séparateurs à Vaste Marge. RJCIA, France, pp. 139-152.
8.
Randell, C, and Muller, H. 2000. Context Awareness by Analysing Accelerometer Data. In Blair MacIntyre and Bob Iannucci, editors, The Fourth International Symposium on Wearable Computers, IEEE Computer Society, October 2000, pp. 175-176.
9.
Van Laerhoven, K., Schmidt, A., and Gellersen, H.-W. 2002. "Multi-Sensor ContextAware Clothing". In Proceedings of the sixth International Symposium on Wearable Computers, ISWC 2002, Seattle, WA. IEEE Press, pp. 49-57.
10. Van Laerhoven, K., and Cakmakci, O. 2000. What shall we teach our pants? In Proc. of the fourth International Symposium on Wearable Computers, ISWC 2000, Atlanta, GA. IEEE Press, 2000, pp.77-83. 11. Chambers, G., Venkatesh, S., West, G., Bui, H. 2002. Hierarchical Recognition of Intentional Human Gestures for Sports Video th Annotation. In Proceedings of the 16 IEEE Conference on Pattern Recognition, pp. 1082 -1085 vol.2 12. Wearables FAQ at MIT, online: http://wearables.www.media.mit.edu/projects/ wearables/FAQ/