Towards Accurate Detection and Genotyping of Expressed Variants from Whole Transcriptome Sequencing Data Jorge Duitama∗ , Pramod K. Srivastava† and Ion I. M˘andoiu∗ ∗ Department of Computer Science & Engineering University of Connecticut, 371 Fairfield Rd., Unit 2155, Storrs, CT, 06269-2155, USA Tel: +1 860 4863784; Fax: +1 815 3018557; E-mail: {jduitama,ion}@engr.uconn.edu † Department of Immunology and the Center for Immunotherapy of Cancer and Infectious Diseases University of Connecticut Health Center, 263 Farmington Avenue, Farmington, CT 06030-1601, USA E-mail:
[email protected]
Abstract—Massively parallel transcriptome sequencing (RNA-Seq) is becoming the method of choice for studying functional effects of genetic variability and establishing causal relationships between genetic variants and disease. However, RNA-Seq poses new technical and computational challenges compared to genome sequencing. In particular, mapping transcriptome reads onto the genome is more challenging than mapping genomic reads due to splicing. Furthermore, detection and genotyping of single nucleotide variants (SNVs) requires statistical models that are robust to variability in read coverage due to unequal transcript expression levels. In this paper we present a strategy to more reliably map transcriptome reads by taking advantage of the availability of both the genome reference sequence and transcript databases such as CCDS. We also present a novel Bayesian model for SNV discovery and genotyping based on quality scores, along with experimental results on RNA-Seq data generated from blood cell tissue of a Hapmap individual showing that our methods yield increased accuracy compared to several widely used methods. The open source code implementing our methods, released under the GNU General Public License, is available at http://dna.engr.uconn.edu/software/NGSTools/. Keywords-High-throughput sequencing; RNA-Seq; read mapping; variant detection; genotyping
I. I NTRODUCTION Recent advances in sequencing technologies have enabled the completion of a growing number of individual genomes, including several cancer genomes (see [22] for a recent review). While whole-genome sequencing provides a near-complete catalog of variants and individual genotypes, sequencing of mRNA transcripts (RNA-Seq) is becoming the method of choice for studying functional implications of genetic variability [4], [15], [17], [23], [24], [26], [27]. In particular, RNA sequencing is an important source of information for studying the effect of genetic variation on transcription regulation and establishing causal relationships between mutations and disease. For cancer research, comparison of RNA-Seq data generated from normal tissue and tumor samples can provide the information needed to discover driver mutations or to find new therapy targets [14].
Analysis of RNA-Seq data poses several challenging computational problems [6]. First, eukaryotic mRNA transcripts are typically the result of splicing, whereby non-coding regions called introns are removed from the pre-mRNA molecule. This makes the use of tools for mapping of DNA reads to the reference genome like Maq [12] or Bowtie [10] not suitable for finding the genomic location of reads spanning splicing sites. Several methods based on spliced alignment have been proposed to identify splicing sites and assemble full transcripts [1], [9], [16], [18], [25], [26], however these methods incur a high computational cost and require very high sequencing depth, typically with paired reads. Even when accurate read mapping is achieved, differences in transcription levels result in unequal sequencing depths of different transcripts, making it difficult to identify variants in regions transcribed at low levels. Although it is possible to overcome this difficulty by sequencing both genomic DNA and mRNA and identifying variants from the genomic DNA reads using standard methods, when the interest is in expressed variants it is significantly more cost effective to identify them directly from mRNA reads [3]. Our main contributions are an efficient strategy for accurate mapping of mRNA reads and a new method for single nucleotide variant (SNV) detection and genotyping.1 To improve the success rate and accuracy of read mapping, we map mRNA reads against both the reference genome and a transcript library such as the consensus coding sequences (CCDS) database [20] and then combine mapping results using a simple rule set. Our method for SNV detection and genotyping is based on computing, for each locus, conditional probabilities for each of the ten possible genotypes given the reads, and then choosing the genotype with highest posterior probability using Bayes’ rule. The underlying prob1 We use the term SNV instead of the better known term SNP (Single Nucleotide Polymorphism) because SNPs are normally defined relative to a population and imply a minimum minor allele frequency whereas we are interested in finding and genotyping in an individual all sequence variants that do not match the reference genome sequence, regardless of their frequency in the population.
abilistic model assumes independence among reads and fully exploits the information provided by base quality scores. Unlike other widely used Bayesian methods [12], [13], we keep calls for all four possible alleles and do not apply a separate test of heterozygosity. We validated our methods on a publicly available Illumina RNA-Seq dataset generated from blood cell tissue of an individual in the CEU population of the International Hapmap project [5], using as gold standard more than three million SNP genotypes available in the Hapmap database. The results indicate that the combined mapping strategy yields improved genotype calling accuracy compared to performing genome or CCDS mapping alone and that our SNV detection and genotyping method is more sensitive than existing methods for equal levels of specificity. II. MATERIALS AND METHODS A. Mapping strategy for mRNA reads Mapping mRNA reads against the reference genome using standard mapping programs such as Bowtie [10] or Maq [12] does not require gene annotations but leaves reads spanning exon junctions unmapped. Spliced alignment methods such as [1] could theoretically overcome this difficulty but in practice they are computationally intensive and not well suited for very short reads. On the other hand, mapping against a reference transcript library like the Consensus Coding Sequences Database (CCDS) [20] recovers reads spanning known splicing junctions but fails to recover reads coming from unannotated genes. We decided to map reads both against the reference genome and the reference transcript library and to implement a custom rule set for merging the two resulting datasets. We implemented two approaches that we called hard merging and soft merging. For hard merging, we require unique alignments against both references and agreement between them while in soft merging we relaxed the uniqueness constraint by requiring a unique alignment to at least one reference and keeping that alignment. For both approaches we keep reads that map uniquely to one reference and do not map to the other one. Table I summarizes the decision rules applied to each read by each approach, depending on how the read mapped on each reference and on the concordance between the two alignments. One important issue is how to deal with reads aligned to genes with multiple isoforms. After mapping onto the reference transcriptome, multiple alignments can be reported for some reads not because there exist different genomic locations where the read could come from but because the same genomic location is shared by several different transcripts. After mapping against the transcripts database, our module transfers each alignment to absolute genomic coordinates, splicing accordingly if the alignment spans multiple exons, and then checks for each read with multiple alignments if all of them fall into the same
Table I D ECISION TABLE FOR M ERGING OF R EAD A LIGNMENTS Genome Mapping Unique Unique Unique Unique Multiple Multiple Multiple Not Mapped Not Mapped Not Mapped
CCDS Mapping Unique Unique Multiple Not Mapped Unique Multiple Not Mapped Unique Multiple Not Mapped
Agree? Yes No No No No No No No No No
Hard Merge Keep Throw Throw Keep Throw Throw Throw Keep Throw Throw
Soft Merge Keep Throw Keep Keep Keep Throw Throw Keep Throw Throw
genomic location. If that is the case, just one alignment is kept as unique. B. SNV detection and genotyping To discover expressed SNVs in the sample we experimented with SOAPsnp [13] and Maq [12], which are two widely used Bayesian methods implemented in the SAMtools package [11]. We also tried the SNV detection method for mRNA reads called PMA [2], which is based in careful filtering of aligned reads and a binomial test equivalent to setting up a minimum coverage threshold to make a variant call relative to the total locus coverage. The trade-off between sensitivity and specificity of this method is controlled by the maximum p-value required to discard the null hypothesis of absence of a variant allele. In terms of outcome, both SOAPsnp and Maq have the apriori advantage of not just pointing out the loci with variant alleles but also inferring the most likely genotype at each locus. The Bayesian methods also provide for each locus posterior probabilities of having an allele different than the reference and of the genotype itself. Our new Bayesian method, named SNVQ, computes for each locus the posterior probability of each of the ten possible genotypes given the reads. For a locus i we let Ri denote the set of mapped reads spanning this locus. In all Bayesian methods, the posterior probability of a genotype is calculated from its prior and conditional probabilities by using the (Gi ) Bayes rule, P (Gi |Ri ) = P (RiP|G(Ri )P . The main difference i) between models lies in the way conditional probabilities are calculated [7]. Both Maq and SOAPsnp use a different model to calculate probabilities of homozygous and heterozygous genotypes. Maq uses a binomial distribution on the alleles having the two highest counts while SOAPsnp uses a rank test to determine heterozygosity. SOAPsnp also assumes as prior information that the homozygous reference genotype is the most likely one and calculates conditional probabilities based on Illumina specific knowledge about the reads [13]. We decided instead to use a uniform set of assumptions for calculating conditional probabilities of all genotypes. Assuming independence between reads, the conditional prob-
ability of genotype Gi can be expressed Q as a product of read contributions, i.e., P (Ri |Gi ) = r∈Ri P (r|Gi ). For a mapped read r ∈ Ri let r(i) be the base spanning locus i and εr(i) be the probability of error sequencing the base r(i), which we estimated from the quality score q(i) calculated during primary analysis using the Phred formula εr(i) = 10−q(i)/10 [8]. We discarded allele calls with quality scores zero and one. Let Hi and Hi′ be the two real alleles at locus i, or in other words, let Gi = Hi Hi′ . The observed base r(i) could be read from either Hi or Hi′ . If there is an error in this read, we assume that the error can produce any of the other three possible bases with the same probability. Thus, the probability of observing a base r(i) given than the real base is different is εr(i) /3 while the probability of observing r(i) without error is 1 − εr(i) . If Gi is a heterozygous genotype (i.e., Hi 6= Hi′ ) and the observed allele r(i) is equal to Hi (Hi′ ) this outcome could be due to two possible events. Either r(i) was sampled without error from the haplotype containing Hi (Hi′ ) or r(i) was sampled from the haplotype containing Hi′ (Hi ) but an error turned it to be equal to Hi (respectively Hi′ ). Assuming that both haplotypes are sampled with equal probability, the first event happens with probability (1 − εr(i) )/2 while the second happens with probability εr(i) /6. Using the fact that for homozygous genotypes the probability of observing each possible base does not depend on the haplotype from which the reads are sampled, we obtain the following formula for computing the probability of observing read r for each possible genotype:
P (r|Gi = Hi Hi′ )
=
1 − εr(i) εr(i) 3
1
2
−
εr(i) 3
, if Hi = Hi′ = r(i) , if Hi 6= r(i) ∧ Hi′ 6= r(i) , otherwise
Note that no matter which is the genotype Gi , the sum of the probabilities P (r|Gi ) over the four possible values of ri is equal to one. We complete the model by setting prior probabilities based on the expected heterozygosity rate h as follows (in all our experiments, we assumed a heterozygosity rate h = 0.001):
P (Gi =
Hi Hi′ )
=
(
1−h 4
h 6
, if Hi = Hi′ , otherwise
Finally, a variant is called if the genotype with highest posterior probability is different than homozygous reference. In the next section we show a comparison of results among these methods by reanalyzing a publicly available dataset. C. Software and performance issues We implemented mapped read merging strategies and SNVQ in Java 1.6 and we packed both programs with a
Table II M APPING STATISTICS ( MILLION READS ) Sample Id SRR002052 SRR002054 SRR002060 SRR002055 SRR002063 SRR005091 SRR005096 Total
Raw Reads 12.6 12.9 25.7 11.4 23.0 13.9 14.4 113.9
Transcripts Mapping 2.9 3.9 4.4 3.7 3.5 3.3 0.6 22.4
Genome Mapping 4.3 5.7 6.7 5.5 5.6 4.9 1.0 33.8
Hard Merge 4.5 5.9 7.0 5.6 5.8 5.0 1.1 34.9
Soft Merge 4.7 6.2 7.3 5.9 6.0 5.2 1.1 36.4
few additional utilities in a single jar file. The open source code, released under the GNU General Public License, is available at http://dna.engr.uconn.edu/software/NGSTools/. In order to enable integration with other analysis tools we use the SAM format [11] for both the input and the output of mapped read merging. We also sort alignments by chromosome and absolute position to enable efficient processing in subsequent modules and fast merging of results from different lanes if available. SAM files produced by the merging module can be used directly as input for the SAMtools package [11] to produce run statistics, pileup information, and for variants detection. We recommend to run the merging process lane by lane because it needs to load all unique alignments in memory in order to sort them at the end of the process. We used space efficient data structures that allow us to process more than ten million reads in a few minutes, using up to 16Gb of memory. The code implementing SNVQ is able to receive as input either alignments in SAM format or pileup information in the format described in the SAMtools package. The pileup format is recommended because it enables faster processing and reduces the memory requirements. Our experiments indicate that SNVQ is able to process a whole transcriptome pileup file in about 20 minutes using a single processor and up to 4Gb of memory. III. RESULTS A. Methods comparison We tested the performance of the combined mapping strategies and SNV detection methods on publicly available 33 bp long Illumina mRNA reads generated from blood cell tissue of the Hapmap individual NA12878 [5] (NCBI SRA database accession numbers SRX000565 and SRX000566). We used Bowtie [10] to map the reads against both the human reference genome (NCBI Build 37.1, downloaded from the UCSC hg19 genome browser database [21]) and the CCDS transcript library [20]. Table II shows results in terms of reads uniquely mapped using each considered method. Accuracy was determined using as gold standard 3, 371, 552 Hapmap SNP genotype calls for NA12878, including 2, 008, 415 that are homozygous for the reference
35000
4500
30000 4000
25000 True Positives
True Positives
3500
Transcripts
3000
Genome SoftMerge
2500
HardMerge
20000
15000
SNVQ
10000
SOAPsnp
2000
Maq
5000
PMA
1500 0
20
40
60
80
100
120
False Positives
0 0
500
1000
1500
2000
False Positives
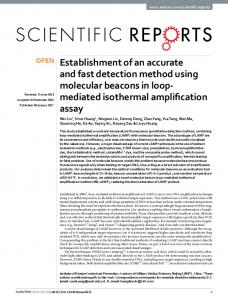
Figure 1. Genotype calling accuracy for reads aligned uniquely to the reference genome, reads aligned uniquely to the CCDS transcripts, hard merged alignments, and soft merged alignments (41,961 Hapmap SNPs in CCDS exons using SNVQ for genotype calling)
allele, 802, 472 that are heterozygous and 560, 665 that are homozygous for the non-reference allele. To measure accuracy of genotype calling, we defined as true positive a correctly called heterozygous or homozygous non reference SNP and as false positive an incorrectly called homozygous SNP. We did not consider as error a heterozygous SNP called homozygous or not called because this can be due to lack of read coverage for one or both alleles. We consider that one method is more accurate than another when it is able to detect more true positives for the same number of false positives, or conversely if it detects the same number of true positives with fewer false positives. To assess the accuracy of various mapping strategies, we ran SNVQ on datasets consisting of reads mapped uniquely onto the CCDS transcript library and onto the reference genome, respectively reads mapped by the hard and soft merging strategies presented in the methods section. Since for reads mapped on transcripts it is only possible to detect SNVs in transcripts included in the CCDS database, we excluded from this comparison all Hapmap SNPs located outside of annotated CCDS exons. Figure 1 shows that our merging strategies produce more accurate results than just genome or transcripts mapping for the NA12878 data. Although in this comparison suggests that genome mapping could be more sensitive than the merging strategies for some specificity levels, we confirmed by repeating the comparison on the full set of Hapmap SNPs that merging methods dominate for all levels of specificity (data not shown). Since the performance of the hard and soft merging strategies is very similar, further results are presented only for the former method.
Figure 2. Accuracy comparison among four different SNV detection methods on the Hard Merged reads. A total of 3,371,552 Hapmap SNPs with known genotypes for the individual NA12878 were used as gold standard for comparison. The tradeoff between sensitivity and specificity is controlled in the Bayesian Methods (SNVQ, SOAPsnp, and Maq) by varying the minimum probability of having a genotype different than the reference, while in PMA it is controlled by varying the maximum p-value required to discard the null hypothesis of absence of variants
In order to compare Bayesian methods with PMA, we ran all methods on the set of reads aligned by the hard merge method. Since PMA only performs SNV detection, for this comparison we define as true positive a detected heterozygous or homozygous non reference SNP, no matter which is the actual genotype call, and as false positive a homozygous reference SNP marked as having a variant. Thus, calling as heterozygous a homozygous not-reference SNP is considered a true positive for SNV detection, because the variant was detected, but a false positive for genotype calling because an inexistent reference allele is being called. Figure 2 shows that all Bayesian methods have significantly better SNV detection accuracy than PMA and SNVQ is slightly more sensitive than SOAPsnp and Maq at different specificity levels obtained by varying the threshold on the genotype probability reported by each method. Figure 3 shows that the accuracy gain of SNVQ over SOAPsnp and Maq is more pronounced for genotyping accuracy. We confirmed this behavior by running the Bayesian methods on the set of reads mapped uniquely onto the genome reference (data not shown). Our results indicate that the binomial tests of heterozygosity employed by Maq and SOAPsnp result in under-calling true heterozygous loci. These heterozygous loci are found by SNVQ thanks to its unified model based on computing conditional probabilities for every possible genotype.
25000
and to extend our model by incorporating allele specific expression of isoforms [27]. We also plan to integrate additional transcript annotation sources such as dbEST and UCSC, and to integrate our methods in a bioinformatics pipeline enabling personalized cancer immunotherapy based on tumor transcriptome sequencing.
True Positives
20000
15000
V. ACKNOWLEDGEMENTS This work has been supported in part by NSF awards IIS0546457 and IIS-0916948
SNVQ 10000 SOAPsnp
R EFERENCES
Maq 5000
[1] F.D. Bona, S. Ossowski, K. Schneeberger, and G. R¨atsch. Optimal spliced alignments of short sequence reads. Bioinformatics, 24(16):174–180, 2008.
0 0
500
1000
1500
2000
False Positives
Figure 3. Accuracy comparison among three different Bayesian methods for genotyping on the Hard Merged reads. A total of 3,371,552 Hapmap SNPs with known genotypes for the individual NA12878 were used as gold standard for comparison
B. Accuracy for different expression levels In RNA-Seq reads are sampled from transcripts roughly proportionally to their relative expression levels. To assess the effect of expression level on genotyping accuracy we calculated RPKM (Reads per Kilobase per Million Reads) values for every exon in the CCDS database based on the hard merged alignments. For each exon, we counted the number of reads that span it partially or totally and then we normalized the count by dividing it by the size of the exon in kilobases. We finally divided that number by the total number of reads in millions (34.9 for the hard merged dataset). We defined the RPKM value of each heterozygous and homozygous non reference Hapmap SNP in a known exon as equal to the RPKM of the exon to which it belongs. We finally grouped variants into bins according to their RPKM values and computed genotyping accuracy of SOAPsnp, Maq, and SNVq for each bin. Figure 4 shows that, as expected, all methods have poor sensitivity for variants with low RPKM. SNVQ consistently outperforms the other two methods, with most pronounced gains at intermediate coverage depths. IV. CONCLUSION In this paper we propose several techniques that increase sensitivity of detecting and genotyping expressed sequence variants using RNA-Seq data. Experiments on publicly available datasets show that our methods outperform widely used SNV detection methods, and that transcriptome sequencing can indeed provide a cost effective method for analyzing these variants. In future work we seek to integrate our tools with methods for estimating isoform expression levels [19]
[2] I. Chepelev, G. Wei, Q. Tang, and K. Zhao. Detection of single nucleotide variations in expressed exons of the human genome using RNA-Seq. Nucleic Acids Research, 37(16):e106, 2009. [3] E.T. Cirulli, A. Singh, K.V. Shianna, D. Ge, J.P. Smith, J.M. Maia, E. L. Heinzen, J.J. Goedert, and D.B. Goldstein et al. Screening the human exome: a comparison of whole genome and whole transcriptome sequencing. Genome Biology, 11(5):R57, 2010. [4] N. Cloonan, A.R. Forrest, G. Kolle, B.B. Gardiner, and G.J. Faulkner et al. Stem cell transcriptome profiling via massivescale mRNA sequencing. Nature Methods, 5(7):613–619, 2008. [5] The International HapMap Consortium. A second generation human haplotype map of over 3.1 million SNPs. Nature, 449(18):851–861, 2007. [6] V. Costa, C. Angelini, I. DeFeis, and A. Ciccodicola. Uncovering the complexity of transcriptomes with RNA-Seq. Journal of Biomedicine and Biotechnology, 2010:853916, 2010. [7] A. V. Dalca and M. Brudno. Genome variation discovery with high-throughput sequencing data. Briefings in Bioinformatics, 11(1):3–14, 2010. [8] B. Ewing and P. Green. Base-Calling of automated sequencer traces using phred. II. error probabilities. Genome Research, 8:186–194, 1998. [9] M. Guttman, M. Garber, J.Z. Levin, J. Donaghey, J. Robinson, X. Adiconis, L. Fan, M.J. Koziol, A. Gnirke, C. Nusbaum, J.L. Rinn, E.S. Lander, and A. Regev. Ab initio reconstruction of cell type–specific transcriptomes in mouse reveals the conserved multi-exonic structure of lincRNAs. Nature Biotechnology, 28(5):503–510, 2010. [10] B. Langmead, C. Trapnell, M. Pop, and S.L. Salzberg. Ultrafast and memory-efficient alignment of short DNA sequences to the human genome. Genome Biology, 10:R25, 2009. [11] H. Li, B. Handsaker, A. Wysoker, T. Fennell, and J. Ruan et al. The sequence Alignment/Map format and SAMtools. Bioinformatics, 25(16):2078–2079, 2009.
100% 90% 80% 70% 60% 50% 40% 30% 20% 10%
RPKM < 1
1 < RPKM < 5 TPHomoVar
Figure 4.
5 < RPKM < 10 TPHetero
FP
10 < RPKM < 50 FNHomoVar
50 < RPKM < 100
SNVQ
Maq
SOAPsnp
SNVQ
Maq
SOAPsnp
SNVQ
Maq
SOAPsnp
SNVQ
Maq
SOAPsnp
SNVQ
Maq
SOAPsnp
SNVQ
Maq
SOAPsnp
0%
RPKM > 100
FNHetero
Percentage of true positive, false positive, and false negative alleles for different bins of RPKM values
[12] H. Li, J. Ruan, and R. Durbin. Mapping short DNA sequencing reads and calling variants using mapping quality scores. Genome Research, 18(1):1851–1858, 2008. [13] R. Li, Y. Li, X. Fang, H. Yang, J. Wang, K. Kristiansen, and J. Wang. SNP detection for massively parallel whole-genome resequencing. Genome Research, 19:1124–1132, 2009.
[20] K. Pruitt, J. Harrow, and R.A. Harteet al. The consensus coding sequence (CCDS) project: Identifying a common protein-coding gene set for the human and mouse genomes. Genome Research, 19:1316–1323, 2009. [21] B. Rhead, D. Karolchik, R.M. Kuhn, A.S. Hinrichs, and A.S. Zweig et al. The UCSC genome browser database: update 2010. Nucleic Acids Resarch, 38(suppl 1):D613–D619, 2010.
[14] C.A. Maher, C. Kumar-Sinha, X. Cao, S. Kalyana-Sundaram, B. Han, X. Jing, L. Sam, T. Barrette, N. Palanisamy, and A.M. Chinnaiyan. Transcriptome sequencing to detect gene fusions in cancer. Nature, 458(5):97–101, 2009.
[22] M. Snyder, J. Du, and M. Gerstein. Personal genome sequencing: current approaches and challenges. Genes & Development, 24:423–431, 2010.
[15] S. Marguerat and J. B¨ahler. RNA-seq: from technology to biology. Cellular and Molecular Life Sciences, 67(4):569– 579, 2009.
[23] M. Sultan et al. A global view of gene activity and alternative splicing by deep sequencing of the human transcriptome. Science, 321(5891):956–960, 2008.
[16] J.C. Marioni, C.E. Mason, S.M. Mane, M. Stephens, and Y. Gilad. RNA-seq: An assessment of technical reproducibility and comparison with gene expression arrays. Genome Research, 18:1509–1517, 2008.
[24] F. Tang, C. Barbacioru, Y. Wang, E. Nordman, and C. Lee et al. mRNA-Seq whole-transcriptome analysis of a single cell. Nature Methods, 6(5):377–382, 2009.
[17] R. Morin, M. Bainbridge, A. Fejes, M. Hirst, M. Krzywinski, T. Pugh, H. McDonald, R. Varhol, S. Jones, and M. Marra. Profiling the HeLa S3 transcriptome using randomly primed cDNA and massively parallel short-read sequencing. Biotechniques, 45(1):81–94, 2008. [18] A. Mortazavi, B.A. Williams, K. McCue, L. Schaeffer, and B. Wold. Mapping and quantifying mammalian transcriptomes by RNA-Seq. Nature methods, 5:621–628, 2008. [19] M. Nicolae, S. Mangul, I.I. Mandoiu, and A. Zelikovsky. Estimation of alternative splicing isoform frequencies from RNA-Seq data. In M. Singh and V. Moulton, editors, Proc. 10th Workshop on Algorithms in Bioinformatics, Lecture Notes in Computer Science, pages 202–214, Sept. 6-8 2010.
[25] C. Trapnell, L. Pachter, and S.L. Salzberg. TopHat: discovering splice junctions with RNA-Seq. Bioinformatics, 25(9):1105–1111, 2009. [26] C. Trapnell, B.A. Williams, G. Pertea, A. Mortazavi, G. Kwan, M.J. Baren, S.L. Salzberg, B.J. Wold, and L. Pachter. Transcript assembly and quantification by RNASeq reveals unannotated transcripts and isoform switching during cell differentiation. Nature biotechnology, 28(5):511– 515, 2010. [27] B.B. Tuch, R.R. Laborde, X. Xu, J. Gu, and C.B. Chung et al. Tumor transcriptome sequencing reveals allelic expression imbalances associated with copy number alterations. Plos One, 5(2):e9317, 2010.