Towards an Efficient Two-Step Hilbert Algorithm for Helical Cone-Beam CT. Harald Schöndubeââ , Karl Stierstorferâ , Frank Dennerleinâ, Timothy A. Whiteâ¡, and ...
Towards an Efficient Two-Step Hilbert Algorithm for Helical Cone-Beam CT Harald Sch¨ondube∗† , Karl Stierstorfer† , Frank Dennerlein∗ , Timothy A. White‡ , and Fr´ed´eric Noo∗
Abstract—We investigate helical cone-beam reconstruction using differentiated backprojection on π-lines and a subsequent inverse Hilbert transform. We report in particular on an implementation scheme that allows efficient reconstruction in the geometry of current Multi-Slice-CT scanners. This scheme is based on reconstruction on “theoretical” π-lines (π-lines that would have been measured in a continuous measurement system but are not actually measured because only a finite number of projections are measured in practice) and thus allows us to specify the sampling of the backprojection grid independently of the sampled source positions. We have identified six significant variations within our implementation scheme, which differ mainly in the way the DBP is implemented. We provide a description of all six variants of the algorithm and evaluate their advantages and disadvantages and give examples of reconstructions of the FORBILD thorax phantom. Index Terms—Helical Cone-Beam CT, Two-Step Hilbert algorithm, π-line.
I. I NTRODUCTION In the field of Computed Tomography (CT) the idea of a two-step Hilbert reconstruction algorithm, consisting of a Differentiated Backprojection (DBP) followed by an inverse Hilbert transform (HT), has recently received attention as a method of exact image reconstruction. See [1]–[4] for various presentations of this HT-DBP method. The HT-DBP method is especially attractive because it allows reconstruction from both laterally and transversally truncated data. Furthermore, for Helical Cone-Beam CT (HCBT) it requires only the data within the Tam-Danielsson (TD) window [5], [6]. Most of the HT-DBP algorithms for this geometry are designed to reconstruct data along so-called “πlines”, i.e. lines which intersect the vertex path twice, with the two intersection points separated by less than one helix turn. This allows reconstruction everywhere within the ROI as it can be proved that each point inside the helix lies on one and exactly one π-line [5]. The first works on HT-DBP [1]–[4] were tailored for the flat detector, however, Zou et al. recently published the details of the transformation to the practically more significant case of a curved detector geometry [7]. Moreover, Yu et al. lately introduced a rebinning version of the two-step Hilbert algorithm to the pseudo-parallel “wedge” geometry [8], [9] using ∗ Department of Radiology, University of Utah, Salt Lake City, USA † Siemens Medical Solutions, Forchheim, Germany ‡ Idaho National Laboratory, Idaho Falls, USA This work was supported in part by the U.S. National Institutes of Health (NIH) under grants R21 EB000568 and R01 EB000627, and in part by Siemens Medical Solutions. Its contents are solely the responsibility of the authors and do not necessarily represent the official views of the NIH.
a flat detector [10]. However, due to the complex geometry of π-lines it has remained largely unclear until today whether π-line based HT-DBP algorithms could be made practical in a way that they are suitable for currently manufactured medical Multi-Slice CT (MSCT) scanners, e.g. allowing an efficient reconstruction with an arbitrary reconstruction grid in the xy-plane and supporting the slice thickness concept. In this work we present an implementation scheme for HTDBP reconstruction on π-lines that was developed following the ideas presented in [11] for implementing Katsevich’s formula for exact HCBT [12]. This scheme is adapted for data acquired using a curved detector and is based on reconstruction on what we call “theoretical” π-lines (i.e. on a subset of the unlimited set of π-lines that would have been measured in a continuous measurement system, as opposed to “real” πlines that connect only source positions where projections are actually measured). This choice enables the reconstruction grid to be varied freely in the (x, y)-plane. We have identified six significant variations within our implementation scheme. In the following we concentrate on a description of all six variants of the algorithms and subsequently discuss their advantages and disadvantages (section III). An evaluation of these variants against each other is being performed by measurements of resolution and noise along with reconstructions of the FORBILD thorax phantom. We present our first results in section IV. II. G EOMETRY A. Data acquisition This section gives a short overview of the geometry and notation used in this report. The vertex path is given as a(λ) = [R0 cos(λ + λ0 ), R0 sin(λ + λ0 ), z0 + hλ]
(1)
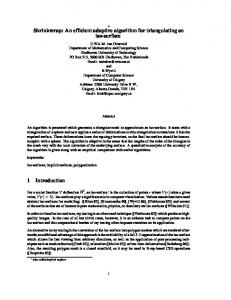
where λ is the rotation angle of the source in the interval [0, λmax ], R0 is the helix radius and 2πh the helix pitch. The vertex path is adjusted by λ0 and z0 such that at λ = 0 the source is located at angle λ0 in the plane z = z0 . Apart from the standard (x, y, z) geometry, we also use a coordinate system rotating with the data acquisition system as depicted in figure 1. The orthonormal basis of this coordinate system is given by the vectors eu (λ) ev
= [− sin(λ + λ0 ), cos(λ + λ0 ), 0] , = [0, 0, 1] ,
(2) (3)
ew (λ)
=
(4)
[cos(λ + λ0 ), sin(λ + λ0 ), 0] .
The detector consists of an array of Nrows × Ncols elements, which are, column-wise, arranged parallel to ev and, row-wise,
(ˆ γ , w) ˆ
(γ, w) = (0, 0) ev eu
La ew
es (λfilt ) = [− sin(λfilt + λ0 ), cos(λfilt + λ0 ), 0] , eτ (λfilt ) = [− cos(λfilt + λ0 ), − sin(λfilt + λ0 ), 0] .
γˆ D
x zo +
Pλ 2π
y
λ + λo
Fig. 1: Data acquisition geometry. forming arcs around a line La parallel to the z-axis through the vertex point. Despite of being counted in the direction of eu and ev , respectively, the detector units are denoted by the angle γ and w, as the detector does not lie fully in the plane defined by eu and ev . We furthermore denote with D the distance from the line La through the focal point to the detector and with f (x) the 3D object density to be reconstructed. In our notation the measurements are obtained as Z ∞ f (a(λ) + tα(λ, γ, w))dt g(λ, γ, w) = (5) 0
with
(D sin γ eu (λ) − D cos γ ew (λ) + w ev ) √ . (6) D2 + w2 The upper and lower boundary of the TD window in this geometry are given by [11]: α(λ, γ, w) =
wtop = −
Dh π/2 + γ , R0 cos γ
wbottom =
(8) (9)
In other words, s denotes a signed distance of the projections of the π-lines onto the (x, y)-plane from the origin, and τ is a coordinate along those projections. We furthermore introduce a variable t along the π-lines such that the projection of t onto the (x, y)-plane yields τ . The z-position of a point indexed by (s, τ, λfilt ) is then given by ! π τ (π/2 − arcsin (s/R0 )) p z = z0 + h λfilt + + . (10) 2 R02 − s2
z
a(λ)
thus π-lines defined by the same λfilt are not parallel in the z dimension. Accordingly, a set of π-lines as in figure 2 does not define a plane in space, but merely a twisted surface in space. Yet, using proper interpolation we can still do reconstruction using these surfaces. For indexing onto each π-line surface we use a (s, τ )-grid which is obtained by rotating the x- and y-axes such that
Dh π/2 − γ . R0 cos γ
(7)
B. Arrangement of the backprojection geometry For backprojection we need to change the standard (x, y, z)geometry so that we can work on sets of parallel theoretical π-lines. We restrict ourselves, with no loss of generality, to working on π-lines having a positive slope and re-arrange the reconstruction volume to a stack of surfaces of “parallel” π-lines. Fig. 2 depicts one such surface. Each surface is indexed by a vertex position λfilt , where a(λfilt ) denotes the starting point of a π-line which intersects with the z-axis (see again fig. 2). All π-lines on a given surface have their projections on the (x, y)-plane parallel to each other, and λfilt defines the direction of these lines. Note, however, that by construction every π-line intersects the vertex path twice and
For a given volume (x, y, z) this equation also allows us to determine the range of λfilt , over which backprojection should be carried out to cover the volume of interest. We then set the distance between the surfaces of π-lines over which backprojection is carried out to ∆λfilt = ∆z/h,
(11)
where ∆z is the desired voxel size in z. The backprojection grid can be arranged in two different ways: 1) The grid is laid out on an arbitrary (s, τ )-grid, and backprojection is directly performed in this (s, τ, λfilt ) coordinate system. The final reconstruction is then obtained by applying the inverse HT in the same geometry and a subsequent interpolation to the (x, y, z)-grid. 2) The backprojection is still done on the surface of theoretical π-lines, but the grid is laid out on a (x, y)-grid, resulting in a (x, y, λfilt ) coordinate system. The backprojection result then is interpolated to the (s, τ, λfilt ) system for the inverse HT and finally to the (x, y, z)grid. The second method has the advantage that the (x, y)-positions of the voxels to be reconstructed do not change over λfilt , which accelerates backprojection. However, due to the additional interpolation needed for the inverse HT, image quality has to be closely monitored. III. A LGORITHMS AND I MPLEMENTATION S TRATEGIES A. Inversion of the Hilbert Transform In contrast to a standard filtered backprojection (FBP) approach, the differentiated backprojection (DBP) does not directly result in a theoretically exact reconstruction of f (x), but merely in a Hilbert transform of f (x) along the πlines described above. Implementing a two-step Hilbert reconstruction thus includes finding a good way to apply an inverse HT to the backprojection result. A method of doing so has been suggested earlier [13], and thus will be just sketched
z et τ
y s x
λfilt
Fig. 2: Reconstruction geometry. shortly. In the following we will denote the outcome of the backprojection as (Hf )(x) and the final reconstruction as fˆ(x). As stated in [14], an inverse HT along the direction of a unit vector α for a function with limited support can be achieved by use of " −1 ˆ f (x + tα) = p C(x) + ... (t − tmin )(tmax − t) # Z tmax (Hf )(x + t0 α) p 0 0 ... + (t − tmin )(t0max − t) dt , t − t0 tmin (12) / (tmin , tmax ). The function C(x) can if f (x + tα) ≡ 0 for t ∈ be computed in different ways: see, e.g. [3], [10], [13]. For our implementation, we found it easiest to set R∞ 2 · −∞ f (x + tα) dt , (13) C(x) = − π as we can get a good approximation of this value directly from the measured data. We implement eq. 12 the way it was suggested in [3], [13] using a rectangular apodization window and a half-pixel shift of the output to avoid aliasing artifacts. B. Differentiated Backprojection (DBP) The different variants of implementing the DBP presented in this work can be divided into three classes: 1) Taking the derivative with respect to detector coordinates only. As this method requires backprojection with a squared distance weight, we have dubbed it “DBP-2”. 2) Taking the derivative of the measured data with respect to λ at fixed ray direction. This “DBP-1” method requires no square in the backprojection weight. 3) Rebinning the data to the pseudo-parallel wedge geometry first and doing differentiation and backprojection in that geometry. This “DBP-0” method requires no backprojection weight. Together with the two different methods of creating the backprojection grid described in section II-B this makes an overall of six different versions of DBP-HT. In the following
we will present the different variants of the DBP used in our work and details of their implementation. 1) DBP-2: This approach of implementing the DBP is presented in detail in [3]. It features differentiation only in detector coordinates and a backprojection weight of the square of the distance from the current voxel to the vertex point, projected onto the (x, y)-plane. For a curved detector geometry we have [7] " 2 1 X (−1)q g(λq , γ ∗ (λq , x), w∗ (λq , x)) (Hf )(x) = − 2π q=1 kx − a(λq )k # Z λ2 (x) DgF (λ, γ ∗ (λ, x), w ∗ (λ, x)) + dλ (14) η(λ, x)2 λ1 (x) with λ1 (x) and λ2 (x) denoting the first and second intersection of the π-line through x with the vertex path, and with η(λ, x) = R0 − x cos(λ + λ0 ) − y sin(λ + λ0 ), (15) � � y cos(λ + λ0 ) − x sin(λ + λ0 ) γ ∗ (λ, x) = arctan , (16) η(λ, x) D cos(γ ∗ (λ, x)) w∗ (λ, x) = (z − z0 − h λ) , (17) η(λ, x) and cos2 γ ∂¯ sin γ ∂¯ g g + cos γ(h − R0 w ) (18) D ∂γ D ∂w √ where g¯ = g¯(λ, γ, w) = (D/ D2 + w2 ) g(λ, γ, w). For reconstruction of one surface of π-lines we first compute the z value of each voxel on the desired (s, τ ) or (x, y) grid. The backprojection for each surface of π-lines indexed by λfilt is then carried out over the interval λ ∈ [λfilt − γFOV , λfilt + π + γFOV ], where γFOV = arcsin(RFOV /R0 ) with RFOV denoting the radius of the field-of-view. To handle the voxel dependence of the range of projections over which the backprojection is carried out we use a technique suggested and described in detail in section 4.3.5, eqs. (59)–(64) of [11]. We also use this technique to estimate the boundary terms in (14). 2) DBP-1: The implementation of this variant is the same as the one for Katsevich’s algorithm presented in [11] up to a replacement of the filtering step by a differentiation with respect to λ at fixed ray direction. Because of space limitations we do not give details in this abstract, however we will provide them in the final presentation. 3) DBP-0: The third approach of implementing the DBP is based on a rebinning of the measured data to a pseudo-parallel geometry according to gF (λ, γ, w) = R0
ϑ(λ, γ) = λ +
π − γ, 2
sr (λ, γ) = R0 sin γ,
(19)
with w remaining untouched during rebinning. The backprojection formula after rebinning can be shown to be Z ϑfilt +π 1 D · g¯rb (ϑ, s∗r (ϑ, x), w ∗ (ϑ, x)) p (Hf )(x) = − dϑ 2π ϑfilt D2 + (w∗ (ϑ, x))2 (20)
with ∂ grebin (ϑ, sr , w), (21) ∂sr s∗r (ϑ, x) = x cos(ϑ + ϑ0 ) + y sin(ϑ + ϑ0 ), (22) ∗ D (z − z − h (ϑ − π/2 + arcsin (s /R ))) 0 pr 0 w∗ (ϑ, x) = y cos(ϑ + ϑ0 ) − x sin(ϑ + ϑ0 ) + R02 − s∗r 2 (23)
g¯rb (ϑ, sr , w) =
and ϑfilt = λfilt + π/2 and ϑ0 = λ0 + π/2. As can be seen, this approach reduces the filtering to a single derivative ∂/∂sr , which constitutes a great advantage for the implementation. Furthermore, both the backprojection weight and the voxeldependence of the backprojection range within any given surface of π-lines are eliminated. After deciding in favor of a (s, τ )- or (x, y) backprojection grid and computing the z values of the voxels accordingly, we therefore can run the integration directly over the interval [ϑfilt , ϑfilt + π] without further worrying about the reconstruction range. For implementing the integration as a sum in this context we suggest using the well-known trapezoidal rule. IV. R ESULTS Due to lack of space we are only able to show a few selected results here. For comparing the different versions of the DBP, we present reconstructions of the FORBILD thorax phantom using the different algorithms. We simulated helical cone-beam data with and without Poisson noise corresponding to an emission of 500 000 photons per ray, with R0 = 57 cm, D = 104 cm and 1160 projections per turn with a helix pitch of 6.58 cm. The curved detector consists of 673×64 elements with a size of 0.14083 × 0.13684 cm2 . The reconstructed images presented here all have a size of 600 × 383 square pixels of side 0.007 cm and the inverse HT was perfomed along the image columns. Fig. 3 compares two different reconstructions obtained using DBP-1 in the plane z = −0.065 cm, whereat the backprojection was carried out on a (x, y)-grid for the first one, on a (s, τ )-grid for the second one. Fig. 4 compares two reconstructions without added noise on a surface of πlines with no interpolation in z at λfilt = 3π/2. The first one was obtained by using DBP-2, the second one by using DBP-0. Fig. 5 finally shows the same reconstructions as in fig. 4, but with Poisson noise added to the data before starting reconstruction. Note that we have not yet performed any resolution matching and only a few noise measurements, so these figures constitute an illustrative result only at this time. However, we plan to have performed these investigations by the time of the conference.
Fig. 3: Reconstructions obtained using DPB-1 on a (x, y)-grid (left) and on a (s, τ )-grid (right). Scale -100...100 HU.
Fig. 4: Reconstructions without added noise obtained using DPB-2 (left) and DBP-0 (right). Scale -100...100 HU.
[4] Y.Ye et al., “A general exact reconstruction for cone-beam reconstruction CT via backprojection-filtration,” IEEE Trans. Med. Imag., vol. 24, no. 9, pp. 1190–1198, 2005. [5] P.Danielsson et al., “Towards exact reconstruction for helical conebeam scanning of long objects. a new detector arrangement and a new completeness condition,” in Proc. 1997 Meeting on Fully 3D Image Reconstruction in Radiology and Nuclear Medicine (Pittsburgh, PA), D.Townsend et al., Eds., 1997, pp. 141–144. [6] K.Tam et al., “Exact cone-beam CT with a spiral scan,” Phys. Med. Biol., vol. 43, pp. 1015–1024, 1998. [7] N.Zuo et al., “Chord-based image reconstruction in cone-beam CT with a curved detector,” Med. Phys., vol. 33, no. 10, pp. 3743–3757, Oct. 2006. [8] K.Stierstorfer et al., “Weighted FBP - a simple approximate 3D FBP algorithm for multislice spiral CT with good dose usage for arbitrary pitch,” Phys. Med. Biol., vol. 49, pp. 2209–2218, 2004. [9] D.Heuscher et al., “Redundant data and exact helical cone-beam reconstruction,” Phys. Med. Biol., vol. 49, pp. 2219–2238, 2004. [10] L.Yu et al., “A rebinning-type backprojection-filtration algorithm for image reconstruction in helical cone-beam CT,” in Proc. 2006 IEEE Medical Image Conference (San Diego, CA), 2006. [11] F.Noo et al., “Exact helical reconstruction using native cone-beam geometries,” Phys. Med. Biol., vol. 48, pp. 3787–3818, Nov. 2003. [12] A.Katsevich, “Analysis of an exact inversion algorithm for spiral conebeam CT,” Phys. Med. Biol., vol. 47, pp. 2583–2597, 2002. [13] F.Noo et al., “A two-step hilbert transform method for 2D image reconstruction,” Phys. Med. Biol., vol. 49, pp. 3903–3923, 2004. [14] S.G.Mikhlin, Integral equations and their applications to certain problems in Mechanics, Mathematical Physics and Technology. New York: Pergamon, 1957, pp. 126–131.
R EFERENCES [1] Y.Zou et al., “Exact image reconstruction on PI-line from minimum data in helical cone-beam CT,” Phys. Med. Biol., vol. 49, pp. 941–959, 2004. [2] ——, “An extended data function and its backprojection onto PI-lines in helical cone-beam CT,” Phys. Med. Biol., vol. 49, pp. N383–N387, 2004. [3] J.Pack et al., “Cone-beam reconstruction using the backprojection of locally filtered projections,” IEEE Trans. Med. Imag., vol. 24, no. 1, pp. 70–85, Jan. 2005.
Fig. 5: Reconstructions obtained using DPB-2 (left) and DBP0 (right) with Poisson noise added before reconstruction. Scale -100...100 HU.