investigations on verifying the lateral autopilot of a Model 24 Learjet subsonic business jet (SBJ) [4]. ... the softwar
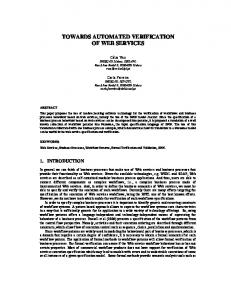
Towards Flight Control Verification Using Automated Theorem Proving William Denman, Mohamed H. Zaki, Sofi`ene Tahar, and Luis Rodrigues Department of Electrical & Computer Engineering Concordia University, Montreal, Quebec, Canada {w denm,mzaki,tahar,luisrod}@encs.concordia.ca
Abstract. To ensure that an aircraft is safe to fly, a complex, lengthy and costly process must be undertaken. Current aircraft control systems verification methodologies are based on conducting extensive simulations in an attempt to cover all worst-case scenarios. A Nichols plot is a technique that can be used to conclusively determine if a control system is stable. However, to guarantee stability within a certain margin of uncertainty requires an informal visual inspection of many plots. To leverage the safety verification problem, we present in this paper a method for performing a formal Nichols Plot analysis using the MetiTarski automated theorem prover. First the transfer function for the flight control system is extracted from a Matlab/Simulink design. Next, using the conditions for a stable dynamical system, an exclusion region of the Nichols Plot is defined. MetiTarski is then used to prove that the exclusion region is never entered. We present a case study of the proposed approach applied to the lateral autopilot of a Model 24 Learjet.
1
Introduction
Modern commercial passenger aircraft are extremely complex systems and their designs must meet strict design and safety requirements. The Federal Aviation Administration (FAA) specifies that the catastrophic failure rate of a passenger aircraft digital flight-control system must be extremely improbable (less than 10−9 faults per hour) [1]. However, the system must be built using embedded computers, sensors, actuators and control components each with individual failure rates several orders of magnitude higher than that of the level set by the FAA. A combination of redundancy and fault tolerance must therefore be used to achieve this strict reliability requirement. In general, aircraft are verified using simulation methods. A mathematical model based on the physical equations of flight is constructed and then simulated. An extensive analysis of the experimental results is necessary to ensure a robust result. There are several graphical aids such as Nyquist diagrams and Nichols plots [9] that are commonly used to simplify this task. These techniques provide easily identifiable zones for which the plot should not pass near or enter, clearly indicating the control system’s margin of stability [11]. However these graphical methods still require visual analysis to process the information. M. Bobaru et al. (Eds.): NFM 2011, LNCS 6617, pp. 89–100, 2011. c Springer-Verlag Berlin Heidelberg 2011 �
90
W. Denman et al.
Even though there are over 78,000 flights without incident per day [10], we cannot assume that the current verification methods are perfectly sound. The first issue with this conclusion is that with simulation alone it is not possible to give 100% safety assurance due to the great number of variations of the model components and parameters. There will always be the possibility of a catastrophic failure due to design errors. Second, to achieve the FAA’s failure rate a complex multi-domain, labour intensive and costly process must be undertaken. It is therefore quite important to investigate methods that will reduce the effort and cost of the verification process while ensuring the reliability of the results. Formal verification is a method where logical reasoning can be used to prove that the implementation of a system correctly matches its design specification. Unlike simulation, a formal proof is valid regardless of the input test cases. There have been several breakthroughs in formal analysis of discrete systems. Systems of large orders of magnitude can now be verified. The tools and methods available for the formal verification of continuous and hybrid-systems cannot handle systems at the same level of complexity. This is one major hurdle that has limited the application of formal methods to the physical portion of aeronautical models. MetiTarski [2] is an automatic theorem prover for real-valued analytical functions, including trigonometric and exponential functions. It works by a combination of resolution inference and algebraic simplification, invoking a decision procedure (QEPCAD) [5] to prove polynomial inequalities over the real closed filed (RCF). The output of MetiTarski is a complete proof that contains algebraic simplification and decision procedure calls that can be verified using other tools. This paper illustrates a methodology for ensuring the stability of a flight control system by performing a formal analysis of a Nichols plot using the MetiTarski automated theorem prover. A Nichols plot is a transfer function’s gain plotted versus its phase. Information about the stability of a system can be deduced from a visual inspection of the plot. The formal analysis we present removes the need for drawing and checking the Nichols plot visually. We present our investigations on verifying the lateral autopilot of a Model 24 Learjet subsonic business jet (SBJ) [4]. The control system model was implemented in Simulink and the goal of our proposed verification methodology is to supplement design work-flows that depend on the Matlab/Simulink Control Systems Toolbox [15]. The rest of the paper is organized as follows, we first discuss related work in Sect. 2. A description of MetiTarski and its syntax is presented in Sect. 3. Details of the proposed methodology are given in Sect. 4. This is followed by the case study in Sect. 5, before concluding the paper with Sect. 6.
2
Related Work
The bulk of the work on formal verification for aeronautical systems has been on the software components of flight control. Nevertheless, there have been several interesting advancements on the verification of hybrid systems [16]. From those
Towards Flight Control Verification Using Automated Theorem Proving
91
latest results and experiments, it is obvious that they will ultimately play a strong role in the complete formal verification of aircraft autopilots. Hardy [7] developed and implemented a decision procedure to reason about functions that have a finite number of inflection points. This decision procedure was implemented in the Nichols plot Requirements Verifier (NRV) to perform an automated formal Nichols plot analysis. The tool was developed using the computer algebra system Maple, the formal theorem prover PVS and the quantifier elimination system QEPCAD [5]. NRV was successfully applied to two classic control system examples: an inverted pendulum and a disk drive reader. Our work is closely related to that of Akbarpour and Paulson [3] who successfully formally verified these two examples using MetiTarski. Our main contribution is to remove the required inflection point analysis. We prove over all frequency values that the exclusion region is not entered, not just at single points. This is particularly important when dealing with exclusion regions that are not bounded by linear constraints. In particular, in the analysis of ellipsoid exclusion regions Hardy’s [7] inflection point analysis does not hold. SOSTOOLS [14] is a Matlab toolbox that can convert difficult optimization problems into a sum of squares formulation that can then be analyzed by a convex optimization technique known as semi-definite programming. It has widespread use in the nonlinear control field. In particular, it can be used to search for a Lyapunov function that can be used to verify the stability of dynamical systems. For a particular equilibrium to be stable, it is required that the candidate Lyapunov function V be positive definite and its derivative with respect to time be negative semi-definite [8]. SOSTOOLS can be used to prove the un-satisfiability of systems of non-linear polynomial equations and inequalities over the real numbers [12]. For many problems, SOSTOOLS could replace QEPCAD as the polynomial reasoning engine under MetiTarski. This would not be trivial to implement effectively. Nevertheless, improvements to the theory behind SOSTOOLS would have the potential to enhance MetiTarski.
3
MetiTarski : An Automated Theorem Prover
There exist few methods to automatically prove statements involving inequalities of elementary functions such as arctan, ln and sqrt that commonly appear in flight control verification problems. MetiTarski replaces the functions with upper and lower bounds in an attempt to reduce the problem to one that is decidable over the real closed fields. It consists of a resolution theorem prover (Metis) combined with a decision procedure (QEPCAD). The theorem prover is supplied with axioms approximating the functions with continued fraction expansions which in many cases are extremely accurate. 3.1
MetiTarski Input Syntax
MetiTarski operates on the first-order formula in the Thousands of Problems for Theorem Provers (TPTP) format that includes the corresponding axioms. Take
92
W. Denman et al.
for instance the code in Fig. 1. The “fof ” keyword indicates to MetiTarski that the logic language used is a first-order formula. It is then followed by a label of the proof as well as the keyword “conjecture” indicating that the following formula is to be proved with the included axioms. The conjecture is read as follows: For all (!) X between 0 and 2.39 × 10⁻⁹ the formula is always less than 0.03. For a syntax guide see Table 1.
fof( example1,conjecture, ! [X] : ( (0 y< y> y< x< x>
12 5 π + 18 from (− 4 π, 3) to (−π, 6) 5 − 12 π − 18 from (− 4 π, −3) to (−π, −6) 3 − 12 π − 6 from (− 4 π, 3) to (−π, 6) 12 3 π + 6 from (− 4 π, −3) to (−π, −6) − 45 π − 43 π
To perform the verification of a flight control system, we propose the methodology described in Fig. 3. First, the flight control system is modeled in Simulink. This will require that the complete dynamics of the aircraft also be modeled. Then using MATLAB’s linmod [15] function, the open-loop transfer function of the system can be automatically extracted. An exclusion region of the Nichols plot is then chosen. In general, the exclusion region is chosen from previous experience; depending on the response required from the aircraft, different exclusion region bounds can be chosen. The basic exclusion region is one that assures that the system is stable. In addition,
Towards Flight Control Verification Using Automated Theorem Proving
95
Fig. 3. Verification Methodology
the bounds can be even more tightly chosen to determine the quality of the flight control in terms of handling and response to pilot commands. This will be discussed in more detail below. The following step is the conversion of the bounds of the exclusion region (in terms of decibels and radians) into inequalities described in terms of the transfer function (frequency domain) using Maple. MetiTarski is first used to verify the results that Maple produces. The resulting expressions for each boundary of the exclusion region are then processed by MetiTarski which automatically generates a proof if it can determine that the inequality holds. This resulting proof indicates that the Nichols plot curve never enters the defined exclusion region. If MetiTarski is successful, it delivers a proof and we are done. If unsuccessful, it will run until terminated by the user. In the most recent version of MetiTarski (v1.8) it is possible for the user to specify a CPU time limit on the proof. In the event of the CPU limit being reached, we must consider modifying the exclusion region. This has the effect of reducing the required stability margins. A relaxation of the exclusion region can be performed automatically when the CPU limit is reached. The benefit of this method compared to other aeronautical verification methods is two-fold. First, there is no need to visually inspect any of the plots. If MetiTarski returns that the proof is true then we can be sure that the specification is met. MetiTarski also operates automatically on the continuous range of variables.
96
5
W. Denman et al.
Case Study : Model 24 Learjet SBJ
To illustrate the application of the proposed methodology, we consider a part of a lateral autopilot design for a Model 24 Learjet subsonic business jet (SBJ) [4]. The SBJ is modeled in Simulink by combining blocks that describe rigid body dynamics and lateral aerodynamic forces. This implementation uses 3 degrees of motion (DOM) equations that have been decoupled from the longitudinal motion terms. This is possible by assuming that derivatives of lateral forces dependent on longitudinal forces are negligible and that all other force and torque derivatives are at trim. At trim, there is no rotation about the center of gravity of the aircraft. For a pilot, it is often difficult to control an aircraft at high altitude because of high frequency yaw oscillations. Yaw is defined as the side to side motion of an aircraft’s nose. In this case study, we are analyzing the SBJ model described above that uses a yaw damper, also commonly known as a washout filter, to augment the stability of the system. Figure 4 shows a simplified view of the system. The block SBJ4 encapsulates the rigid body dynamics and the lateral aerodynamic forces and moments of an aircraft. We are specifically analyzing the response of the heading angle phi to a deflection of the aileron da, dr is the input to the rudder deflection, r is the yaw rate, p is the roll rate and psi is the heading angle. The washout filter was then place around this block in a feedback configuration. The first step in the analysis is to extract the transfer function from the Simulink model. In this case study we focus only on the analysis of the response between the aileron displacement da and the roll angle phi. Using Matlab’s linmod function, the following transfer function G(s) is extracted from the model, G(s) =
1.065×10⁻¹⁴ s6 +3.776 s5 +19.0633 s4 +24.543 s3 +21.7634 s2 −7.263×10⁻¹⁵ s s7 +7.695 s6 +20.3724 s5 +26.492 s4 +22.0224 s3 +0.0442 s2
The input to linmod is the Simulink design where an input port and an output port have been explicitly defined. The output is a state space model, x˙ = Ax +
v
1 In1
0.1
da p
Hphi r
phi dr
phi
1 Out1
psi
SBJ4 Washout3 s s+1
Fig. 4. Flight Control Simulink Model
Towards Flight Control Verification Using Automated Theorem Proving
97
Bu, y = Cx+Du. Then using the Matlab command ss2tf , the state space model is converted into a transfer function G(s) and G(jw) is obtained by replacing instances of the variable s with jw. The gain and phase of the system with the transfer function G(jw) are computed as described in (1) and (2), see Sect. 4. The next step is to select the exclusion region of the Nichols plot as described before. At the most basic level, we can choose a hexagonal region that is centered around the point (-π,0) which is shown in Fig. 5.
Gain (dB) 10
5
Phase Shift (rad) -6
-5
-4
-3
-2
-1
1
-5
-10
Fig. 5. Nichols Plot of the System G(s)
Now that the Nichols exclusion region has been defined, Maple is used to solve for the frequencies where the Nichols plot passes through the endpoints of the exclusion region. We use MetiTarski to ensure that Maple’s computations are in fact correct. The interval [−3, 3] of the gain (y-axis of Nichols plot), corresponds to the interval w ∈ [23080/32333, 75843/46168] in the frequency domain. MetiTarski is used to show that outside this frequency interval, we have (y ≥ 3) ∨ (y ≤ −3). Then to show that the exclusion region is never entered from the right middle segment, MetiTarski proves that ∀w.
w > 23080/32333 ∧ w < 75843/46168 ⇒ x > −3π/4
The interval [−π, −3π/4] of the phase (x-axis of the Nichols plot) corresponds to the interval w ∈ [42049/14953, 978208/3695] in the frequency domain. MetiTarski is used to show that outside this frequency interval, we have (x ≥ −3π/4)∨ (x ≤ −π). Then to show that the exclusion region is never entered from the bottom right segment, MetiTarski proves that ∀w.
w < 978208/3695 ∧ w > 42049/14953 ⇒ y < −
12 x+6 π
98
W. Denman et al. Table 2. Case Study Proof Times Experiment Time (s) right-middle-gain-check-U 1.546 right-middle-gain-check-L 0.259 right-middle-exclusion-1 0.221 right-middle-exclusion-2 0.996 right-middle-exclusion-3 0.221 right-middle-exclusion-4 2.322 right-bottom-phase-check 0.221 right-bottom-exclusion-1 3.56 right-bottom-exclusion-2 9.064
From the results obtained from Maple and MetiTarski, we can infer that the Nichols plot does not pass through any other points of the exclusion region and thus does not pass through any of the other four boundaries. A snapshot of the code used to prove this fact is shown in Fig. 6. The experimental results are shown in Table 2. For the “right-middle” experiments, U and L indicate the upper and lower points at which the transfer function could possibly enter the exclusion region. When an experiment is split into multiple sub-experiments (1,2,3,4), this indicates that the phase function is taking on different values due to arctan being defined only over (−π/2, π/2). The “check” experiments are verifying Maple’s output. The “exclusion” experiments are verifying that the transfer function does not enter the exclusion region. The runtimes were measured on a 2.8 GHz Dual Quad-Core Mac Pro, with 4GB of RAM. The middle boundary proofs completed faster because they are defined using only the ln function, about which MetiTarski can reason very efficiently. The right bottom boundary is defined using a combination of both the arctan and ln functions, which is more difficult to reason about primarily because of the extremely large values that their arguments take. The difference between proof times is not problematic because the final positive result is eventually obtained. Further improvements to the axioms used by MetiTarski, will ultimately improve the proof times.
fof(Nichols-Exclusion,! [X] : ((X > 0.9582 & X < 2.86) => 10/ln(10)*ln(0.25*10^(-24)* (3862622500*X^20+0.3566432250*10^41*X^18+ ... + 0.8478030764*10^17*X^8))) < -6+(12/pi)*arctan(0.2*10^(-3)*(-6100459+ ...+0.246*10^25*X^16))) )). Fig. 6. MetiTarski Input for Proving Lower Right Edge of the Exclusion Region
Towards Flight Control Verification Using Automated Theorem Proving
6
99
Conclusion and Future Directions
In this paper, we have shown that it is possible to use an automated theorem prover, MetiTarski, to verify properties of Nichols plots directly. The inequalities analyzed contain instances of ln, sqrt and arctan functions that take on very large values. This indicates that we will be able to further apply the methodology to similar sized aeronautical systems where the verification of stability is dependent on phase and gain margins. Building on the ideas demonstrated in this paper, there are directions we are planning to investigate. In advanced flight control verification methods such as μanalysis, ν-gap analysis and Quantitative Feedback Theory (QFT), the exclusion regions are defined as circles, ellipses, and complex polygons of varying sizes. Since no assumption is made on the number of inflection points of the transfer function, MetiTarski would be able to handle these types of problems. On the other hand, previous methods would have difficulty. This is because MetiTarski can handle inequalities containing transcendental and other special functions over a real valued domain. One way to guarantee safety of a dynamical system is to find a function called a “barrier certificate” [13]. If a barrier certificate can be found for a specified system, then it is possible to say that starting in some initial state, some unsafe state will never be reached. By using barrier certificates, it is not necessary to calculate the flows of the system directly. Such is the case with several reachability analysis methods. Finding a barrier certificate is not easy, but this problem can be reformulated as a sum-of-squares search problem [14], and we believe MetiTarski will be quite useful for refuting incorrect sum-of-squares formulas during this search. We would like to have a more realistic model of the aircraft dynamics. Analyzing the non-linear system using qualitative methods is one possible solution. It will also be necessary to consider parameter variations and perturbation effects. We also need to extend the methodology to other potential methods for stability verification such as Lyapunov based methods.
Acknowledgments We would like to thank the following people: Kyungjae Baik from Concordia University for providing us with the Simulink control system design we used for the case study. Dr. Lawrence Paulson from the University of Cambridge for his help with MetiTarski.
References 1. Advisory Circular: System design and analysis. Tech. rep., Federal Aviation Adminisration (1988) 2. Akbarpour, B., Paulson, L.C.: MetiTarski: An automatic prover for the elementary functions. In: Autexier, S., Campbell, J., Rubio, J., Sorge, V., Suzuki, M., Wiedijk, F. (eds.) AISC 2008, Calculemus 2008, and MKM 2008. LNCS (LNAI), vol. 5144, pp. 217–231. Springer, Heidelberg (2008)
100
W. Denman et al.
3. Akbarpour, B., Paulson, L.C.: Applications of MetiTarski in the verification of control and hybrid systems. In: Majumdar, R., Tabuada, P. (eds.) HSCC 2009. LNCS, vol. 5469, pp. 1–15. Springer, Heidelberg (2009) 4. Baik, K.: Flight control systems - final project. Tech. rep., Concordia University (2008) 5. Brown, C.W.: QEPCAD B: A program for computing with semi-algebraic sets using CADs. SIGSAM Bulletin 37(4), 97–108 (2003) 6. Fielding, C., Varga, A., Bennani, S., Selier, M. (eds.): Advanced techniques for clearance of flight control laws. LNCIS, vol. 283. Springer, Heidelberg (2002) 7. Hardy, R.: Formal methods for control engineering: A validated decision procedure for Nichols Plot analysis. Ph.D. thesis, School of Computer Science - University of St. Andrews (February 2006) 8. Khalil, H.: Nonlinear Systems. Prentice Hall, Englewood Cliffs (1996) 9. Langton, R.: Stability and Control of Aircraft Systems. Wiley, Chichester (2006) 10. National Air Traffic Controllers Association: Air trafic control: By the numbers (2009), http://www.natca.org/mediacenter/bythenumbers.msp 11. Padfield, G.D.: The birth of flight control: An engineering analysis of the Wright brothers 1902 glider. University of Liverpool, The Aeronautial Journal (2003) 12. Parrilo, P.A.: Structured Semidefinite Programs and Semialgebraic Geometry Methods in Robustness and Optimization. Ph.D. thesis, California Institute of Technology (May 2000) 13. Prajna, S., Jadbabaie, A.: Safety verification of hybrid systems using barrier certificates. In: Hybrid Systems: Computation and Control, pp. 477–492. Springer, Heidelberg (2004) 14. Prajna, S., Papachristodoulou, A., Seiler, P., Parrilo, P.A.: SOSTOOLS and Its Control Applications. LNCIS, vol. 312, ch. 3, pp. 273–292. Springer, Heidelberg (2005) 15. The MathWorks: Simulink 7 reference (March 2010), http://www.mathworks.com/ access/helpdesk/help/pdf_doc/simulink/slref.pdf 16. Tomlin, C., Mitchell, I., Bayen, A.M., Oishi, M.: Computational techniques for the verification of hybrid systems. Proceedings of the IEEE 91(7) (July 2003)