This paper presents an OLAP reporting tool and an approach for determining .... In CWM there is the package Business Nomenclature, which can be used to ... In the reporting tool each workbook contains one on more worksheets, and each.
Towards Introducing User Preferences in OLAP Reporting Tool Natalija Kozmina, Darja Solodovnikova Faculty of Computing, University of Latvia, Raina blvd., Riga LV-1586, Latvia {natalija.kozmina, darja.solodovnikova}@lu.lv
Abstract. This paper presents an OLAP reporting tool and an approach for determining and processing user OLAP preferences, which are useful for generating recommendations on potentially interesting reports. We discuss the metadata layers of the reporting tool including our proposed OLAP preferences metamodel, which supports various scenarios of formulating preferences of two different types: schema-specific and report-specific. The process of semantic metadata usage at the stage of formulating user preferences is also considered. The methods for processing schema-specific and report-specific OLAP preferences are outlined. Keywords: data warehouse, user preferences, business metadata, reports
1
Introduction and Related Work
Sometimes, during sessions of work with a reporting tool, a user has no notion about what kind of data he/she is able to find there. Moreover, a user might be unaware of a potentially useful report, because, for instance, it has been created recently and the user hasn’t examined it yet. In one of our works [1] we focused on acquiring user preferences implicitly either by analyzing his/her previous activities or by learning the structure of the browsed report in order to suggest him/her other reports that might be helpful, meanwhile saving user’s time and effort. In this paper we concentrate on preferences explicitly formulated by users of the OLAP reporting tool. Apart from employing the reporting tool as a means of creating, modifying and executing reports on data warehouse schema, we also consider this reporting tool as an experimental environment for introducing OLAP personalization. Users of the reporting tool may have different skill levels (e.g., expert, novice), that’s why reports’ recommendations based on user preferences are more valuable for novice users than for experts. The reporting tool is a part of the data warehouse framework [2] developed at the University of Latvia. The ideas of introducing personalization into data warehouses came from the field of databases [3] and still remain a subject of interest. Data warehouse can be personalized at schema level, applying rules for the data warehouse personalization, thus, giving a user an opportunity to work with a personalized OLAP schema, which matches his/her needs [4]. Users may express their preferences on OLAP queries [5];
2
Natalija Kozmina, Darja Solodovnikova
in such case, the problem of performing time-consuming OLAP operations to find the necessary data is significantly improved. The other method of personalizing OLAP systems is to provide query recommendations to data warehouse users via investigating former sessions of the same user [6], or via collecting user preferences into a profile and processing it, while generating query recommendations [7]. Another aspect of OLAP personalization is the visual representation of data [8]: multiple layouts and visualization techniques may be interactively used for various analysis tasks. The summary of the research made in the field of personalization in OLAP is found in one of our previous works [9]. There are some distinctive features in the approach proposed by the authors of this paper comparing to [6] and [7]. We may notice that in [6] authors analyze unexpected differences in data; however, in this paper we analyze logical structure of the reports. In [7] both data preferences and preferences on logical structure of the reports are taken into account, however, in [7] to get recommendations, user has to state his/her preferences in a user profile first. As opposed to that, in this paper no user profile is needed, because user preferences are defined automatically without asking the user to provide information directly. In [10] a survey of the existing methods for computing data warehouse query recommendations is presented. Authors of this survey marked out four methods, which are employed to convert a certain user’s query into another one that is likely to have an added value for the user: (i) methods exploiting a profile, (ii) methods based on expectations, (iii) methods exploiting query logs, and (iv) hybrid methods. The rest of the paper is organized as follows: Section 2 introduces interrelated metadata layers of the reporting tool, i.e. logical, physical, reporting, semantic, and OLAP preferences metadata. Various user preference modeling scenarios illustrate the OLAP preference metamodel. Section 3 describes the 5-step process of user preference formulation in business language and its further transformation. Section 4 concludes the paper.
2
OLAP Reporting Tool
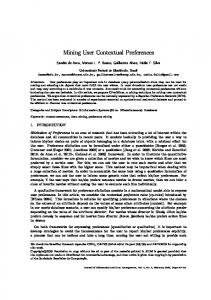
All operation of the data warehouse framework and the OLAP reporting tool as a part of it is based on metadata that consists of five interconnected layers (fig. 1). Semantic Metadata OLAP Preferences Metadata
Logical Metadata
Reporting Metadata
Physical Metadata
Fig. 1. Metadata connections
Logical metadata is used to describe data warehouse schemata. Physical metadata describes storage of a data warehouse in a relational database. Semantic metadata describes data stored in a data warehouse and data warehouse elements in a way that is understandable to users. Reporting metadata stores definitions of reports on data
Towards Introducing User Preferences in OLAP Reporting Tool
3
warehouse schemata. OLAP preferences metadata stores definitions of user preferences on reports’ structure and data. Particular classes of parts of metadata are connected by associations. Semantic metadata describes report’s items from the reporting metadata and data warehouse schema elements from the logical metadata. Data warehouse schema elements from the logical metadata correspond to tables and table columns described in the physical metadata. Items of reports defined in the reporting metadata are obtained from table columns described in the physical metadata and correspond to data warehouse schema elements from the logical metadata. OLAP preferences metadata defines user preferences for data warehouse schema elements described in the logical metadata and for reports described in the reporting metadata. OLAP preferences are formally defined by concepts of semantic metadata. To be more precise, components of user preferences on reports’ structure are OLAP schema elements from the logical metadata that correspond to concepts from the semantic metadata, and components of user preferences on reports’ data are items of reports from the reporting metadata that are defined by concepts as well. Thereby, there is a latent connection between semantic metadata and OLAP preferences metadata. Common Warehouse Metamodel (CWM) [11] was used as a basis for the semantic, logical and physical metadata. 2.1
Logical Metadata
Metadata at the logical level describes the multidimensional data warehouse schema (fig. 2.). 1 1..* FactTable -Name -Description
Schema -Name -Description
1
1..*
-FactTableDimension
Dimension
0..*
0..*
1 AcceptableAggregation
1..* Measure -Name -Description
-Aggregation 1..*
1..*
1..* Attribute -Name -Description
-corresponds 1
0..*
-Name -Description -IsTimeDimension 0..* 1 Level -Name -Description
*
1
Hierarchy
-Name -{ordered} -Description
Fig. 2. Logical level metadata [12]
The logical level metadata is based on the OLAP package of Common Warehouse Metamodel (CWM) [11] and contains the main objects from this package such as dimensions with attributes and hierarchies, fact tables (cubes in CWM) with measures. Fact tables and dimensions are connected by FactTableDimension associations. OLAP package of CWM was extended by the class AcceptableAggregation, which stores information about aggregate functions (SUM, AVG, COUNT, MIN, MAX) acceptable for each measure and dimension. This metadata is essential for correct queries. The detailed description of all metadata levels of a data warehouse, including the description of the logical level, is found in the paper [12].
4
2.2
Natalija Kozmina, Darja Solodovnikova
Reporting Metadata
Reporting metadata describes the structure of reports on data warehouse elements (fig. 3). Basically, reports are worksheets that contain data items defined by calculations, which specify computation formulas from parameters and table columns that usually correspond to schema elements (measures and attributes). Reports also consist of user-defined conditions and joins between tables. Reports in the tool are defined by developers or experienced users themselves by choosing desired elements of a data warehouse schema and defining conditions, parameters, etc. According to the report definition, reporting metadata is created for each report. When a user runs a report in the OLAP reporting tool, an SQL query is built based on the report definition in reporting metadata [13], and its result is displayed to a user. -corresponds
Workbook -Name -Description Subquery ConditionSet
-QueryText
*
-Formula -IsVersionCondition
Constant -Value
1 1..* 1
ConditionObject
*
1
-Name -Description -DefaultValue
-{ordered}
Worksheet -Name -Type -Title
1
Parameter
SchemaElement
* * CalculationPart
Join 1
*
-Type -Outer
-{ordered}
1..*
*
1..2 * -compares {ordered}
1..*
-{ordered}
Condition -Operator
1 1..*
-joins -{ordered}
Attribute -(from Logical)
Column
Item -Location -Name -Calculation -Description
2
-(from Physical)
Measure -(from Logical)
1
Fig. 3. Reporting metadata [13]
2.3
Semantic Metadata
It is essential for data warehouse users to understand the semantics of data that appears in reports from the business perspective. There are multiple reasons why it is necessary to describe each element of the data warehouse model in business language. For instance, while working with the reporting tool, users also must be able to analyze this data using all necessary features, including OLAP operations drill-down and roll-up and using hierarchies. Besides, it is desirable that users can modify or construct reports themselves from elements, which are familiar to them, so that reports’ creation becomes transparent. Moreover, users should be able to state their OLAP preferences, operating with business language terms, so that it would be possible to provide users of different skill levels (e.g., expert, novice) with recommendations on potentially interesting reports. Data warehouse elements’ description in business language is stored in the semantic metadata. In CWM there is the package Business Nomenclature, which can be used to represent business metadata. This package was taken as a basis for semantic metadata depicted in fig. 4. The main classes that are used for description of data warehouse
Towards Introducing User Preferences in OLAP Reporting Tool
5
elements are Terms and Concepts, which are united in Glossaries and Taxonomies respectively. A concept is the semantic meaning or a notion of some data warehouse element or data stored in some element, but a term is a particular word or phrase employed by users to refer to a concept. In semantic metadata Concepts define elements of a data warehouse schema (class SchemaElement from the logical metadata) and items used in reports (class Item from the reporting metadata). *
*
Item
-defines 1
-(from Reporting) 1 -defines
0..1 -synonym
* Term
*
*
-Description : String *
-related
SchemaElement -(from Logical) *
Concept
1
-Description : String 1
* 0..1
Glossary -Description : String
*
Taxonomy
*
-Description : String
-related
0..1 BusinessDomain
*
Fig. 4. Semantic metadata
2.4
OLAP Preferences Metadata
A metamodel describes OLAP schema preferences and is depicted in fig. 5. In this paper we present a revised version of the metamodel, previous versions of which are published in [14], [15]. A user may set the degree of interest (DegreeOfInterest, DOI [3]) for each OLAP preference. For instance, a user operates with values of the DOI attribute that may be the following: very low, low, medium, high, very high. Each DOI may have a defined real number equivalent that is assigned automatically. For example, if values of the DOI are in the interval [0; 1], then medium degree of interest corresponds to the numeric value 0.5, low degree of interest – to 0.2, etc. In the reporting tool each workbook contains one on more worksheets, and each worksheet represents a single report. The scope of an OLAP preference may be either a specific set of reports (i.e. workbook), a single report (i.e. worksheet), or all reports defined in the reporting tool. Each OLAP preference may be either simple (SimpleOlapPreference) or complex (ComplexOlapPreference). A complex OLAP preference consists of multiple equally important simple OLAP preferences. An advantage of a complex OLAP preference is that it allows a user to formulate sophisticated preferences assigning only one value of the degree of interest to a complex preference as a whole. For instance, annual summary information about the average student grade in each course is a complex OLAP preference that consists of five simple OLAP preferences (see Table 2), whereas year=2011 is a simple OLAP preference. A simple OLAP preference may be of two types: (i) Schema-Specific preferences on OLAP schema, its elements and acceptable aggregate functions, and (ii) Report-Specific preferences on data in reports. A PreferenceElement class describes the type of the element in user preference, which may be an OLAP schema, an OLAP schema element (e.g. dimension, fact table, attribute, measure, etc.) or a report’s item. An acceptable aggregate function
6
Natalija Kozmina, Darja Solodovnikova
(AcceptableAggregation) may be applied to measures in order to get aggregated data w.r.t. one or many dimensions. In report-specific preferences one or more preference elements (Items) may be included, and vice versa, a single preference element (Item) may be used in multiple user preferences of that type. Each item of the report is related to zero or one preferred term (Term) that a user selects as the most appropriate one to characterize the specific item of the report. * OlapPreference
*
-DegreeOfInterest * ComplexOlapPreference
SimpleOlapPreference -defines scope 1
Workbook -(from Reporting)
1
* 1..* *
Schema-Specific
-defines scope
-employs {ordered} *
1..*
-employs {ordered} *
* -applied to
*
Report-Specific
*
1
Worksheet -(from Reporting)
-contains {ordered} *
SchemaElement
PreferenceElement
-(from Logical)
-Name
1
Condition -Name
AcceptableAggregation
2
-(from Logical)
Expression
1..2 LogicalOperator
*
Item -(from Reporting)
ConstantValue
-preferred
SimpleCondition
-Value Term -(from Semantic)
0..1
-Value
1
1..*
Comparison
1 1
ComplexCondition
-Value
1
Fig. 5. OLAP preferences metadata
As report-specific preferences include restrictions on report’s data, each reportspecific preference may contain a set of conditions. A Condition class is divided into two subclasses: a SimpleCondition and a ComplexCondition. A complex condition consists of two or more simple conditions, joined with a logical operator (AND, OR). A simple condition consists of two expressions (Expression) and a comparison operator (Comparison). It is allowed to apply the following comparison operators: =, , >=, ,