Towards life cycle sustainability assessment: an implementation to photovoltaic modules Marzia Traverso, Francesco Asdrubali, Annalisa Francia & Matthias Finkbeiner
The International Journal of Life Cycle Assessment ISSN 0948-3349 Volume 17 Number 8 Int J Life Cycle Assess (2012) 17:1068-1079 DOI 10.1007/s11367-012-0433-8
1 23
Your article is protected by copyright and all rights are held exclusively by SpringerVerlag. This e-offprint is for personal use only and shall not be self-archived in electronic repositories. If you wish to self-archive your work, please use the accepted author’s version for posting to your own website or your institution’s repository. You may further deposit the accepted author’s version on a funder’s repository at a funder’s request, provided it is not made publicly available until 12 months after publication.
1 23
Author's personal copy Int J Life Cycle Assess (2012) 17:1068–1079 DOI 10.1007/s11367-012-0433-8
SUSTAINABLE DEVELOPMENT
Towards life cycle sustainability assessment: an implementation to photovoltaic modules Marzia Traverso & Francesco Asdrubali & Annalisa Francia & Matthias Finkbeiner
Received: 28 July 2011 / Accepted: 11 April 2012 / Published online: 16 May 2012 # Springer-Verlag 2012
Abstract Purpose The main goal of the paper is to carry out the first implementation of sustainability assessment of the assembly step of photovoltaic (PV) modules production by Life Cycle Sustainability Assessment (LCSA) and the development of the Life Cycle Sustainability Dashboard (LCSD), in order to compare LCSA results of different PV modules. The applicability and practicability of the LCSD is reported thanks to a case study. The results show that LCSA can be considered a valuable tool to support decision-making processes that involve different stakeholders with different knowledge and background. Method The sustainability performance of the production step of Italian and German polycrystalline silicon modules is assessed using the LCSD. The LCSD is an application oriented to the presentation of an LCSA study. LCSA comprises life cycle assessment (LCA), life cycle costing and social LCA (S-LCA). The primary data collected for the Responsible editor: Mariska de Wild-Scholten Electronic supplementary material The online version of this article (doi:10.1007/s11367-012-0433-8) contains supplementary material, which is available to authorized users. M. Traverso (*) : M. Finkbeiner Technische Universitaet Berlin, Office Z1, Strasse des 17. Juni 135, Berlin 10623, Germany e-mail:
[email protected] F. Asdrubali CIRIAF, Facoltà di Ingegneria, Università di Perugia, 06125 Perugia, Italy A. Francia Solsonica S.p.a, Viale delle Scienze, 5, 02015 Cittaducale, Rieti, Italy
German module are related to two different years, and this led to the evaluation of three different scenarios: a German 2008 module, a German 2009 module, and an Italian 2008 module. Results and discussion According to the LCA results based on Ecoindicator 99, the German module for example has lower values of land use [1.77 potential disappeared fractions (PDF) m2/year] and acidification (3.61 PDF m2/year) than the Italian one (land use 1.99 PDF m2/year, acidification 3.83 PDF m2/year). However, the German module has higher global warming potential [4.5E–05 disabilityadjusted life years (DALY)] than the Italian one [3.00E−05 DALY]. The economic costs of the German module are lower than the Italian one, e.g. the cost of electricity per FU for the German module is 0.12 €/m2 compared to the Italian 0.85 €/m2. The S-LCA results show significant differences between German module 2008 and 2009 that represent respectively the best and the worst overall social performances of the three considered scenarios compared by LCSD. The aggregate LCSD results show that the German module 2008 has the best overall sustainability performance and a score of 665 points out of 1,000 (and a colour scale of light green). The Italian module 2008 has the worst overall sustainability performance with a score of 404 points, while the German module 2009 is in the middle with 524 points. Conclusions The LCSA and LCSD methodologies represent an applicable framework as a tool for supporting decision-making processes which consider sustainable production and consumption. However, there are still challenges for a meaningful application, particularly the questions of the selection of social LCA indicators and how to weigh sets for the LCSD. Keywords Life Cycle Sustainability Assessment . LCA . LCC . S-LCA . Photovoltaic modules . Social indicators
Author's personal copy Int J Life Cycle Assess (2012) 17:1068–1079
1 Introduction More than 40 years has passed between the first application of photovoltaic (PV) cells and the more recent large-size PV plants. Over this period, efficiencies of the modules have increased significantly and, thanks to governmental incentives, the market has grown enormously, and costs have decreased. The photovoltaic technology, which was relegated years ago to small-size, stand-alone applications, has emerged as a potentially major technology for power generation throughout the world. Despite the global economic crisis, according to European Photovoltaic Industry Association (EPIA) data, the annual market of PV modules and systems has developed from less than 1 GW in 2003 to 21 GW in 2010, three times as much as 2009 figures (7.2 GW). According to the Renewable Energy Policy Network for the 21st Century REN21 (2011), Germany is the world’s largest PV market, with a cumulative PV power at the end of 2010 of more than 17 GW (7.4 GW installed in 2010). The “Conto Energia” incentives of the Italian government made Italy the second largest market in the world, with a cumulative PV power of more than 11.00 GW (November 2011) and more than 2.0 GW installed in 2010 (GSE 2011). In recent years, many researchers have focused on life cycle assessment (LCA) of photovoltaic modules and systems, starting from the early studies of Alsema (2000). Fthenakis and Kim (2009) compared various PV technologies (Mono-Si, Multi-Si, ribbon-Si, CdTe) in terms of LCA, while more recently, Leleman et al. (2011) calculated, under average US and Southern Europe irradiation conditions (e.g. 1,700 kWh/m2/year), the energy payback time of PV systems, and found values between 1 and 3 years, depending on the technology. So far, many environmental LCA studies have been performed, but none have made a sustainability assessment of PV modules. The present work focuses on the life cycle sustainability assessment (LCSA) of assembly step of PV modules using Italian and German primary data. Because one of the main goals of LCSA, according to the goal of LCA (ISO14040 2006), is to support the decisionmaking processes leading to sustainable production and consumption, the results can be used to compare products and services. Not many implementations of LCSA are available yet, but the huge amounts of experiences of LCA to assess and to compare environmental performances of products show the ability of these tools in improving the transparency of the decision processes. To support decision making, LCSA results are faced with the challenge of how to take complex and potentially confusing data and present it in a straightforward manner to decision makers who may not be experts in this field. Therefore, the creation of an understandable yet comprehensive presentation of LCSA results is a major goal of this research.
1069
The life cycle sustainability dashboard (LCSD) can represent a solution, a combined approach of life cycle sustainability assessment and dashboard of sustainability. The LCSD, proposed in a previous work (Traverso and Finkbeiner 2009), is here implemented and discussed.
2 Materials and methods 2.1 Research design The concept, which is well accepted by the industry and often called the “triple bottom line”, is the “three-pillar” interpretation of sustainability. It essentially states that for achieving (or assessing) sustainability, the environmental, economic and social aspects have to be compared. Given the widespread acceptance of the model, it is logical to propose the following scheme for LCSA for assessing product life cycle (Finkbeiner et al. 2008, 2010; Kloepffer 2003, 2008): LCSA ¼ LCA þ LCC þ S‐LCA
ð1Þ
where LCA is the SETAC/ISO environmental life cycle assessment, defined and standardized by the ISO 14040– 44 (ISO14040 2006; ISO14044 2006). LCC is the life cycle costing or the assessment of economic factors the product life cycle (Hunkeler et al. 2008; Swarr et al. 2011). The social life cycle assessment is the evaluation of the social factors (UNEP/SETAC 2009). The environmental LCA is the most developed and implemented among these, as it has been shown by several implementations of LCA to various materials and products (Asdrubali 2009) and in particular to PV modules (Alsema and De Wild 2006; Koroneos et al. 2006a, b). Most of the data used are available in the software to support LCA such as SimaPro and Gabi (PE International and LBP 2009; PRe Consultants 2010). For the LCA implementation, SimaPro software and the Ecoinvent libraries have been used in this case study. More in detail, the data related to PV panel, multi-Si at plant/RER/I U (2007) has been used with the relative module production located in Western Europe. LCC is a compilation and assessment of all costs related to a product, over its entire life cycle, from production to use, maintenance and disposal (Hunkeler et al. 2008). The Society of Environmental Toxicology and Chemistry has defined it as “an assessment of all costs associated with the life cycle of a product that are directly covered by any one or more of the actors in the product life cycle (supplier, producer, user/consumer, end-of-life actor), with complimentary inclusion of externalities that are anticipated to be internalized in the decision-relevant future”. A number of guidelines and
Author's personal copy 1070
references have been developed for the LCC, but an ISO standard does not yet exist (UNEP/SETAC 2012). The last component of the relation is S-LCA. Many efforts have been spent in defining this methodology, as well as in identifying and selecting a valid set of indicators (Dreyer et al. 2006; Jǿrgensen et al. 2008). However, further development is required to define a commonly accepted set of indicators. The UNEP/SETAC LCI developed the guideline and methodological sheets (UNEP/SETAC 2009) to support pioneers of S-LCA. According to the social LCA guidelines, different stakeholder groups should be considered. For the considered production step, an analysis aimed at identifying the most affected and affecting stakeholder group has been performed. To select a set of social indicators, the methodological sheets draft and other references have been used (Jǿrgensen et al. 2008). The LCSA of a product is carried out through a contemporary and complementary implementation of the three above-mentioned methods, referring to the same or equivalent system boundary and to the same functional unit. Difficulties can occur to collect social data because different stakeholder groups should be considered. In spite of the definition of the LCSA, results of the three forms of analysis are usually reported in a disaggregated manner and this may lead to a difficult comparison of products. When considering the decision-making process where stakeholder groups with different backgrounds and educational levels are involved, it is easy to see how important it is to solve this problem. A possible solution is presented here by using a specific application of dashboard of sustainability called LCSD (Traverso and Finkbeiner 2009). The Dashboard of Sustainability methodology (Hardi and Semple 2000; Jesinghaus 2000) and the related software were established by a research group of the Joint Research Centre of Ispra, Italy. It was originally developed to assess and to compare several communities by integrating economic, social and environmental factors. In the Dashboard of Sustainability software, a certain number of indicators and their values can be inserted. The indicators are grouped into a limited number of topics. It is then possible to set up a dashboard, choosing the appropriate topics and associated indicators. It consists of an Excel macro that presents a comparison of two or more scenarios by a score and a colour scale. The comparison is contemporary performed at indicator level, at topic level and at the end by an aggregated Sustainability Performance Index. For the application to LCSA, the indicator sets used for LCA, LCC and S-LCA can be used. All indicators values for each considered product can be entered into the software which ranks all values for each indicator assigning 1,000 points to the product with the best performance (dark green in the colour scale or white in grey scale) and 0 points to the
Int J Life Cycle Assess (2012) 17:1068–1079
worst performance (dark red in the colour scale or black in grey scale). All other values of the same indicator are linearly interpolated. The evaluation results of the product comparison for each topic are given by a weighted average of all included indicators’ values. The software can handle weighting factors of the indicators. In this first application, the same weight is assigned to each indicator to give the same importance to all considered environmental, economic and social impacts. In fact different weights are usually assigned to those indicators whose impacts have more importance according to the involved stakeholders group. To choose the weights, a consultation process is desirable. The overall evaluation is the arithmetical average of the topic evaluations. As for the indicator values, the resulting evaluations are obtained by scores (between 0 and 1,000) and according colours. 2.2 The scope of the LCSA The main goal of this case study of LCSA applied to photovoltaic modules is to assess the applicability and practicability of both methodology LCSA and LCSD. In fact, even if there is a clear agreement that sustainability assessment should include environmental, economic and social factors, often only economic and/or environmental assessment are considered. In this study, the LCSA is implemented to assess three different scenarios and the results are compared with LCSD to show the potentiality of this tool in presenting the results in a comprehensive and understandable way. Thanks to the cooperation between the chair of Sustainable Engineering of Technical University of Berlin and two different companies, producers of PV modules, the collection of primary data to perform the LCSD of two different assembly sites, one located in Italy and one in Germany, has been carried out. The LCSA methodology has been developed (Finkbeiner et al. 2010; Kloepffer 2008) in its theoretical approach, but still has some limitations. In this context, the work represents one of the first implementations of the procedure and the current, unique implementation for photovoltaic modules. 2.2.1 Case study A complete photovoltaic system may include different components such as PV modules, DC-AC power inverter, energy storage (batteries), energy distribution and metering (to local electrical loads and/or to the grid). PV cells are generally made either from crystalline silicon or thin film. Within the c-Si technologies, mono- and multicrystalline cells are produced in fairly equal proportion. However, multicrystalline cells are gaining market share. Ribbon c-Si represents less than 5 % of the market. CdTe has grown from 2 % market share in 2005 to 13 % in 2010 (EPIA 2010).
Author's personal copy Int J Life Cycle Assess (2012) 17:1068–1079
The production of cells is not included in the system boundary, so it is not described in details. The efficiency of solar cell production is estimated at 95 %, which means that 5 % of the tested cells are rejected. Subsequently, the remaining cells are ready to be encapsulated into a module (Koroneos et al. 2006a, b). The manufacturing of PV modules consists of several steps such as: & &
&
& & & & &
The washing and drying of glass, The string preparation occurs when the good cells are interconnected by copper ribbons laid out in a ribbon using series connections through a laser, to usually obtain strings of 10 cells. The lay up phase occurs when the strings are checked and connected manually with bus ribbon. Then there is a manual deposition of a foil of ethyl vinyl acetate (EVA), the strings, a second EVA foil and a backsheet (usually Tedlar) upon the glass. The embedding of the cell matrix in EVA foil (lamination). The encapsulation materials consist of a “sandwich”; this step is a thermal process. Trimming is a manual or mechanical process when the excess material is removed. The module is then framed with an aluminium frame in a robotic installation. The junction box is attached on the back side of the module; The final phase consists of checking the module, in a test rig, with a solar simulator. The analysis is conducted under assigned conditions: a temperature of 25 °C and 1,000 W/m2 of simulated solar radiation.
At the end of all the assembling steps, all each module has its own performance specification. 2.2.2 System boundary and assumptions of LCSA According to the first guidelines of LCSA (UNEP/SETAC 2012), the same system boundary should be used for all three assessments. When the three methods are applied individually, each of them may have different system boundaries depending on their relevancy to the various impact categories. For example, S-LCA can include local community when the product affects it. To identify the relevant unit processes that make up the system boundary, different cutoff criteria are used (based on environmental or social or economic relevance, e.g. working hours or mass). To correctly implement the LCSA, the system boundary has to include all unit processes which are relevant for at least one of the three methods. Because of data availability in this first application, a difference between the system of economic and environmental assessment and the social one has to be pointed out. The data of LCC are all primary data, directly collected by interviews and questionnaires from the production
1071
facilities. Because the system boundary is the assembly step, in the life cycle costing, the producer prospective has been considered and all real money flows have been taken into account. Since the LCSA is only focused on the assembly phase, the workers that are surely affected by the product have been considered as stakeholder group. According to the guidelines (UNEP/SETAC 2009), in fact, at least the social impacts of the stakeholder groups which are mainly affected should be considered. The data of the assembly step are mainly primary data collected from the companies, and are related to two different years (2008 and 2009). This has led to consider three different scenarios that are all assessed and compared by life cycle sustainability assessment. The three scenarios are mainly different for the economic and social data. In fact, no changes in the assembly chain have occurred in the two considered years and consequently no differences can be measured in terms of environmental impacts. The considered assembly scenarios are: & & &
German polycrystalline silicon module with 2009 data; German polycrystalline silicon module with 2008 data and Italian polycrystalline silicon module with 2008 data.
To implement LCSA as a complementary approach, it is necessary to consider the same functional unit for all three assessments. The functional unit used in this case study is 1 m2 of modules. In fact, the compared products have the same characteristics and equivalent performances, therefore a square metre instead of a produced kilowatt hour can be used as a functional unit. Concerning the assembly line of the German site, direct information from the plant about raw materials for all the steps of the considered system has been collected. With regards to energy consumptions and emissions, it was not possible to identify the specific inputs and outputs for each operational unit (stringer, laminator, etc.). Therefore, a total value related to the entire production site has been considered. As for the Italian module, it was possible to collect some direct information about raw materials, but most of the data of LCA are from the Ecoinvent database related to the production of a polycrystalline silicon module. All data related to transport from suppliers to the facility have not been considered because it was not possible to collect direct information. The LCA has been carried out by using the method of Eco-indicators 99(E) (V2.06/Europe EI99 E/E). Normalisation and weighting are performed at damage category level (endpoint level in ISO terminology). The general input and output of SimaPro (PRé Consultants 2008) data are shown in Table 1. The primary data of the German module and the Italian one are respectively reported into Tables 2 and 3. For the LCC, a specific questionnaire for collecting data costs was created and distributed to the German and the
Author's personal copy 1072 Table 1 The input and output data of LCA (source: SimaPro database: PV panel, multi-Si at plant/RER/I U)
Int J Life Cycle Assess (2012) 17:1068–1079
Unit Functional unit Material/fuel Electricity, medium voltage, production UCTE, at grid/UCTE U Natural gas, burned in industrial furnace low NOx >100 kW/RER U Photovoltaic panel factory/GLO/I U Tap water, at user/RER U Tempering, flat glass/RER U Wire drawing, copper/RER U Photovoltaic cell, single Si, at plant/RER U Aluminium alloy, AlMg3, at plant/RER U Nickel, 99.5 %, at plant/GLO U Brazing solder, cadmium free, at plant/RER U Solar glass, low iron, at regional storage/RER U Copper, at regional storage/RER U
m2 kWh MJ p kg kg kg m2 kg kg kg kg kg
PV module 1 4.71 5.41 0.000004 21,286 10.08 0.11 0.93 2.63 0.0002 0.009 10,08 0.11
Glass fibre reinforced plastic, polyamide, injection moulding, at plant/RER U Ethyl vinyl acetate, foil, at plant/RER U Polyvinyl fluoride film, at plant/US U Polyethylene terephthalate, granulate, amorphous, at plant/RER U Silicone product, at plant/RER U Acetone, liquid, at plant/RER U Methanol, at regional storage/CH U Vinyl acetate, at plant/RER U Lubricating oil, at plant/RER U Corrugated board, mixed fibre, single wall, at plant/RER U 1-Propanol, at plant/RER U Transport, lorry >16 t, fleet average/RER U Transport, freight, rail/RER U Treatments of wastes Disposal, municipal solid waste, 22.9 % water, to municipal incineration/CH U Disposal, municipal solid waste, 22.9 % water, to municipal incineration/CH U Disposal, polyvinyl fluoride, 0.2 % water, to municipal incineration/CH U Disposal, plastics, mixture, 15.3 % water, to municipal incineration/CH U
kg kg kg kg kg kg kg kg kg kg kg tkm tkm
0.19 1.002 0.11 0.373 0.122 0.013 0.002 0.002 0.002 1.10 0.008 1.61 9.45
kg kg kg kg
0.03 0.11 1.69 0.002
Disposal, used mineral oil, 10 % water, to hazardous waste incineration/CH U
m3
0.021
Treatment, sewage, from residence, to wastewater treatment, class 2/CH U
Table 2 Primary data referred to the German module used in to the SimaPro Raw materials to module production
Main component
Glass Loom Embedding slide Back skin Cells Cells Cover socket Solders (2.3×0.15 mm, 5.0×0.5 mm)
Solar glass Aluminium Ethyl vinyl acetate Polyvinyl fluoride Silicon Polypropylene Aluminium Copper
Unit (kg/m2)
9.89 2.23 0.91 0.40 0.46 0.24 0.24 0.15
Italian facilities. It was possible to obtain part of the requested data, and the rest was collected from national statistics (sources: ENEL, ISTAT and websites related to the Photovoltaic sector) and then harmonized with the environmental data. The S-LCA indicators selected for this application are related to the workers’ group (UNEP/SETAC 2009).
Table 3 Primary data referred to the Italian module
Components Tempered glass Aluminium EVA (two foils) Backsheet
Amount (kg/m2) 10 2.012 0.914 0.396
Author's personal copy Int J Life Cycle Assess (2012) 17:1068–1079
1073
Workers are important stakeholders, and they are directly related to the product chain. The considered impact categories, according to the UNEP/SETAC guidelines, are: discrimination, child labour, wages, working hours, social benefits and health conditions. It was important to distinguish the workers of the plant in term of ages and gender in order to identify possible discrimination in the considered companies. An important distinction has been made between workers directly involved in the product chain and the other workers. Consequently, it was possible to identify “direct workers”, who are part of management level (ML) and workers in the production line.
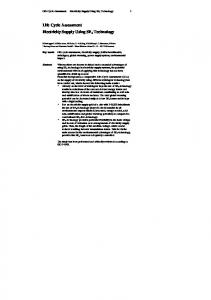
3 Results 3.1 Life cycle sustainability assessment As a first step, the disaggregated results of each assessment are here reported and an integrated comparison is proposed and carried out. As shown by Table 4 and Figs. 1 and 2, the results of LCA are not always in the same direction. The German modules are better for some impacts categories and the Italian one for others. Since no changes in the equipment and energy or environmental management of the German module were implemented in the two production sites between the 2008 and 2009, the environmental impacts of German module in the two considered years have the same values of all indicators. According to the obtained results, the energy production of the German module at full load is 1.232 kWh/module per year and, with an extrapolation from direct data, the energy consumption to produce a square metre of module has been evaluated as 0.751 kWh/m2. As far as the production of the Italian module, direct information has been collected and the energy requirement is of about 7.725 kWh/module, which corresponds to 4.711 kWh/m2. A plausibility analysis was elaborated. The results obtained by the analysis of the environmental impact of the Italian and German modules are in accordance with the average data of
Fig. 1 Comparison of life cycle assessment results of German and Italian modules—some figures of midpoint category [in potential disappeared fractions (PDF) square metres per year]
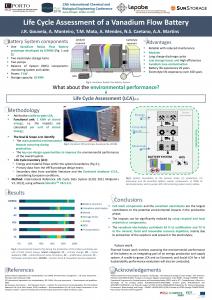
SimaPro, and so their confidence intervals are acceptable for the same reason. The LCC results are reported in Fig. 3. There are some differences in the costs from 2008 to 2009 in the German product: e.g. the German 2008 module has lower costs of equipment (4.26 €/m2) and labour force (11.35 €/m2), while it has higher costs of cells (132 €/m2) and other materials (30 €/m2) The best overall economic performance is achieved by the German modules in both years, comparing with the Italian one which has higher costs for each category except for labour force and equipment ones. No data about revenues have been obtained from the analysed companies because of confidentiality reasons.
Table 4 The results on Human Health of German and Italian modules— midpoint impact categories Impact categories Carcinogens Respiratory organics Respiratory inorganics Climate change Radiation Ozone layer
DALY DALY DALY DALY DALY DALY
DALY disability-adjusted life years
German module
Italian module
1.90E−05 1.19E−07 9.32E−05 4.5E−05 7.35E−07 1.89E−08
1.43E−05 1.25E−07 1.01E−04 3.00E−05 7.75E−07 1.96E−08 Fig. 2 Comparison of life cycle assessment results of German and Italian modules—some figures of midpoint category (MJ surplus)
Author's personal copy 1074
Int J Life Cycle Assess (2012) 17:1068–1079
Fig. 3 Comparison of life cycle costing results of German and Italian modules
The last assessment focuses on the social impacts. The considered stakeholder group is workers: they have been divided in workers involved in the product chain (direct workers) and the rest of the workers; then, they have been further grouped as workers at ML and other workers. The obtained results for the functional unit are reported in Figs. 4 and 5. All data are related to the functional unit, to identify which is the social performance of the product. Since the considered stakeholder group is the workers, the used
perspectives are in their favour: it means that all benefits (wage, holiday, undetermined contracts and so on) are considered as positive impacts. More specific indicators are desirable to improve the analysis, but since this is the first implementation of LCSA to a PV module, not so many data are available. This study is the first attempt to assess the three dimensions of sustainability of the PV modules, and of course, further implementations are desirable to improve the quality of the indicators and data.
Fig. 4 Comparison of social life cycle assessment of German and Italian modules—gender composition of job
Author's personal copy Int J Life Cycle Assess (2012) 17:1068–1079
1075
Fig. 5 Comparison of social life cycle assessment of German and Italian modules—other social aspects
3.2 Life cycle sustainability dashboard The LCSD has been implemented to compare and to present the results in an easy but still comprehensive and complete way. The present case study and the obtained results are a practical example of LCSD’s potential to support decisionmaking processes which occur inside public administrations to fix criteria for green public procurement, inside companies to support their strategic plans or even at consumers’ level, for a really sustainable choice. The LCSA has the same goal of LCSD, but the complexity of the indicators used, and the disaggregated way to present the results for each method, may represent a barrier to be used in a decision-making process where expert and no experts are involved. Once the LCSA of more products of the same groups has been implemented, the obtained results can be used as inputs for the LCSD implementations. The ability to contemporarily present the results thanks to a ranking score
and a colour scale, along with the quantitative values of each indicator, makes the interpretation step easier and more understandable for all stakeholders. Moreover, when the results, for example the ones related to PV modules, German scenario 2008 and 2009, are used internally in the same company, LCSD makes the assessment more transparent for all internal workers The first step is to build the database for the comparison, inserting the product performance values of each indicator. The results of LCSD of German and Italian modules are shown in Figs. 6 and 7. The tool allows to present the results contemporarily through a colour scale, a score and the original data. For example Fig. 6 shows the comparisons result of the sustainability performance of the three scenarios: the position of the arrow changes according to the sustainability performance of each scenario. The dashboard at the bottom on the right presents the relative distance of sustainability performance of the three scenarios.
Author's personal copy 1076
Int J Life Cycle Assess (2012) 17:1068–1079
Fig. 6 Comparison of the three different scenarios by sustainability performance index: The Sustainability Performance INdex = SPI of each scenario is reported by score and position of the arrow in the LCSD
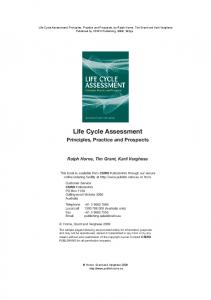
The potential of the tool is evident; in fact, it gives a comparison of the results by colour and score of sustainability performance of each scenario and in the same time it is possible to see the obtained results for each topic (see the colour of each sector) and each indicator. For each indicator it is possible to show the relative score and position in comparison to the other scenarios or products introduced in the database. The performances of each indicator per scenario compared to the others are shown in Fig. 7. Moreover, it is possible to open the Excel file that is the source of the LCSD and show all numerical values for a transparent assessment with an expert audience. Another option of LCSD is the opportunity to give different weights to each indicator. It could be related to the strategies of politics and companies, but experts should manage it, because it could lead to a false aggregate evaluation results. The best scenario would be to have a consultation process for choosing the weights, so the decision and the following evaluation are transparent. In this case, to avoid misinterpretation, the same weight or importance has been given to each indicator.
4 Discussion and conclusions While sustainability has become accepted by all stakeholders as a guiding principle, the challenge to clearly determine and measure sustainability performance remains, especially for products and processes. Even if the three methodologies, LCA, LCC and S-LCA, have different maturity levels, the concept to use LCSA as a complete evaluation methodology for products is globally accepted by the scientific community. In this first application of LCSA and LCSD to PV modules, the final comparison has shown that the best overall sustainability performance is obtained by German module 2008 and the worst one by Italian module 2008 (see Fig. 6). The final conclusions are due to all indicators’ performances, as shown by Fig. 7, where the results of comparison of the three scenarios by each indicator are summarized. A more detailed commentary is required for the other two products. The Italian scenario 2008 has the worst environmental performances of the three scenarios because most of the indicators have high impacts such as fossil fuels, minerals, respiratory organics and so on. It is confirmed by the
Author's personal copy Int J Life Cycle Assess (2012) 17:1068–1079
1077
Fig. 7 Comparison of the three different scenarios shown by indicators
fact that 8 indicators out of 11 have dark grey colour that represent a bad performance of the indicator. For the economic and social dimensions, a different conclusion can be summarized: &
The Italian module 2008 has the highest costs of PV cells, raw materials and electricity; in fact, these three indicators (three out of six) have dark grey colour in Fig. 7.
&
The German module 2009 has the worst social impacts, with particular regards to minimum and average wage, number of workers, directly and no directly involved in the product chain and so on. It is confirmed by the numerous indicators that have dark grey colours in Fig. 7.
The difference between the best performance of German module 2008 and the one of German module 2009 is mainly
Author's personal copy 1078
due to the social performance. This result can be plausible because of the crisis that has forced the company to focus on the economic performances. Among the social indicators, the average wage per functional unit is apparently difficult to justify and needs a further reflection. In fact, even if it increased between 2008 and 2009, it does not mean that actually the wage of the workers has been increased, but on the contrary the productivity of the company decreased because of the crisis. Difficulty to be interpreted is also the difference between economic and social assessment. Where the environmental assessment has a straightforward goal to reduce the environmental impacts of the product, the economic and social strongly depend on the stakeholder’s perspective: what is a benefit for a company is not necessary for workers and local communities. But even when the perspective is only the company, how could it be assumed here, to support sustainable decision different factors—often in contrast among them—should be taken into account. For example, if the goal of the company is the reduction of the total costs, it is necessary to find a compromise to assure benefits and living salary to its workers, otherwise it would not be considered a sustainable company. This case study is the first application and has no ambition to be an exhaustive and complete implementation of LCSA and LCSD to a product, but an example of transparent and comparative assessment of sustainability performances of product. It is clear that the necessity to implement case studies to calibrate indicators and weights has a high importance, and at the same time, LCSA has to deal with the trade-off between validity and applicability. By the way, the fact that it was possible to implement the case study with the cooperation and interest of the companies confirms the practicability and applicability of both LCSA and LCSD. The importance of LCSA as a supporting tool for decision-making process has become evident and, consequently, an effective and efficient way to present LCSA results is of primary importance. This is a prerequisite for the communication of LCSA results to the non-expert audience of real world decision makers in public and private organizations. The new approach of dashboard of sustainability, the LCSD, has shown strong potential to solve this problem of communication. Of course the necessity to increase the database, in particular regarding economic and social aspects of product life cycle, should not be neglected. Further implementations to the same product and also to others are highly requested and recommended in the near future.
References Alsema EA (2000) Energy pay-back time and CO2 emissions of PV systems. Prog Photovolt Res Appl 8:17–25
Int J Life Cycle Assess (2012) 17:1068–1079 Alsema EA, De Wild MJ (2006) Environmental impacts of crystalline silicon photovoltaic module production. Presented at 13th CIRP Intern Conf on life cycle engineering Asdrubali F (2009) The role of Life Cycle Assessment (LCA) in the design of sustainable buildings: thermal and sound insulating materials, Presented at Euronoise, Edinburgh, Scotland, 26–28 October 2009 Dreyer LC, Hauschild MZ, Schierbeck J (2006) A framework for social life impact assessment. Int J Life Cycle Assess 11 (2):88–97 EPIA (2010) “Global Market Outlook for Photovoltaics until 2014”. www.epia.org. Accessed May 2010 Finkbeiner M, Reimann K, Ackermann R (2008) Life Cycle Sustainability Assessment (LCSA) for products and processes. SETAC Europe 18th Annual Meeting, 25–29 May 2008, Warsaw Finkbeiner M, Schau E, Lehmann A, Traverso M (2010) Towards life cycle sustainability assessment. Sustainability 2(10):3309–3322, http://www.mdpi.com/2071-1050/2/10/3309/, last call 15th Dec. 2010 Fthenakis VM, Kim HC (2009) Photovoltaics: life-cycle analyses. Sol Energy 85:1609–1628 GSE (2011) Gestore Servizi Energetici. www.gse.it. Accessed November 2011 Hardi P, Semple P (2000) The dashboard of sustainability—from a metaphor to an operational set of indices, in Fifth International Conference on Social Science Methodology: Cologne, Germany, 2000 Hunkeler D, Lichtenvort K, Rebitzer G, Andreas Ciroth A, Huppes G, Lichtenvort K, Rüdenauer I, Stehen B (2008) Environmental life cycle costing. SETAC Publications, Brussels ISO 14040 (2006) Environmental management—life cycle assessment— principles and framework. International Organisation for Standardization ISO 14044 (2006) Environmental management—life cycle assessment— requirements and guidelines. International Organisation for Standardization, Geneva Jesinghaus J (2000) On the art of aggregating apples & oranges. Fondazione Eni Enrico Mattei, Milan Jǿrgensen A, Le Bocq A, Nazarkina L, Hauschild M (2008) Methodologies for social life cycle assessment. Int J Life Cycle Assess 13 (2):96–103 Kloepffer W (2003) Life-cycle based methods for sustainable product development. Int J Life Cycle Assess 8:157–159 Kloepffer W (2008) Life cycle sustainability assessment of products. Int J Life Cycle Assess 13(2):89–95 Koroneos C, Stylos N, Moussiopoulos N (2006a) LCA of multicrystalline silicon photovoltaic systems: present situation and future perspectives. Int J Life Cycle Assess 11(2):129– 136 Koroneos C, Stylos N, Moussiopoulos N (2006b) LCA of multicrystalline silicon photovoltaic systems: application on an island economy. Int J Life Cycle Assess 11(3):183–188 Leleman R, Albrecht J, Dewulf J (2011) Life cycle analysis to estimate the environmental impact of residential photovoltaic systems in regions with low solar irradiation. Renew Sust Energ Rev 15:267–281 PE International, LBP (2009) GaBi 4 Software-System und Datenbank zur Ganzheitlichen Bilanzierung, 2009th edn. Echterdingen, Stuttgart, 2007 PRé Consultants (2010) SimaPro 7, Pré-Product Ecology Consultants, The Netherlands, http://www.pre.nl Accessed April 2011 PRé Consultants BV (2008) Eco-Indicator 99. Principles. http:// www.pre.nl/eco-indicator99/eco-indicator_99.htm Accessed Feb 2011
Author's personal copy Int J Life Cycle Assess (2012) 17:1068–1079 REN21 (2011) Renewables 2011 Global Status Report. Version 2.1. 08/2011 (Paris: REN21 Secretariat) Swarr TE, Hunkeler D, Kloepffer W, Pesonen H-L, CIroth A, Brent AC, Pagan R (2011) Environmental life cycle costing: a code of practice. SETAC publication Traverso M, Finkbeiner M (2009) Life Cycle Sustainability Dashboard. Proceeding of the 4th International Conference
1079 on LCM2009, 6–9 September 2009, Cape Town, South Africa UNEP/SETAC (2009) Guidelines for social life cycle assessment of products. United Nations Environment Programme UNEP/SETAC (2012) Towards Life Cycle Sustainability Assessment, United Nations Environment Program, Paris SETAC Life Cycle Initiative United Nations Environment Programme