Towards Management of Complex Service Compositions - Position Paper Lianne Bodenstaff∗, Roel Wieringa, Andreas Wombacher University of Twente {l.bodenstaff,r.j.wieringa,a.wombacher}@utwente.nl Abstract Many companies offer physical products combined with on-line services. For example, product configuration, ordering, order tracking, and payments can be done on-line. The service part of the total offering (the composition) is typically composed of services offered by providers where performance of both the composition (provided by the company) and the input services (obtained from providers) is governed by service level agreements (SLAs). The goal of our approach is to diagnose the performance of an on-line service composition in terms of the performance of on-line input services, with respect to the performance indicators mentioned in the SLAs, and to do this in real-time. Classical SLA monitoring techniques are batch-oriented and are not usable in the highly dynamic environment of Web service provision, where provider relations may change even during service delivery. Our techniques use real-time analysis of log files to trace and diagnose performance onthe-fly. Current Web service monitoring techniques do not relate a composite service to its components, as needed to provide diagnostic information. Furthermore, current approaches do not take into account that the dependency of a composition on its components varies for different attributes (such as cost and response time). In this paper we propose to extend our previous research in this area by lifting a number of simplifying assumptions to make the approach applicable in real-life, and by extending our study to frequently used SLAs in practice.
1 Introduction Many companies offer physical products combined with Web services. For example, companies selling servers on-line order required components on-line from suppliers world-wide and assemble them for just-in-time delivery. ∗ This research has been supported by the Dutch Organization for Scientific Research (NWO) under contract number 612.063.409
Manfred Reichert University of Ulm
[email protected]
Services from both providers and company are offered according to some Service Level Agreement (SLA), specifying the provided performance. This situation occurs in many branches of industry besides in a Web service environment, such as electronics companies, car manufacturers, and furniture companies. The problem considered in this paper is how a service administrator can explain service composition performance in terms of performance of its service providers. A service administrator in this paper monitors and (re)negotiates SLAs provided or used by the company. In this position paper we describe our approach, Monitoring Complex Service Compositions (MoCSCo), that aims for real-time performance diagnosis to enable offering competitive SLAs in a highly dynamic environment.
Quality of service (QoS) research in supply chains is well established but rather assumes a static supply chain in which data are collected and analyzed over a time period [7, 19]. In e-commerce, by contrast, each supply chain may exist for one delivery only, and providers may be switched even during execution. We therefore need algorithms that allow real-time monitoring and diagnosis of QoS. In MoCSCo we will provide sophisticated tools and algorithms for monitoring composition performance in realtime and diagnosing its performance in terms of component services obtained from third parties. This is a first step towards automatic composition management.
In Section 2 we describe our current work by means of a small example, followed by Section 3 where a motivating example is described. In Section 4 we describe the four different research questions we aim to tackle. After this, we give a description of the envisioned methodologies to use for answering these questions in Sections 5, 6, 7, and 8. Related work is discussed in Section 9 after which we conclude this paper with a short discussion and summary in Section 10.
SLAs
Dependency analysis
Dependency trees
Log analysis
Performance trees
Logs
Service composition
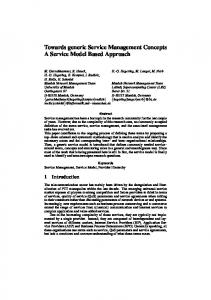
Figure 1. Tool architecture. One dependency and performance tree for each attribute.
2 Current work
for a subset of services (sum(subset)). The algorithm determines these expected values by taking the invocation probability together with the expected average attribute value into account. The contribution factor for an ORDISC depends on the probability a branch is invoked per composition invocation (for cost) and its probability to be the fastest responding (for RT). More specifically, the estimated composition RT is in this case determined by determining the invocation chance for each subset of two branches (recall that two branches out of three are invoked) based on the estimated invocation chance for each branch. Together with the average response time for each branch, we calculate for each subset of two branches which branch is most likely to finish first. Now, we determine the average response time for the ORDISC based on the expected response time of each subset of three services and the invocation chance of that subset. Furthermore, we use this information to determine for each service its Impact Factor (IF) which is a combination of its estimated average response time and the chance it is the fastest responding branch when invoked. For example, WS 3 has an expected impact of 0 concerning response time since is expected to always be the slowest service when invoked. The second major part of the algorithm is the log analysis, where we analyze a log of service invocations and construct the performance tree, in which we show four things [11]:
This position paper continues our current work on QoS monitoring and diagnosis, Monitoring Dependencies for Service Level Agreements (MoDe4SLA) [8, 11, 10], that allows us to monitor QoS attributes and diagnose observed performance under a number of simplifying assumptions. Our tool architecture is shown in Figure 1. Dependency analysis analyzes for each attribute how performance of the composite service depends on its component services. This dependency varies for different attributes. We currently do cost and response time analysis, and will extend this with at least availability in this project. Log analysis uses for each attribute the dependency tree and log of service invocations to diagnose the composition performance in terms of its components. To be meaningful, we assume for this diagnosis that the internal business process by which the composite service (delivered to a customer) is constructed from the component services (obtained from providers), does not distort the composition logic of the service. In detail, in dependency analysis we derive for the most common workflow patterns, and for each performance attribute, how performance of the components influence the composition performance. We use the following constructs from the workflow pattern library [1, 2]: sequence, AND split and join, AND split and discriminative join, OR split and join, OR split and discriminative join, XOR split and join, and loop. For example, Figure 2 shows a composition tree with an OR split and discriminative join (ORDISC) where 2 out of 3 branches are invoked and the split succeeds with the first responding service. Each branch indicates its invocation probability compared to its siblings, i.e., WS 1, WS 2, and WS 3 have a chance of 0.2, 0.3, and 0.5 to be chosen, respectively. The response time (RT) and cost dependency trees depict the expected average impact of each service on response time and cost of the composition (impact factor IF), and the expected average number of contributions per composition invocation (edge annotations with contribution factor), respectively. Composition RT is determined by the longest response time of a subset of services (max(subset)), while composition costs are determined by the sum of costs
• A trace of composition performance to performance of its components; • Realized impact factors of component services; • Realized contribution factors and any deviations with expected values; • Any SLA violations of average attribute values when they contributed to the composition; As indicated above, in MoCSCo we will add availability as third relevant attribute, and our case studies may reveal additional relevant attributes. Also, in the current version of the tool we have made a number of independence assumptions that need to be dropped for the tool to be applicable 2
COMP
OR DISC
0.2 0.3 0.5
WS 1
RT: 2 ms Cost: € 6
WS 2
RT: 5 ms Cost: € 4
WS 3
RT: 6 ms Cost: € 2
Composition tree
IF: 0.28
WS 2
IF: 0.72
WS 3
IF: 0
0.49
RT: 3.53 ms COMP
WS 1
tion chance based on the estimated chance to be chosen on the branches. With the average response time for each branch and the chance for each subset of branches to be invoked, we can determine which branch will most likely be the second to finish for each subset. Recall that the ORDISC construct succeeds after the second branch responds. Now, we can determine the average response time for the ORDISC based on the expected response time of each subset of three services and the invocation chance of that subset. For example, the first and second branch are not expected to ever be the second responding branch, therefore, their expected impact is 0. On average, the third branch with the XOR split is expected to determine the response time in 57% of the composition invocations. Recall from Figure 3(a) that the chance to be invoked for WS 4 and WS 5 is 0.4 against 0.6. Therefore, on average, WS 4 contributes 0.4 · 0.57 = 0.23 times to the overall response time when the composition is invoked. The impact of WS 4, i.e., the average contribution to the total response time, is 0.31. This value is calculated using the average response time of WS 4 (6ms), the average response time of the composition (4.46 ms), and the number of times the WS is expected to contribute to the response time of the composition (0.23): 6 4.46 · 0.23 = 0.31.
max(subset) 0.51 0
RT dependency tree
Cost: € 7.30 COMP
0.49 total(subset) 0.67 0.84
WS 1
IF: 0.40
WS 2
IF: 0.37
WS 3
IF: 0.23
Cost dependency tree
Figure 2. Composition example with response time and cost dependency trees.
The cost dependency tree in Figure 3(c) depicts the expected average contribution of each Web service to the composition cost (i.e., the impact factors). Furthermore, it depicts how often a service is expected to contribute to the costs per composition invocation (i.e., the values on the branches). For costs it holds that each invoked service has to be paid. Therefore, the ORDISC results in the summation of costs of a subset of its outgoing branches (in this case 3) (sum(subset)). For each subset of three branches we calculate the invocation chance. For each branch we determine the average invocation chance by summating the chances of each subset where the service is contained. The results are depicted on the outgoing branches and add up to 3 since each composition invocation invokes 3 branches that all contribute to the cost of the composition. For the XOR split in the third branch we calculate the invocation chance for WS 4 and WS 5 (0.4·0.8 = 0.32, and 0.6·0.8 = 0.48, respectively) and therefore contribute to the composition cost. The expected impact factor for each service is again calculated by dividing the average cost of the service (e.g. e4 for WS 1) with the average composition cost (e14.47) and multiplying this with the chance the service actually contributes 4 (0.73): 14.47 · 0.73 = 0.20.
to realistic cases. This is the major task of the MoCSCo project
3 Motivating Example To motivate the necessity for our proposed research, we show in this section the complexity of monitoring service compositions while taking simplifying assumptions into account as we do in MoDe4SLA. This more complex example is depicted in Figure 3 where the composition, Figure 3(a), consists of an OR split with discriminative join (ORDISC) where 3 out of 4 branches are invoked and the construct succeeds after the fastest two invoked branches succeed. Each branch indicates the invocation chance compared to its siblings. The first branch is an AND split and join where WS 1 and WS 2 are invoked in parallel. The second branch consists of a single Web service WS 3, and the third branch is an XOR split where either WS 4 (chance is 0.4) or WS 5 (chance is 0.6) is invoked. The fourth branch consists of WS 6. Each service has an agreed upon average response time and cost attribute described in its SLA. The response time dependency tree Figure 3(b) depicts the expected average impact of each service on the response time of the composition. For the OR split with discriminative join we calculate the estimated response time of each branch. For each subset of three branches (recall that three branches out of four are invoked) we calculate the invoca-
For this example we can now derive that the response time of the composition is influenced by WS 4, 5, and 6. Furthermore, we can see that they have a comparable impact. Concerning the composition cost, we can derive that WS 4 and 5 have a comparable low impact and WS 6 contributes to almost 30% of the cost. Furthermore, we see 3
that for response time WS 6 contributes in 43% of the invocations and WS 4 and WS 5 23% and 34%. For the costs, service 1, 2, 3, and 6 all contribute in 70−80%, and services 4 and 5 only 30 − 50% of the invocations. As becomes clear for this example, monitoring dependencies for service compositions is not straightforward. Therefore, more research is needed to support management of these complex constellations.
COMP
OR DISC 0.2 AND
4 Research Questions and Methodology
0.3
0.4
WS 3
XOR
RT: 5 ms Cost: € 4
We pursue four questions in MoCSCo. Q1 and Q2 are preliminary questions while Q3 and Q4 require the most research effort:
WS 2
WS 4
RT: 2 ms Cost: € 4
RT: 3 ms Cost: € 3
RT: 6 ms Cost: € 2
WS 6 0.6
0.4
WS 1
0.1
RT: 4 ms Cost: € 6
WS 5 RT: 4 ms Cost: € 3
Composition tree
Q1 What is the structure of SLAs? Q2 How can we monitor composition performance as required by its SLA? Q3 How can we diagnose performance of the composition? Q4 How accurate and efficient is the algorithm in practice?
(a) Composition RT: 4.46 ms COMP 1 max(subset) 0
In Q3 we will extend the MoDe4SLA approach by considering additional real-life complexity of the compositions. The following items are discussed:
max(total)
0.57
WS 3
max(one)
IF: 0 0
• Ranges of attribute values • Dependencies between attributes
0.43
0
0.23
0
WS 6 IF: 0.39
0.34
WS 1
WS 2
WS 4
WS 5
IF: 0
IF: 0
IF: 0.31
IF: 0.3
RT dependency tree
• Dependencies between SLAs
(b) Response time dependency tree
• Automatic homogenization Cost: € 14.47
• Dependencies between compositions
COMP 1
Each of these items will lead to an extension for the current MoDe4SLA approach. The four questions are discussed in the following four sections.
sum(subset) 0.73 sum(total)
5 SLA Structure
0.73
To develop a monitoring approach applicable in real-life we need to answer the following question:
0.8
0.77
sum(one)
WS 3 0.73
WS 1
WS 2
IF: 0.2
IF: 0.15
0.7
IF: 0.21 0.32
WS 6
0.48
IF: 0.29
WS 4
WS 5
IF: 0.04
IF: 0.1
Cost dependency tree
Q1 What is the structure of SLAs?
(c) Cost dependency tree
So far, we reviewed several SLA structures as used in different SLA languages like WSLA [14] and SLAng [15], and in specific domains like IP networks [24] and resource management [13]. To assure applicability of our performance analysis in real-life we will extend this review. We will do case studies with industrial partners of other, related projects of the Information Systems group, among others Philips, Daimler, IBM and Cisco. In addition, we plan a
Figure 3. Illustrative composition example with response time and cost dependency trees.
4
systematic literature review to collect knowledge about QoS attributes and their dependencies. We will summarize the results in SLA patterns which will be test cases in the remainder of the project. So far, WSLA [14] has served our purpose, but if necessary, we will extend the language.
As indicated, we plan to add availability as third attribute, and possibly other relevant attributes revealed by answering Q1. The major task in answering Q3 is, however, to drop a number of simplifying assumptions we made in MoDe4SLA. We discuss these in the following subsections.
6 Monitoring Performance
7.1
Ranges of attribute values
So far, we ignored attribute value ranges, but in real-life, SLAs use these ranges. Consider the following examples:
Here, we discuss how to approach the practical problem of monitoring composition performance:
Response time of service A will be 7 − 9 ms with an average of 8 ms.
Q2 How can we monitor composition performance as required by its SLA?
Response time of service B will be 1−15 ms with an average of 8 ms.
To monitor performance, we need to relate service execution logs to the composition in terms of component services. We abstract from the internal business process that defines the composition, and follow on the dependency logic of the composition structure. Since we assume this logic follows constructs from the considered workflow patterns, our approach is language independent concerning composition specification. We currently simulate logs that consist of sequences of the form . We relate log messages to composition structures by reconstructing the message invocation order through their time stamps. For real-life logs without time stamps or compositions that contain nested loops (unnested loops can be handled this way), a more complex approach is needed where logs are related to the structure through annotating messages when they enter the logs [9]. In MoCSCo we will explore the time stamp and annotation approaches by means of simulated logs and logs obtained from case studies done for Q1. Note that performance monitoring is not process mining [23] because we have a process structure against which to analyze a log. Our problem is related to both performance checking [20], and variant mining [17] because we are interested in deviations from a given process. But where variant mining looks for structural variations of a process, and conformance checking for structural deviations between a process and its logs, we search for performance variations of a process with the same structure.
We currently treat these performance requirements as identical since we consider averages. For a proper diagnosis of SLA violations, we need to reason about value ranges. Therefore, we will incorporate variance in the impact analysis computation, where the impact of services with high variance is greater than the impact of a stable service. We need to experiment with various ways of doing this while keeping complexity of dependency and diagnosis computation down. Our first subgoal therefore is: Extension 1: Extend the computation of dependency tree and impact values with variance between services concerning a specific attribute (e.g. response time).
7.2
Dependencies between attributes
We currently assume attributes are mutually independent. However, in real-life SLAs inter-dependencies are common. Consider the following SLA: Every month, response time will be within 3 ms at least 99% of the invocations. Costs are 3 euro when the service responds within 2 ms while a response time of 2 − 3 ms costs 2 euro. If less than 99% of the invocations have response time within 3 ms a penalty of 1000 euro is paid. In this SLA, cost directly depends on response time. The challenge is to represent what this means for the relative contribution of component service performance on the composition cost. For example, to diagnose the cause of an increase in composition cost, we need to show the influence of decreasing response times to the cost (i.e., costs rise to 3 euro). To solve this, we intend to represent dependencies between models by constructing links between
7 Diagnose Performance The main identified research question is on how to actually diagnose performance: Q3 How can we diagnose performance of the composition? 5
attributes. These links should be annotated with some contribution function, similar to causal arrows in causal loop diagrams [22]. Our goal is to represent causal influence between attributes as accurately as necessary for meaningful diagnosis. For example, in the above example it may be sufficient to represent that a decrease in response time will cause an increase in cost. This leads to our second subgoal in answering Q3:
Extension 4: Extend the computation of dependency tree and impact values so that they can handle mismatches in, for example, attributes or time frames for dependencies between SLAs.
7.4
In practice, compositions may comprise hundreds of services so that manual mismatch handling is not feasible. Ultimately, our solution should therefore be fully automatic, while maintaining accountability, i.e. service administrators should be able to check which SLAs were incompatible, why, what is done about it, and what the effects are on diagnosis.
Extension 2: Extend the computation of dependency tree and impact values with dependencies between attributes within one SLA, balancing computational efficiency with diagnostic capability. A third elaboration to meet conditions of real-life SLAs is the imposition of violation penalties. An example is the above SLA, where 1000 euro have to be paid in case the response time requirement is not met. We could add this as additional cost, with a dependency on the performance of other attributes. However, this would ignore the special status of penalties. Another solution is to create separate penalty dependency tree. We need to experiment with this and possibly other options to find the best way to monitor and diagnose penalties. Our third subgoal is accordingly the following.
Extension 5: Automatically homogenize SLAs in a composition in an accountable manner.
7.5
Dependencies between compositions
Another class of dependencies arises due to the fact that many services come in sets, such as services for gold, silver and platinum members, each with different but structurally similar SLAs. The representation problem is similar to specifying software product families, and might be solved using techniques from that field. The diagnosis problem is new, however, because it requires relating performance diagnosis of sets of related services. Another kind of dependency stems from reuse of composition results. For example, a company providing on-demand news by querying several databases of other providers, might reuse results when same or similar invocation is done in a different service composition. Reuse causes reduced invocation costs. In real-time monitoring, it is not possible to determine which reuse cases will occur, which makes representing invocation costs accurately impossible. Consequently, relating different compositions using the same data will be an ongoing process, causing updates in cost models, falsifying historic dependency analysis. Our sixth subgoal is therefore the following:
Extension 3: Extend the computation of dependency tree and impact values with penalties for SLA violations.
7.3
Automatic homogenization
Dependencies between SLAs
When relating different SLAs of a composition and its components, we assume these SLAs are of equal structure. However, the composition SLA may, for example, mention response time, while some component services do not. This complicates diagnosing composition performance since causes for too long response times can only be traced when all components are monitored for it. We need to experiment to deal with “missing attributes” to find out which ways give useful performance tree diagnoses. One way might be using default or historical values, although this may obscure performance tree diagnosis. Another structural mismatch arises with incompatible time frames. Here, we can impose a time ontology that unifies the smallest time units and harmonizes the ontology of time periods. Especially scaling down time frames will cause challenges since averages over partial time periods might not be representative for the total SLA time frame. Therefore, we need to decide on a trade off between ontological correctness and computational tractability. Our next subgoal is therefore the following:
Extension 6: Extend the computation of dependency tree and impact values with dependencies between compositions.
8 Accuracy and Efficiency of the Algorithm We will validate our solutions of Q3 on simulations with SLAs taken from the results of Q1. However, we intend to do two more case studies, unrelated to the requirements elicitation from Q1: one to test accuracy and one to test efficiency. For this purpose, our tool will automatically derive dependency models for a given composition. Furthermore, 6
it will analyze logs and calculate performance trees for the service administrator.
service composition. In traditional supply chain management, quality is measured over batches of products and over longer periods of time with a decision point at the end on whether or not to change provider. Real-time systems design and analysis also studies the composition of systems from components with known QoS guarantees [16]. The design and analysis algorithms developed in this research areas are widely used for Web service research, but here too runtime dynamics of service compositions with respect to changing providers, services, or compositions, and necessity for direct, instance-based, monitoring of QoS, needed for our goals, are not covered. For example, in service selection research, QoS of a composition is related to that of its components while composing an optimal composite service at design time [26]. While in this project, we monitor the composition and relate its performance to that of its components at runtime. There are various approaches to monitor Web services. Casati et al. [21] aim at automated SLA monitoring, Pistore et al. [4] enable run-time monitoring while separating business logic from monitoring functionality. The smart monitoring approach by Baresi et al. [5] implements the monitor functionality itself as a service. Further work of Baresi et al. [6] presents an approach to dynamically monitor BPEL processes by adding monitoring rules. None of these approaches relate the performance of a composition to the performance of its components, which is the goal of this project. Mahbub and Spanoudakis [18] do relate the composition to its components but do so to identify specified requirement violations without considering their causes, as we do. Dependency trees are used to do a root cause analysis of SLA violations [3, 12]. These trees are not constructed automatically, as we do, and they represent IT system architectures, rather than service compositions, as our trees do.
Q4 How accurate and efficient is the algorithm in practice? We define accuracy as the extent to which our dependency trees represent contribution of components performance to composition performance. We claim our construction of dependency trees is accurate [11] under following assumptions: • Internal business processes implement the service composition structure so that it does not distort the logic of composition trees, and • Internal business process executions do not deviate from internal business process specifications. Both assumptions may be violated in practice and we will test our approach for this. For our approach to be useful it is sufficient that a significant number of business processes in practice satisfy the above assumptions. In addition, we want to test whether our tool scales up to conditions of practice. We will therefore use it with a composite service of one of our industrial partners to validate feasibility of the setting, and to test constructing dependency and performance trees in real-time. The service administrator should judge (1) impact factors to be valid, and (2) diagnosis to hold useful diagnostic information. For this, our tool will provide graphical feedback models for the user, depicting all identified dependencies. These models should be intuitive to the user and hide the complexity of our approach. Currently, we consider using abstractions from details to hide complexity while users can zoom into services for more detailed information. Here, we define efficiency as the ability to support service administrators in managing services better by using our tool with cost they judge to be acceptable. We will estimate this by a survey of perceived usability and usefulness as done for the current version of our tool [8]. In that survey 34 experts from both academia and industry answered 49 questions in an interactive session on the use of our current approach. The participants were asked to manage service compositions with and without the help of MoDe4SLA models.
10 Discussion and Summary Performance of service compositions has been studied from a specification and design point of view, but not from a monitoring and optimization point of view. With this position paper we do not only provide more insight in the structure of Web-SLAs but also in SLAs in general, and in the way they are related to the logical decomposition of a service composition. In particular our requirement to automatically build dependency trees, as well as automatically and on-the-fly diagnosis leads to identifying the underlying structure of SLAs. This research will pave the way for automatic management of service compositions in, for example, outsourcing, data and process integration, and value-added services.
9 Related work Operations researchers study supply chain management techniques [25]. Such research ensures purchasing goods and services at the right time and price for just-in-time delivery [27], and purchasing goods and services at the right level of quality [7]. The major difference with our research is that we allow for greater dynamics of service composition, so that a provider can change during execution of the 7
Our approach to monitoring complex service compositions is to answer four relevant questions:
[11] L. Bodenstaff, A. Wombacher, M. Reichert, and M. Jaeger. Analyzing impact factors on composite services. In IEEE International Conference on Services Computing, 2009. [12] D. Caswell and S. Ramanathan. Using service models for management of internet services. IEEE Journal on Selected Areas in Communications, 18(5):686–701, 2000. [13] K. Czajkowski, I. Foster, C. Kesselman, V. Sander, and S. Tuecke. Snap: A protocol for negotiating service level agreements and coordinating resource management in distributed systems. In JSSPP ’02: Revised Papers from the 8th International Workshop on Job Scheduling Strategies for Parallel Processing, pages 153–183, London, UK, 2002. Springer-Verlag. [14] A. Keller and H. Ludwig. The WSLA framework: Specifying and monitoring service level agreements for web services. Journal of Network and Systems Management, 11(1):57–81, 2003. [15] D. Lamanna, J. Skene, and W. Emmerich. Slang: A language for defining service level agreements. In Proceedings of the 9th IEEE Workshop on Future Trends in Distributed Computing Systems-FTDCS, pages 100–106, 2003. [16] P. Laplante. Real-Time Systems Design and Analysis: An Engineer’s Handbook. IEEE Press, Piscataway, NJ, USA, 1992. [17] C. Li, M. Reichert, and A. Wombacher. Discovering reference process models by mining process variants. In Proc. 6th International Conference on Web Services (ICWS’08), 2008. [18] K. Mahbub and G. Spanoudakis. Run-time monitoring of requirements for systems composed of web-services: Initial implementation and evaluation experience. In IEEE International Conference on Web Services, pages 257–265, 2005. [19] M. Naim, P. Childerhouse, S. Disney, and D. Towill. A supply chain diagnostic methodology: determining the vector of change. Computers & Industrial Engineering, 43(1-2):135 – 157, 2002. [20] A. Rozinat and W. van der Aalst. Conformance checking of processes based on monitoring real behavior. Information Systems, 33(1):64–95, 2008. [21] A. Sahai, V. Machiraju, M. Sayal, A. van Moorsel, and F. Casati. Automated SLA monitoring for web services. In International Workshop on Distributed Systems: Operations and Management, pages 28–41, 2002. [22] J. Sterman. Business Dynamics: Systems Thinking and Modeling for a Complex World. McGraw-Hill, 2000. [23] B. van Dongen, A. de Medeiros, H. Verbeek, A. Weijters, and W. van der Aalst. The ProM framework: A new era in process mining tool support. Applications and Theory of Petri Nets, 3536:444–454, 2005. [24] D. Verma. Service level agreements on ip networks. Proceedings of the IEEE, 92(9):1382–1388, 2004. [25] T. Vollmann. Manufacturing Planning and Control for Supply Chain Management. Irwin/McGraw Hill, 2005. [26] L. Zeng, B. Benatallah, A. Ngu, M. Dumas, J. Kalagnanam, and H. Chang. Qos-aware middleware for web services composition. IEEE Transactions on Software Engineering, 30(5):311–327, 2004. [27] K. Zimmer. Supply chain coordination with uncertain justin-time delivery. International Journal of Production Economics, 77(1):1–15, 2002.
• What is the structure of SLAs? • How can we monitor composition performance as required by its SLA? • How can we diagnose performance of the composition? • How accurate and efficient is the algorithm in practice? Q3 is answered by taking a real-life setting into account. The resulting approach is tested in Q4 for accuracy and efficiency, providing the necessary validation of the approach.
References [1] Workflow patterns. http://www. workflowpatterns.com. [2] W. v. d. Aalst, A. t. Hofstede, B. Kiepuszewski, and A. Barros. Workflow patterns. Distributed and Parallel Databases, 14(3):5–51, July 2003. [3] M. Agarwal, K. Appleby, M. Gupta, G. Kar, A. Neogi, and A. Sailer. Problem determination using dependency graphs and run-time behavior models. In International Workshop on Distributed Systems: Operations and Management, volume 3278, pages 171–182. Springer, 2004. [4] F. Barbon, P. Traverso, M. Pistore, and M. Trainotti. Runtime monitoring of instances and classes of web service compositions. In IEEE International Conference on Web Services, pages 63–71, 2006. [5] L. Baresi, C. Ghezzi, and S. Guinea. Smart monitors for composed services. In International Conference on Service Oriented Computing, pages 193–202, New York, NY, USA, 2004. [6] L. Baresi and S. Guinea. Towards dynamic monitoring of WS-BPEL processes. In International Conference on Service Oriented Computing, volume 3826, pages 269–282. Springer-Verlag, 2005. [7] B. Beamon and T. Ware. A process quality model for the analysis, improvement and control of supply chain systems. International Journal of Physical Distribution & Logistics Management, 28, 1998. [8] L. Bodenstaff, A. Wombacher, M. Jaeger, M. Reichert, and R. Wieringa. Monitoring service compositions in MoDe4SLA: Design of validation. In International Conference on Enterprise Information Systems 2009, 2009. [9] L. Bodenstaff, A. Wombacher, and M. Reichert. On formal consistency between value and coordination models. Technical Report TR-CTIT-07-91, University of Twente, 2007. http://eprints.eemcs.utwente.nl/11954/. [10] L. Bodenstaff, A. Wombacher, M. Reichert, and M. Jaeger. Monitoring dependencies for SLAs: The MoDe4SLA approach. In IEEE International Conference on Services Computing, pages 21–29, 2008.
8