Towards perspective-free object counting with deep learning Daniel O˜ noro-Rubio and Roberto J. L´opez-Sastre GRAM, University of Alcal´ a, Alcal´ a de Henares, Spain
[email protected] [email protected]
Abstract. In this paper we address the problem of counting objects instances in images. Our models are able to precisely estimate the number of vehicles in a traffic congestion, or to count the humans in a very crowded scene. Our first contribution is the proposal of a novel convolutional neural network solution, named Counting CNN (CCNN). Essentially, the CCNN is formulated as a regression model where the network learns how to map the appearance of the image patches to their corresponding object density maps. Our second contribution consists in a scale-aware counting model, the Hydra CNN, able to estimate object densities in different very crowded scenarios where no geometric information of the scene can be provided. Hydra CNN learns a multiscale non-linear regression model which uses a pyramid of image patches extracted at multiple scales to perform the final density prediction. We report an extensive experimental evaluation, using up to three different object counting benchmarks, where we show how our solutions achieve a state-of-the-art performance.
1
Introduction
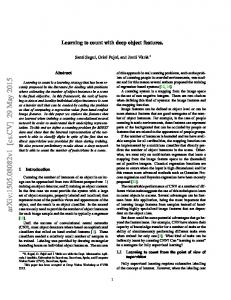
Take an image of a crowded scene, or of a traffic jam. We address here the hard problem of accurately counting the objects instances in these scenarios. To develop this type of ideas makes possible to build applications that span from solutions to improve security in stadiums, to systems that precisely monitor how the traffic congestions evolve. Note that the covered applications define the typical scenarios where individual object detectors (e.g. [1, 2]) do not work reliably. The reasons are: the extreme overlap of objects, the size of the instances, scene perspective, etc. Thus, approaches modeling the counting problem as one of object density estimation have been systematically defining the state-of-the-art [3–7]. For this reason, we propose here two deep learning models for object density map estimation. As illustrated in Figure 1, we tackle the counting problem proposing deep learning architectures able to learn the regression function that projects the image appearance into an object density map. This allows the derivation of an estimated object density map for unseen images. The main contributions of this work are as follows. First, in Section 3.2, we propose a novel deep network architecture, named Counting CNN (CCNN),
2
Daniel O˜ noro-Rubio and Roberto J. L´ opez-Sastre PATCH EXTRACTION
FORWARD PASS
DENSITY MAP ASSEMBLY
CNN REGRESSOR
Fig. 1. We define the object counting task like a regression problem where a deep learning model has to learn how to map image patches to object densities.
which is an efficient fully-convolutional neural network able to perform an accurate regression of object density maps from image patches. Second, we show that object densities can be estimated without the need of any perspective map or other geometric information of the scene, in contrast to most of the stateof-the-art methods [3–8], which require this information. Thus, we introduce in Section 3.3 the Hydra CNN architecture, a scale-aware model, which works learning a multiscale regressor for mapping the appearance of a pyramid of multiple scale patches to an object density map. Like the mythological Hydra creature, each head of our Hydra learns the feature representation for a particular scale of the pyramid. Then, all these head features are concatenated and passed through a set of fully-connected layers, forming the body of the Hydra, which is in charge of learning the high-dimensional representation which performs the final density estimation. Third, in Section 4, we report a thorough experimental validation of the proposed models. Three publicly available datasets are used, two for crowd counting [4, 9] and one for vehicle counting [10]. We show how our solutions report state-of-the-art results in all these heterogeneous scenarios.
2
Related Work
Significant progress has been made to count objects in images. We refer the reader to the survey of Loy et al. [8]. Following the taxonomy introduced in [8], the algorithms can be classified into three groups: counting by detection [1, 2, 11–16], counting by clustering [17, 18], and counting by regression [3–7, 19, 20]. Here we focus the review of the literature on the counting by regression models, because our approaches belong to this group too. But also because these approaches have so far been more accurate and faster, compared to the other groups, defining the state-of-the-art results in most of the benchmarks. Essentially, these methods work defining a mapping from the input image features to the object count. A special attention deserves the learning-to-count model of Lempitsky et al. [6]. They introduce a counting approach, which works by learning a linear mapping from local image features to object density maps. With a successful learning, one can provide the object count by simply integrating over regions in the estimated density map. This strategy is followed also in [5, 20]
Towards perspective-free object counting with deep learning
3
where a structured learning framework is applied to the random forests so as to obtain the object density map estimations. In [3], the authors propose an interactive counting system, which simplifies the costly learning-to-count approach [6], proposing the use of a simple ridge regressor. Our models also treat the counting problem as an object density estimation task, but they are deep learning based approaches which significantly differ from these previous works. To the best of our knowledge, only two works [7, 21] have addressed the object counting problem with deep learning architectures. In [21] a multi-column CNN is proposed, which stacks the features maps generated by filters of different sizes and combine them to generate the final prediction for the count. Zhang et al. [7] propose a CNN architecture to predict density maps, which needs to be trained following a switchable learning process that uses two different loss functions. Moreover, for the crowd counting problem they do not use the direct density estimation of the network. Instead, they use the output of the network as features to fit a ridge regressor that actually performs the final density estimation. Our models are different. First, the network architectures do not coincide. And second, we do not need to either integrate two losses or to use an extra regressor: the object density map is the direct output of our networks, which are trained with a single regression loss.
3 3.1
Deep learning to count objects Counting objects model
Let us first formalize our notation and counting objects methodology. In this work, we model the counting problem as one of object density estimation [6]. Our solutions require a set of annotated images, where all the objects are marked by dots. In this scenario, the ground truth density map DI , for an image I, is defined as a sum of Gaussian functions centered on each dot annotation, X DI (p) = N (p; µ, Σ) , (1) µ∈AI
where AI is the set of 2D points annotated for the image I, and N (p; µ, Σ) represents the evaluation of a normalized 2D Gaussian function, with mean µ and isotropic covariance matrix Σ, evaluated at pixel position defined by p. With this density map DI , the total object count NI can be directly obtained by integrating the density map values in DI over the entire image, as follows, NI =
X
DI (p).
(2)
p∈I
Note that all the Gaussian are summed, so the total object count is preserved even when there is overlap between objects. Given this object counting model, the main objective of our work is to design deep learning architectures able to learn the non-linear regression function R
4
Daniel O˜ noro-Rubio and Roberto J. L´ opez-Sastre
CCNN 72x72
72x72x32
31x31x32
18x18x32
18x18x1000
18x18x400
18x18x1
7x7 7x7
18x18 3x3 1x1
Input Image Patch
Conv1
Conv2
Conv3
Conv4
1x1
Conv5
1x1
Conv6
Density Prediction
Fig. 2. Our novel CCNN model. The input image patch is passed forward our deep network, which estimates its corresponding density map.
that takes an image patch P as an input, and returns an object density map (P ) prediction Dpred , (P )
Dpred = R(P |Ω) ,
(3)
where Ω is the set of parameters of the CNN model. For the image patch P ∈ Rh×w×c , h,w and c correspond to the height, width and number of channels 0 0 (P ) of the patch, respectively. In the density prediction Dpred ∈ Rh ×w , h0 and w0 represent the height and width of the predicted map. Thus, given an unseen test image, our model densely extracts image patches from it, and generates their corresponding object density maps, which are aggregated into a density map for the whole test image.
3.2
The Counting CNN
We introduce in this section our first deep learning architecture, the Counting CNN (CCNN). It is shown in Figure 2. Let us dissection it. The architecture consists of 6 convolutional layers. Conv1 and Conv2 layers have filters of size 7x7 with a depth of 32, and they are followed by a max-pooling layer, with a 2x2 kernel size. The Conv3 layer has 5x5 filters with a depth of 64, and it is also followed by a max-pooling layer with another 2x2 kernel. Conv4 and Conv5 layers are made of 1x1 filters with a depth of 1000 and 400, respectively. Note that we do not integrate any fully-connected layer in the model. With these Conv4 and Conv5 layers, we propose a fully convolutional architecture [22]. All the previous layers are followed by rectified linear units (ReLU). Finally, Conv6 is another 1x1 filter with a depth of 1. Conv6 is in charge of returning the density (P ) map estimation Dpred for the input patch P . Like we specify in Equation (3), we want our deep network to learn a nonlinear mapping from the appearance of an image patch to an object density map. Thus, our CCNN has to be trained to solve such a regression problem. For doing so, we connect to the Conv6 layer the following Euclidean regression loss,
Towards perspective-free object counting with deep learning
l(Ω) =
N
2 1 X
(P )
R(Pn |Ω) − Dgt n , 2N n=1 2
5
(4) (P )
where N corresponds to the number of patches in the training batch, and Dgt n represents the ground-truth density for the associated training patch Pn . Recall that Ω encodes the network parameters. We have implemented our network design using the excellent Caffe [23] framework, and we make use of the popular stochastic gradient descent algorithm to fit the parameters of our models. How do we implement the prediction stage? Given a test image, we first densely extract image patches. As illustrated in Figure 2, we feed the CCNN with image patches scaled to a fixed size of 72x72 pixels. These input patches are passed through our CCNN model, which produces a density map estimation for each of them. Note that due to the two max-pooling layers, the size of the output object density map estimation is 1/4 of the size of the input image patch, i.e. P 18x18 pixels. Therefore, all the predicted object density maps Dpred = R(P |Ω) are rescaled in order to fit the original input patch size. Note that this rescaling ˆ P whose associated count does not necessarily match generates a density map D pred with the original count before the rescaling. Therefore, this new resized density map must be normalized as follows, P DP (p) P P ˆ pred = P∀p pred D ˆ pred . D (5) ˆP ∀p Dpred (p) The last step of the prediction stage consists in the assembly of all the predicted density maps for the patches. In order to generate the final object density map estimation DIt , for the given test image It , we simply aggregate all the predictions obtained for all the extracted patches into a unique density map of the size of the test image (see Figure 1). Note that due to the dense extraction of patches, the predictions will overlap, so each position of the final density map must be normalized by the number of patches that cast a prediction in it. Like we have previously mentioned, we are not the first ones proposing a deep learning model for object counting. Zhang et al. [7] introduce the novel Crowd CNN architecture. In a detailed comparison of both the CCNN and the Crowd CNN, we can discover the following differences. First, the network designs are different. For instance, instead of using fully-connected layers, in our CCNN we have incorporated the fully convolutional 1x1 layers Conv4, Conv5 and Conv6. This speeds up both the training a forwards pass [22]. Second, their learning strategy is more complex. The Crowd CNN model needs to incorporate two different loss functions (one for the density maps and one for the total count of the patches). During the optimization, they implement an iterative switching process to alternatively optimize with one loss or the other. In contrast, our CCNN only uses one loss. And third, our model is more compact. For the problem of crowd counting, Zhang et al. [7] do not use the direct estimation of the Crowd CNN network to obtain the final object density estimation. Instead, they report the results feeding a ridge regressor with the output features of their
6
Daniel O˜ noro-Rubio and Roberto J. L´ opez-Sastre
HYDRA CNN CCNN_S0 CCNN_S0
S0 (72X72)
512
512
324
18X18
S1 (72X72)
Sn (72X72)
Fc8
Fc7
Fc6
CCNN_S1
CCNN_Sn CCNN_Sn
Sn
CCNN_Sn
Fig. 3. Hydra CNN. The network uses a pyramid of input patches (they are cropped and rescaled to a size of 72x72). Each level of the pyramid, representing a different scale, feeds a particular head of the Hydra. All the head outputs are concatenated and passed to a fully-connected bank of layers, which form the body of the hydra.
Crowd CNN network. On the contrary, we do not need any extra regressor, our novel CCNN is learned in an end-to-end manner to directly predict the object density maps. Finally, our experiments (see Section 4.2) reveal that the CCNN improves the results of the Crowd CNN in three of four subsets of the UCSD dataset [4]. 3.3
The Hydra CNN
In a typical pipeline of a counting by regression model, a geometric correction of the input features, using an annotated perspective map of the scene, for instance, results fundamental to report accurate results. This phenomenon has been described in several works, reporting state-of-the-art results (e.g. [6, 8, 5, 7]). Technically, the perspective distortion exhibited by an image, causes that features extracted from the same object but at different scene depths would have a huge difference in values. As a consequence, erroneous results are expected by models which uses a single regression function. With the Hydra CNN model, we want to solve this problem. That is, Hydra CNN must be a scale-aware architecture, which is not allowed to use any previous geometric correction of the scene. Our architecture should be able to learn a nonlinear regression mapping, able to integrate the information from multiple scales simultaneously, in order to cast a precise object density map estimation. This aspect brings a fundamental benefit: Hydra CNN can work in scenarios and datasets which consider not only a single calibrated scene. For instance, a single Hydra CNN model should be able to accurately predict the number of objects for a variety of unseen scenes, exhibiting different perspectives, and generalizing well to real-world scenarios. We attack this problem with the idea shown in Figure 3. Our Hydra CNN has several heads and a body, remembering the ancient serpentine water monster called the Hydra in Greek and Roman mythology. Each head is in charge of learning the representation for a particular scale si from the input pyramid of
Towards perspective-free object counting with deep learning
7
image patches. Therefore, during learning we feed each head with image patches extracted at a particular scale. We have to understand the output of the heads as a set of features describing the images at different scales. Then, all these features are concatenated to feed the body, which is made of fully-connected layers. Notice, that the heads are not necessarily restricted to the same architecture, so their features may have different dimensions, hence the use of fully convolutional layers in the body may not be suitable. Therefore, we use fully-connected layer in order to provide to the net full access to all the head features for the different scales. Essentially, the body learns the high-dimensional representation that merges the multiscale information provided by the heads, and it is in charge of performing the final object density map estimation. Technically, as illustrated in Figure 3, for each head of the Hydra CNN, we propose to use a CCNN model (CCNN s0, . . . , CCNN sn). Note that we simply exclude in each CCNN model for the heads, its final Conv6 layer. Then, the outputs of the different heads are concatenated and passed to the body, where we use two fully-connected layers, with 512 neurons each one. These are the layers Fc6 and Fc7 in Figure 3, which are followed by a ReLu and a dropout layer. We end the architecture with the fully-connected layer Fc8, with 324 neurons, whose output is the object density map. To train this Hydra CNN model we use the same loss function defined in Equation (4). Again the Caffe [23] library is used, following for the optimization the stochastic gradient descent algorithm. Finally, given a test image, we follow the same procedure described for the CCNN model to produce the final object density map estimation. The network design of the novel Hydra CNN is inspired by the work of Li et al. [24] for visual saliency estimation. In [24], they propose a different network architecture but using a multiple input strategy, which combines the features of different views of the whole input image in order to return a visual saliency map. In our Hydra CNN model, we adapt this idea to use the multi-scale pyramid set of image patches to feed our network.
4
Experiments
We have evaluated our solutions using three challenging benchmarks. Two have been proposed for the crowd counting problem: the UCSD pedestrian [4] and the UCF CC 50 [9] datasets. The third one is the TRANCOS dataset [10], which has been designed for vehicle counting in traffic jam scenes. 4.1
TRANCOS dataset
Experimental setup TRANCOS is a publicly available dataset, which provides a collection of 1244 images of different traffic scenes, obtained from real video surveillance cameras, with a total of 46796 annotated vehicles. The objects have been manually annotated using dots. It also provides a region of interest (ROI) per image, defining the region considered for the evaluation. This database
8
Daniel O˜ noro-Rubio and Roberto J. L´ opez-Sastre
provides images from very different scenarios, which have not been parameterized. Moreover, the cameras can move in the same scene, and no perspective maps are provided. We strictly follow the experimental setup proposed in [10], using only the training and validation sets for learning our models. In each training image, we randomly extract 800 patches of 115x115 pixels. We also perform a data augmentation strategy by flipping each patch, having in total 1600 patches per training image. These patches are then resized to 72x72 to feed our networks. We generate the ground truth object density maps with the code provided in [10], which places a Gaussian Kernel (with a covariance matrix of Σ = 15 · 12x2 ) in the center of each annotated object. For the CCNN model, we perform a cross-validation to adjust the standard deviation values of the Gaussian noise that is necessary to initialize the weights of each layer of the deep network. The Xavier initialization method [25] was used to, but with it, our CCNN models are not able to converge in our experiments. To train the Hydra CNN, we follow the same patch extraction procedure as for the CCNN model. The only difference is that from each patch we build its corresponding pyramid of s different scales, being s the number of heads of our Hydra CNN. Therefore, the first level of the pyramid contains the original patch. For the rest of levels we build centered and scaled crops, of size 1/s, of the original patch. For example, in the case of a Hydra CNN with two heads, the first level of the pyramid corresponds to the original input patch, and the second level contains a crop of size 50% of the original size. When three heads are used, the second and third levels of the pyramid contain a crop of size 66% and 33% of the original size, respectively. To initialize the heads of the Hydra CNN model, we use the same parameters discovered by the cross-validation for the CCNN. Then we perform a crossvalidation to adjust the standard deviation for the layers Fc6 and Fc7. The test is performed by densely scanning the input image with a stride of 10 pixels, and assembling all the patches as it is described in Section 3.2. The TRANCOS benchmark comes with an evaluation metric to be used: the Grid Average Mean absolute Error (GAME) [10]. This GAME is computed as follows, N 4L 1 X X l GAM E(L) = ( DIn − DIl ngt ) , N n=1
(6)
l=1
where N is the total number of images, DIl n corresponds to the estimated object density map count for the image n and region l, and DIl ng t is the corresponding ground truth density map. For a specific level L, the GAME(L) subdivides the image using a grid of 4L non-overlapping regions, and the error is computed as the sum of the mean absolute errors in each of these subregions. This metric provides a spatial measurement of the error. Note that a GAME(0) is equivalent to the mean absolute error (MAE) metric.
Towards perspective-free object counting with deep learning 30 25 MAE
20
9
CCNN Hydra s3
15 10 5 0 1
2
3
4
5 6 Database division
7
8
9
10
Fig. 4. Comparison of CCNN and Hydra CNN in the TRANCOS dataset when the number of objects increases.
Vehicle counting results Table 1 shows a detailed comparison of our models with the state-of-the-art methods [5, 6] reported in [10].
Method GAME 0 GAME 1 GAME 2 GAME 3 [5] 17.77 20.14 23.65 25.99 [6] 13.76 16.72 20.72 24.36 CCNN 12.49 16.58 20.02 22.41 Hydra 2s 11.41 16.36 20.89 23.67 Hydra 3s 10.99 13.75 16.69 19.32 Hydra 4s 12.92 15.54 18.45 20.96
Table 1. TRANCOS dataset. Comparison with the of state-of-the-art models.
First, note how all our models outperform the state-the-art. The more simple architecture of CCNN already improves the results of the previously reported models [5, 6]. Hydra CNN should be able to report the best results in TRANCOS, given the high level of variability in terms of perspective and variety of scenes that the images of this dataset exhibits. Table 1 shows that a Hydra CNN with just 2 scales improves the results with respect to the CCNN for a GAME(0), while for GAME(1) to GAME(3) the performance is very similar. If we go further, and train a Hydra CNN with 3 heads, we are now able to report the best results for this dataset for all the GAMES. Note how the error for the higher levels of the GAME, where this metric is more restrictive, drastically decreases. This reveals that the Hydra CNN is more precise not only predicting the object density maps, but also localizing the densities within them. If we continue increasing the number of heads of Hydra CNN, this does not guarantee an increment of the performance. On the contrary, we have experimentally observed that the model saturates for 4 heads (see last row of Table 1), while the complexity dramatically increases. Overall, these results lead us to two conclusions. First, the object density maps can be accurately and efficiently estimated using the CCNN model, which works remarkably well. Second, the Hydra CNN idea of having a pyramid of
Daniel O˜ noro-Rubio and Roberto J. L´ opez-Sastre 27.4
75.2
31.6
70.1
92.5
28.2
73.8
30.0
20.3
29.3
PREDICTION
GROUND TRUTH
10
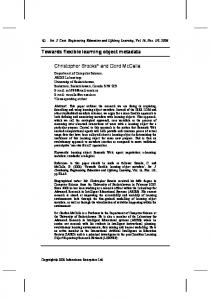
Fig. 5. Qualitative results of our Hydra model in the TRANCOS dataset. The first row corresponds to the target image with the ground truth. The second row shows the predicted object density maps. We show the total object count above each image.
scales as input, to learn a non-linear regression model for the prediction of object density maps, seems to be more accurate, defining the novel state-of-the-art in this benchmark. Figure 4 shows an additional analysis of our models using the MAE (GAME(0)). We perform the comparison sorting all the test images by the number of annotated vehicles they contain. We divide them in 10 subsets, and plot in this figure the MAE of our CCNN and Hydra CNN 3s models. Interestingly, CCNN reports a slightly lower error for the subsets of images with less objects. But its error quickly rises when more vehicles appear in the scene. The Hydra CNN model is clearly the winner, reporting a very stable error along the different subsets. Finally, Figure 5 shows some of the qualitative results obtained. The first three images present the results where our Hydra 3s model obtains a good performance, and the last two images correspond to those for which we get the maximum error. In the supplementary material, we provide more qualitative results produced by our models. 4.2
UCSD dataset
Experimental setup Here we evaluate our models in the crowd counting problem. For doing so, we use the popular UCSD pedestrian benchmark [4]. It is a 2000-frames video dataset from a surveillance camera of a single scene. The images have been annotated with a dot on each pedestrian. It also includes a ROI and the perspective map of the scene. In our experiments, we report results when our models use and not use this perspective map. The evaluation metric proposed in [4] is the MAE. We follow exactly the same experimental setup that is used in [5, 6, 26, 7]. Hence, we split the data into four different subsets: 1) “maximal”: train with frames 600:5:1400; 2) “downscale”: train with frames 1205:5:1600; 3) “upscale”: train with frames 805:5:1100; 4) “minimal”: train with frames 640:80:1360. All the frames out of the defined training ranges are used for testing.
Towards perspective-free object counting with deep learning 14.4
17.9
33.6
44.6
20.6
15.4
17.9
36.6
47.0
PREDICTION
GROUND TRUTH
21.5
11
Fig. 6. CCNN qualitative results for the UCSD dataset. The first row shows the target image with its ground truth. The second row shows the predicted object density map. We show the total object count above each image.
In order to train our CCNN model, for each image we collect 800 patches, of 72x72 pixels, randomly extracted all over the image, and their corresponding ground truth density maps. We perform a data augmentation by flipping each patch. Therefore, in total, we have 1600 training samples per image. As usual, when the perspective map is used, the ground truth object density maps are built scaling the covariance of the 2D Gaussian kernels, where we fix a base Σ = 8 · 12x2 , as it is described in [6]. To train the Hydra CNN models, we follow the same patch extraction detailed for the TRANCOS dataset. This time, 800 random patches of 72x72 pixels are extracted per training image. The pyramid of scaled versions of the patches is built using the same procedure explained before. We initialize both the CCNN and the Hydra CNN models following the procedures previously explained for the TRANCOS dataset. Finally, to perform the test we fix a stride of 10 pixels and then we proceed as it is described in Section 3.2. Crowd counting results We start analyzing the performance of the CCNN model. Table 2 shows a comparison with all the state-of-the-art methods. Our CCNN, trained using the perspective map provided, like all the competing approaches, obtains the best results for the “upscale” subset. If we compare the performance of the two deep learning models, i.e. CCNN vs. the Crowd CNN of Zhang et al. [7], our model gets a better performance in 3 of the 4 subsets. Figure 6 shows some qualitative results. We have chosen five frames that best represent the object density differences in the dataset. The last two frames correspond with the maximal error produced by our CCNN model. In the supplementary material, we provide videos with all the qualitative results. We now proceed to analyze the results obtained by the Hydra CNN models in this benchmark. Even though this dataset offers images of a fixed scene, providing its perspective map, where the objects appear at similar scales, we have decided to conduct this extra experiment with the Hydra CNN approach,
12
Daniel O˜ noro-Rubio and Roberto J. L´ opez-Sastre Method ‘maximal’ ‘downscale’ ‘upscale’ ‘minimal’ [6] 1.70 1.28 1.59 2.02 [5] 1.70 2.16 1.61 2.20 [20] 1.43 1.30 1.59 1.62 [3] 1.24 1.31 1.69 1.49 [7] 1.70 1.26 1.59 1.52 Our CCNN 1.65 1.79 1.11 1.50
Table 2. Mean absolute error. Comparison with the state-of-the-art methods for the UCSD pedestrian dataset. Method ‘maximal’ ‘downscale’ ‘upscale’ ‘minimal’ Hydra 2s 2.22 1.93 1.37 2.38 Hydra 3s 2.17 2.99 1.44 1.92
Table 3. MAE comparison of our Hydra 2s and Hydra 3s models trained without perspective information in the UCSD dataset.
to evaluate its performance with the state-of-the-art models. Table 3 shows the MAE results for our Hydra with two and three heads. Recall that we do not use the perspective information. We can observe two things. The first one is that both architectures report a good performance, even if they do not improve the stateof-the-art. To support this conclusion, Figure 7 shows a comparison between the ground truth, the CCNN model (trained using the perspective map), and the estimation generated by our Hydra with two and three heads, which does not use the perspective information. Hydra CNN models are able to closely follow both the CCNN and the GT. We belive that Hydra CNN does not outperform CCNN due to the small variability and the low perspective distortion exhibited by this dataset. In this situation, adding more scales does not seem to provide really useful information. Hence, the use of Hydra CNN does not offer here a clear advantage. 4.3
UCF CC 50 dataset
Experimental setup The UCF CC 50 dataset [9] consists of 50 pictures, collected from publicly available web images. The counts of persons range between 94 and 4543, with an average of 1280 individuals per image. People have been annotated by dots, and no perspective maps are provided. The images contain very crowded scenes, which belong to diverse set of events: concerts, protests, stadiums, marathons, and pilgrimages. This dataset proposes a challenging problem, especially due to the reduced number of training images, and the variability between the scenarios covered. We have followed the same experimental setup described in [9]. We randomly split the dataset into 5 subsets and perform a 5-fold cross-validation. To report the results the MAE and the Mean Standard Deviation (MSD) are used. For training our models, we scale the images in order to make the largest size equal to 800 pixels. We follow the same experimental setup described in Section 4.1. We now randomly extract 1200 image patches of 150x150 pixels
Towards perspective-free object counting with deep learning Ground Truth CCNN Prediction 50 50 30 45 45 40 25 35 40 30 20 35 25 20 15 30 15 100 100 200 300 400 500 600 700250 50 100 150 200 250 300 350100 maximal downscale
13
Hydra 2s Prediction Hydra 3s Prediction
50
45 40 35 30 25 20 15 100 150 200 250100 100200 300400 500600 700800 upscale minimal
Fig. 7. Comparison of ground truth, CCNN and Hydra CNN of two and three heads in the UCSD benchmark.
with their corresponding ground truth. We also augment the training data by flipping each sample. Finally, the covariance matrix for the ground truth density map generation with the Gaussian functions is fixed to Σ = 15 · 12x2 . For the initialization of the CCNN and the Hydra CNN models, we follow the crossvalidation procedure already described for the other datasets. To do the test, we densely scan the image with a stride of 10 pixels. Crowd counting results Table 4 shows a comparison of our models with the state-of-the-art approaches. In this dataset, the best performance is given by our Hydra CNN 2s, which is able to drastically reduce the MAE. Hydra CNN with 3 scales outperforms 3 of 5 models previously published. The CCNN approach only improves the results reported in [19, 6]. Analyzing the results, we find that the performance of the CCNN decreases especially in those images with the highest number of humans and where the perspective really matters. In Figure 9 we include some qualitative examples of the CCNN model where this can be appreciated. This issue and the results provided, confirm the advantages of the scale-aware Hydra model for the very crowded scenes of the UCF CC 50 dataset. Figure 8 shows some of the qualitative results that are obtained by our Hydra CNN model with two heads. The first three columns correspond with results where our network reports a good performance, while the last two columns show the maximum errors.
5
Conclusions
In this paper, we have introduced two novel deep learning approaches to count objects in images. To the best of our knowledge, only two methods have previously explored similar ideas [7, 21]. Therefore, our research affords novel insights into the problem of object counting with deep learning. With our first architecture, the CCNN model, we show that object density maps can be accurately and efficiently estimated, letting the network learn the mapping which transforms the appearance of image patches into object density maps. We are able to match and improve the counting accuracy of much more
Daniel O˜ noro-Rubio and Roberto J. L´ opez-Sastre 1116.0
163.8
3407.0
441.9
2106.3
1196.5
381.2
3008.9
1331.6
1334.1
PREDICTION
GROUND TRUTH
14
Fig. 8. UCF CC 50 dataset qualitative results for Hydra CNN with two scales. First row corresponds to the target image with the GT. Second row shows the predicted object density maps. We show the total object count above each image. GROUND TRUTH
Table 4. MAE and MSD comparison for the UCF CC 50 dataset. Method [19] [6] [7] [9] [21] CCNN Hydra 2s Hydra 3s
MAE 655.7 493.4 467.0 419.5 377.6 488.67 333.73 465.73
MSD 697.8 487.1 498.5 541.6 509.1 646.68 425.26 371.84
2549.3
917.8
730.4
PREDICTION
1651.4
1920.7
783.4
Fig. 9. Qualitative results of the CCNN in the UCF CC 50 dataset.
complex models, such as [7], where multiple loss functions and extra regressors are used in conjunction with the deep model. Our second model, Hydra CNN, goes one step further, and provides a scaleaware solution, which is designed to learn a non-linear regressor to generate the object density maps from a pyramid of image patches at multiple scales. The experimental validation reveals that Hydra not only improves the results of its predecessor, our CCNN, but also that it is able to improve the state-of-the-art of those benchmarks that propose to count object in different scenes, showing very crowded situations, and where no geometric information for the scene, like its perspective map, is provided. By making our software and pre-trained models available 1 , we make it effortless for future researches to reproduce our results and to facilitate further progress towards more accurate solutions for this challenging task. Acknowledgements. This work is supported by the projects of the DGT with references SPIP2014-1468 and SPIP2015-01809, and the project of the MINECO TEC2013-45183-R. 1
https://github.com/gramuah/ccnn
Towards perspective-free object counting with deep learning
15
References 1. Dalal, N., Triggs, B.: Histograms of oriented gradients for human detection. In: CVPR. (2005) 2. Felzenszwalb, P.F., Girshick, R.B., McAllester, D., Ramanan, D.: Object detection with discriminatively trained part-based models. IEEE Trans. Pattern Anal. Mach. Intell. (2010) 3. Arteta, C., Lempitsky, V., Noble, J.A., Zisserman, A.: Interactive object counting. In: ECCV. (2014) 4. Chan, A.B., Liang, Z.S.J., Vasconcelos, N.: Privacy preserving crowd monitoring: Counting people without people models or tracking. In: CVPR. (2008) 5. Fiaschi, L., Kthe, U., Nair, R., Hamprecht, F.A.: Learning to count with regression forest and structured labels. In: ICPR. (2012) 6. Lempitsky, V., Zisserman, A.: Learning to count objects in images. In: NIPS. (2010) 7. Zhang, C., Li, H., Wang, X., Yang, X.: Cross-scene crowd counting via deep convolutional neural networks. In: CVPR. (June 2015) 8. Loy, C., Chen, K., Gong, S., Xiang, T.: Crowd counting and profiling: Methodology and evaluation. In: Modeling, Simulation and Visual Analysis of Crowds. (2013) 9. Idrees, H., Saleemi, I., Seibert, C., Shah, M.: Multi-source multi-scale counting in extremely dense crowd images. In: CVPR. (2013) 10. Guerrero-G´ omez-Olmedo, R., Torre-Jim´enez, B., L´ opez-Sastre, R., MaldonadoBasc´ on, S., O˜ noro Rubio, D.: Extremely overlapping vehicle counting. In: Iberian Conference on Pattern Recognition and Image Analysis (IbPRIA). (2015) 11. Chen, S., Fern, A., Todorovic, S.: Person count localization in videos from noisy foreground and detections. In: CVPR. (2015) 12. Leibe, B., Seemann, E., Schiele, B.: Pedestrian detection in crowded scenes. In: CVPR. (2005) 13. Li, M., Zhang, Z., Huang, K., Tan, T.: Estimating the number of people in crowded scenes by mid based foreground segmentation and head-shoulder detection. In: ICPR. (2008) 14. Patzold, M., Evangelio, R.H., Sikora, T.: Counting people in crowded environments by fusion of shape and motion information. In: AVSS. (2010) 15. Viola, P., Jones, M.J.: Robust real-time face detection. International Journal of Computer Vision (2004) 16. Wang, M., Wang, X.: Automatic adaptation of a generic pedestrian detector to a specific traffic scene. In: CVPR. (2011) 17. Rabaud, V., Belongie, S.: Counting crowded moving objects. In: CVPR. (2006) 18. Tu, P.H., Sebastian, T., Doretto, G., Krahnstoever, N., Rittscher, J., Yu, T.: Unified crowd segmentation. In: ECCV. (2008) 19. Rodriguez, M., Laptev, I., Sivic, J., Audibert, J.Y.: Density-aware person detection and tracking in crowds. In: ICCV. (2011) 20. Pham, V.Q., Kozakaya, T., Yamaguchi, O., Okada, R.: COUNT forest: CO-voting uncertain number of targets using random forest for crowd density estimation. In: ICCV. (2015) 21. Zhang, Y., Zhou, D., Chen, S., Gao, S., Ma, Y.: Single-image crowd counting via multi-column convolutional neural network. In: CVPR. (June 2016) 22. Long, J., Shelhamer, E., Darrell, T.: Fully convolutional networks for semantic segmentation. In: CVPR. (2014)
16
Daniel O˜ noro-Rubio and Roberto J. L´ opez-Sastre
23. Jia, Y., Shelhamer, E., Donahue, J., Karayev, S., Long, J., Girshick, R., Guadarrama, S., Darrell, T.: Caffe: Convolutional architecture for fast feature embedding. arXiv preprint arXiv:1408.5093 (2014) 24. Li, G., Yu, Y.: Visual saliency based on multiscale deep features. In: CVPR. (2015) 25. Glorot, X., Bengio, Y.: Understanding the difficulty of training deep feedforward neural networks. In: AISTATS. (2010) 26. Ryan, D., Denman, S., Fookes, C., Sridharan, S.: Crowd counting using multiple local features. In: DICTA. (2009)