Abstractâ Faults in WSN are very common and appear in different levels of the system. For pervasive applications to be adopted by end-users there is a need ...
Towards Self-healing in Wireless Sensor Networks
Themistoklis Bourdenas, Morris Sloman Department of Computing Imperial College London, UK {tbourden, m.sloman}@doc.ic.ac.uk Abstract— Faults in WSN are very common and appear in different levels of the system. For pervasive applications to be adopted by end-users there is a need for autonomic selfhealing. This paper discusses our initial approach to selfhealing in WSN and describes experiments with two case studies of body sensor deployment. We evaluate the impact of sensor faults on activity and gesture classification accuracy respectively and develop mechanisms that will allow detection of those faults during system’s operation.
In the next section, we discuss the properties of a selfhealing framework for WSNs. Section 3 presents the context of two case studies on a body sensor network for activity and gesture recognition and defines our fault models. In section 4 we elaborate on the employed fault detection methods, while section 5 evaluates their effectiveness. In section 6 we discuss related work and we conclude in section 7.
Keywords- self-healing; feature-correlation, fault-detection
A. Architecture We can identify three layers in a typical WSN application in which fault management must be considered: the sensing layer, where data are collected from the devices, the analysis layer, where decisions are extracted from data and finally the dissemination layer, where information is provided to application built on top of the network. A selfhealing framework should provide the infrastructure and the fundamental patterns or constructs, which enable application developers to compose a service capable of handling and adapting to faults by using a set of rules or a high-level language, to define the behavior of their network. Defining a specific software architecture for such a service would not be feasible given the vast number of application scenarios of WSN and their radical differences in requirements. Instead, we initially define the required functional roles of such a framework. Based on the functional architecture and a concrete application scenario, we can define the structural architecture of the application, delegating the deployment points of roles we define here. Fig 1. illustrates the proposed architecture defining roles for the above three layers of a sensor network. Extensions to the core sensing functionality support the self-healing and the arrows represent the flow of information in the system. Fault detection schemes reside at the sensing layer of the network to detect inconsistencies in readings based on a model and accordingly trigger masking or correction processes specific to the affected sensors. In the analysis layer, cross validation models based on domain knowledge can be used to evaluate the validity of the decision outcome. Finally, in the dissemination layer, node management involves allocation of nodes in operational groups and formation of network structures with redundancy for routing of messages. In this paper, we focus on techniques that fit on
I.
INTRODUCTION
Wireless Sensor Networks (WSNs) are starting to be used for pervasive computing applications such as healthcare, environmental monitoring, building management and monitoring large machinery. However, the accuracy of readings from sensitive electronic sensors often deteriorates over time due to natural effects such as overheating, sensor surface chemical fouling or low battery power. Frequent replacement of sensors is often not practical due to cost or inaccessibility of the sensors. Faults appear in different levels of a WSN – sensing devices, wireless nodes or the network. Manual management even for small-scale body sensor networks is not pragmatic, considering they are intended to integrate in the daily routine of users with no technical skills. Autonomic self-healing involves detection of faulty devices and reaction by means of masking or isolating the faults, where possible making use of redundancy. While faults in most distributed systems are not very common, they occur more regularly in WSNs so a holistic approach to selfhealing that can compensate for faults at various levels is needed. This paper proposes a self-healing framework, which enables a flexible choice of components for detection and masking of faults as well as reconfiguration of the network. We focus on activity recognition with sensor information fusion to determine patterns of fault management. We model and study the impact of errors such as those arising from noise or drift in sensor readings. Information fusion involves sensors that do not monitor exactly the same attributes of a phenomenon. Therefore, they cannot be compared directly but as these attributes are highly correlated, meaningful information can be inferred.
II.
SELF-HEALING WSN FRAMEWORK
the lower, sensing layer, and more specifically on the fault detection mechanisms.
Figure 1. Functional roles of a self-healing WSN framework
B. Fault Classes We give a simple taxonomy of the faults we consider on the sensing devices. We define four classes of faults namely – short, noise, const and accumulative faults, extending the terminology used in [1]. Short faults are a momentary irregularity in the readings of a sensor, i.e. random spikes in the trace. Noise is a prolonged increased variance in the readings of a sensor. Const fault is an invariant repetition of an arbitrary value that is uncorrelated to the observed phenomenon. Finally, accumulative fault is a typically smooth, consistent deviation of the observed value from the ground truth, i.e. the sensor exhibits drift. III.
ACTIVITY CLASSIFICATION
We use two case studies, where we examine the effects of sensor faults in the classification accuracy of the networks. The first network employs three accelerometer sensors to determine user activity, while the second one includes 19 accelerometers and one fiber optic sensor for evaluating a surgeon’s skill through gesture recognition [2]. The traces of both the case studies were provided by the Institute of Biomedical Engineering, Imperial College London. A. Traces from Case Studies The activity recognition trace is collected using the eAR sensor, a BSN node [3] attached to the subject’s ear, communicating collected data to a nearby data-logger. It consists of three uni-modal sensors that monitor different
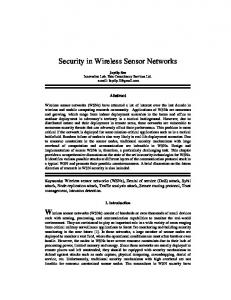
perspectives, i.e. acceleration in three axes. The experiment involves trace from twelve different subjects performing predefined activities in the following order: sitting, reading, eating, standing, tilting her head, walking, sitting, slouching and lying on a sofa. Each activity is performed for a few tens of seconds up to a minute. As such, the original trace did not exhibit significant amount of faults, caused by aging of sensors. Thus, we assume that readings are very close to the ground truth. In [4], where the trace was originally used, the authors proposed a Bayesian network mixture model approach for their classification method. Further analysis of the trace is presented in [5, 6] where the authors also use ambient sensors that collect image blobs for profiling of behavior. Rerun of the experiments yielded 70% overall classification accuracy for the six subjects. The second experiment uses a glove that has 19 attached accelerometer sensors on the fingers and the back of the hand and an optical sensor across the palm that measures bending of the hand. The surgeon performs five activities sequentially operating a tool tip; left/right traverse, open/close, up/down traverse, rotating the roticulator and rotating the tool tip anticlockwise. The 20 sensors are attached to four different nodes that communicate wirelessly to a sink node that collects the data, with 3-6 sensors attached to each node. More specifically, BSN1 node contains two 3D acceleration sensors on the tip of the thumb and index fingers. BSN2 contains two 2D acceleration sensors on the lower part of the index and middle finger, as well as the optical bend sensor. BSN3 has only a 3D accelerometer attached at the back of the hand. Finally, BSN4 controls two 3D acceleration sensors on tips of the middle and ring fingers. Five different subjects perform the activities in the trace, for the duration of a few seconds. B. Classification Method For the classification of the activities, we have used a simple k Nearest Neighbors (k-NN) algorithm. In k-NN a data-point’s distance in space is compared to a set of previously classified samples and the class that has the most appearances in the k closest samples to it is assigned to the instance. We use a vector of extracted features from a rolling mean of window size 50 for each signal. The k parameter was set to 5 and we use the Euclidean distance in our vector space. The choice of representative population for the training of the classification, i.e. the specific sample with which a new instance is compared, affects accuracy. Performing exhaustive distance comparison of the whole training set is very computationally intensive so we clustered the data-points and selected a representative, i.e. the mean value, from each cluster and found that a cluster of 25 gives a good balance between efficiency and accuracy. For each sensor, we use the rolling mean values of the raw data. Fig. 2 illustrates how the accuracy in classification is increased by using information from more sensors. The addition of sensors while their number is small appears to
increase significantly the results, however as it is demonstrated by the glove case study the accuracy increase becomes asymptotic after a certain number of sensors.
D. Fault Impact We study the impact of each fault class by injecting the faults in random signals of the eAR and glove traces. For every BSN node we inject fault into 1/3 of the signals. For the eAR sensor as well as BSN3, that translates to one axis of the accelerometer. For the other sensors it means that two of their signals are corrupted by some form of faults. Accuracy decline in overall classification is illustrated in Fig. 3. For the glove experiment, we present impact both on each node individually and when combining all inputs from the nodes. Where classification should be implemented is a tradeoff between data transmission and computation. In essence, whether classification takes place on the nodes without any raw data transmission or in the base station, which collects all the readings from the nodes.
Figure 2. Classification accuracy improvement as number of sensors increases
We studied the impact of different types of faults, on both the k-NN and the Bayesian classification technique, which was originally used. The accuracy degradation exhibit similar trends so we focused on the k-NN approach for two main reasons. k-NN is less computationally demanding so is more suited to resource-constrained devices used in WSNs. Moreover, using the Bayesian mixture model we need to retrain a new network when a feature is dropped from the classification process, whereas in k-NN we can just omit the missing feature from the distance metric calculation. We need to stress that the classification method is not a contribution of this paper, but merely a tool for our analysis. C. Fault Modeling In order to evaluate the impact of faults in the original experiments we injected faults in the trace for each of the fault classes identified in section 2.2. There are pros and cons associated with this approach. We have to create carefully the fault models to resemble real world faults, but artificially injected faults give a definite distinction between erroneous and normal behavior, enabling evaluation of the detection accuracy of our mechanisms. As a result, we are more confident on the results of the fault detection techniques. A description of our fault models follows. Short faults are inserted in the trace at a random percentage, p, of data-points by multiplying the existing reading by [+/-]c which is the fault intensity parameter. For adding noise in a region of the trace, we use a Gaussian distribution with a mean of the original feature values and set the standard deviation as parameter σ. Const fault is simply modeled by setting the value of a region to a specific value v. Accumulative error is injected by multiplying the original value by f(t), where t is the time and f is a function that monotonically increases or decreases with time and indicates the rate of drift.
Figure 3. Classification accuracy degradation for a) short, b) noise and c) accumulative faults
For short faults, the impact on the accuracy is minimal, especially when we consider all 20 inputs in the glove experiment, where there is almost no degradation. For the short class we have set the occurrence of faults to 5% while the intensity of the fault varies from 10-40%. Noise has greater impact on the individual nodes, but again in the case where we consider all inputs of the glove trace the decline is small. Ample redundancy of inputs seems to compensate for inaccurate data, even though input measures different attributes. It is also worth noting that the eAR node and BSN3 are affected in a very similar manner though they are used in completely different setups. This is apparently attributed to the fact that they are both equipped with only three sensors and are more sensitive to the loss of 1/3 of their input compared to the rest nodes. Accumulative faults on the other hand present a more severe impact on the classification process. Even when considering all the glove inputs we drop to 70% successful classification from the original 90%. Another interesting finding is that the eAR trace has significantly lower tolerance to this class of faults, compared to individual nodes of the glove trace. This illustrates that the impact of faults depends on the monitored phenomenon, in addition to the type of sensor, in which case are identical for both case studies. IV.
FAULT DETECTION
Results demonstrate how the classification accuracy is affected by faulty signals in the trace. Comparing to the accuracy findings in Fig. 2, we can see that in most cases we gain by removing a faulty signal instead of letting it confuse the classification process. Consequently, we investigated fault detection methods to identify faults during the system operation and provide the input for triggering reconfiguration of the network. A. Detection Techniques Short faults manifest themselves as an irrelevant sharp increase or decrease of the sensor’s value compared to its given history. If we consider the sensor’s recent input history as a Gaussian distribution, the values within three times the standard deviation distance from the mean value account for the 99.7% of the points. We regard a short fault as a data-point whose value exceeds that limit. Const faults are trivially identified as multiple readings with the same value i.e. a variance of zero, which would be unusual behavior for an accelerometer. Other sensors with a more static behavior of reading e.g. temperature would require methods of neighborhood correlation similar to those employed for noise and accumulative faults. For noise error, increased variance in the trace does not work as activity changes inherently result in large variance, although this may be suitable for other types of sensors such as thermometers. We use a voting scheme between the sensors to distinguish between a faulty region and activity change variance. If a minority of the associated signals indicates large variance, this is likely to be due to faults.
Even though sensors monitor different attributes of a phenomenon, these attributes are interlinked allowing us to exploit this information for checking the state of the sensing devices. However, attempting to set a static threshold does not generalize as a pattern for detection in different scenarios. Attempts to apply an online learning algorithm for an adaptive threshold did not provide fruitful results, yielding many false positives. In the case of accumulative faults, i.e. drift, the variance feature does not provide enough information for identification, in contrast to the other classes of faults. Instead, we study the trend line that the readings’ history forms using regression methods. By calculating the trend of the data, we can exploit domain knowledge to evaluate their validity. In the accelerometer case, the trend of readings resembles a line parallel to the x-axis, while sharp changes appear in all axes during activity changes. A voting scheme is again being used to distinguish between normal behavior and faulty regions. B. Correlation as Fault Detector The methods described above for noise and accumulative faults require specific knowledge of the domain in order to set effective threshold of high variance or expected line slopes. Experimenting with online learning and extracting threshold from neighbors, indicated that they did not apply in our scenarios, each for a different reason. A self-adapting threshold from history of readings does not work with accelerometer readings with activity changes, which inherently changes the sensors’ output and hence modifies features. In the scenarios where state changes are frequent, online knowledge is outdated very quickly and misleads the system. A threshold that is extracted at a given time is usually only be appropriate to the current activity and as soon as the activity changes, it yields false alarms of sensor misbehavior. Instead, we use the correlation feature between two random variables, in our case the pairs of sensor signals, as a metric for fault detection. The correlation between two random variables X and Y is defined as:
(1) E(X) in (1) is the mean value of the random variable X. Correlation is bound between the values -1 to 1. The closer the absolute value of correlation is to 1 the more correlated the random variables are, where negative sign refers to negative correlation. A value of 0 denotes that the variables are completely independent. We expect the signals in a BSN to have a high value of correlation. Therefore, we assume that low levels of correlation are not a normal behavior in the system and trigger an alert for faults in the sensors. The fault that is detected can fall in any of the const, noise or accumulative classes.
V.
EVALUATION
In this section, we present the evaluation of our detection techniques. The metrics we focus on are the hit-rate of detected faults where a hit indicates at least one alert is triggered when a fault occurs; the fall-out which is defined as the ratio of false positives to the sum of false positives and true negatives; and the time delay between a fault occurrence and its detection measured in samples, where on average there are 32 samples per second in the traces. The duration of an injected fault is approximately 1200 samples. Error! Reference source not found. summarizes our findings for detection of short, noise and accumulative faults. We omit evaluation for the const fault technique. As we have discussed earlier, their detection in our case studies is trivial. TABLE 1. DETECTION M ETHODS E VALUATION
short
hit-rate 99.54%
fall-out 0.77%
delay 0.00
noise (v)
98.33%
7.43%
8.41
noise (c)
100%
6.32%
143.53
accum (r)
95.22%
19.47%
197.99
accum (c)
78.22%
3.89%
346.31
The model of the short fault proves to be very accurate, yielding very low false positives. The delay attribute is not relevant for short faults as they are instantaneous. In Table 1 we compare the variance (v) and regression (r) with the correlation (c) techniques for noise and accumulative faults respectively. Both noise detection techniques are very accurate on detecting actual, noise. However, the variance method gives slightly increased number false positives, compared to the correlation technique. On the other hand, noisy areas are detected quicker. The increased delay is attributed to the larger history of samples used for the correlation method. Consequently, the feature adapts slower to new behaviors. The history size is a tradeoff between detection delay and the number of false positives. We used a history of 200 samples in the experiments. The regression technique for accumulative faults has a higher hit-rate comparing to correlation, but at the cost of a high fall-out. As expected, closer examination of the results indicated that the drift cases that escaped detection from correlation are those that have a very smooth deviation from ground truth. The higher detection delay of the accumulative errors is tolerable in the drift case, as the effects at the beginning of its appearance are marginal. Regression analysis for detecting the trend of the input is a very computationally intensive process. An alternative is a very rough estimation by calculating the slope of the line passing over two data-points. This approach yielded slightly degraded results compared to regression, but still comparable, considering the computation gain.
The greater benefit from using the correlation technique for detection is that it is a more generic method compared to variance and regression that require specification of customtailored thresholds per deployment. Furthermore, the correlation technique is more resilient when more than one class of faults is present. VI.
RELATED WORK
In the bibliography, fault management in WSNs has been studied in several frameworks. They tend to be centralized, collecting information and metrics of a network to the sink, where they are processed for fault detection. Sympathy’s [7] focus is towards a tool to assist detection of failures by collecting metrics from the network. Faults are modeled as low traffic from nodes compared to what is expected. Other node and network specific metrics are used, as well, to determine their state or the flow of data. WinMS [8] has a similar focus, give a global state to a central authority by collecting information from nodes around the network. It uses a protocol that piggybacks metrics to frequently exchanged messages among nodes. Policies running at the base station are checked against collected data in order to reconfigure the system. MANNA [9] has a different focus compared to the previous architectures, trying to bring self-management to WSN. It defines three abstract roles in the system; the agents and managers in addition to the sensing nodes, which correspond to cluster-heads and base stations. Our approach also models sensing device failures. Furthermore, we try to push detection and decision making inside the network. Examples from the bibliography where sensor faults are detected by neighboring nodes can be found in [10-12], where the nodes try automatically to detect deviations from what is observed from the majority of the neighborhood. These approaches assume that sensors in the local neighborhood monitor the same attribute of a phenomenon. However, this is not the case in our traces, where we collect data for different attributes. VII. CONCLUSION In this paper, we present an overview of our approach towards self-healing in WSNs and our initial steps for building mechanisms that can automatically detect faults in two body area applications. We demonstrate that correlation is a feature that can be used successfully to detect inconsistencies in sensor inputs and provides low false positives. Future work will investigate traces from scenarios that involve sensors of different modalities and nodes forming distributed topologies. Furthermore, we are going to investigate elements in the analysis and dissemination layers indicted in Fig. 1.
ACKNOWLEDGMENT This research was supported by UK EPSRC BiosensorNet (Grant EP/C547586/1) and Aedus2 (Grant EP/E025188/1) REFERENCES [1] Sharma, A., L. Golubchik, and R. Govindan. On the Prevalence of Sensor Faults in Real-World Deployments. in Proc. IEEE SECON '07, p. 213-222. [2] King, R., et al., Hand Gesture Recognition with Body Sensor Networks, in BSN '05. [3] Body Sensor Networks, ed. G.-Z. Yang. 2006, London: Springer-Verlag. [4] Pansiot, J., et al., Ambient and Wearable Sensor Fusion for Activity Recognition in Healthcare Monitoring Systems, BSN '07. [5] Atallah, L., et al. Behaviour Profiling with Ambient and Wearable Sensing. in BSN '07. 2007. Aachen, Germany. [6] McIlwraith, D.G., et al. Probabilistic Decision Level Fusion for Real-Time Correlation of Ambient and Wearable Sensors. in BSN '08. [7] Ramanathan, N., et al. Sympathy for the Sensor Network Debugger. in ACM SenSys '05, p255-267 [8] Lee, W.L., A. Datta, and R. Cardell-Oliver, WinMS: Wireless Sensor Network-Management System, An Adaptive PolicyBased Management for Wireless Sensor Networks. Univ. of Western Australia, tech. rep. UWA-CSSE-06-001, 2006. http://www.csse.uwa.edu.au/~winnie/WinMS.pdf [9] Ruiz, L.B., J.M. Nogueira, and A.A.F. Loureiro, MANNA: A Management Architecture for Wireless Sensor Networks. IEEE Communications Magazine, 2003. 41(2): p. 116-125. [10] Ding, M., et al. Localized Fault-Tolerant Event Boundary Detection in Sensor Networks. Proc. IEEE INFOCOM '05, p. 905-913 [11] Chen, J., S. Kher, and A. Somani. Distributed Fault Detection of Wireless Sensor Networks. In ACM DIWANS'06, p 65-72 [12] Hsin, C. and M. Liu, Self-monitoring of wireless sensor networks. Computer Communications, 2005. 29: p. 462-47.