ABSTRACT. Problems occur regularly with intravenous therapy, especially with the flow behavior. A mechanical model can predict which components of ...
4. Fluidic control systems
Presentation
TOWARDS SYSTEM-LEVEL MODELING AND CHARACTERIZATION OF COMPONENTS FOR INTRAVENOUS THERAPY D. Alveringh1 , R.J. Wiegerink1 , and J.C. Lötters1,2 1 MESA+ Institute for Nanotechnology, University of Twente, Enschede, The Netherlands 2 Bronkhorst High-Tech BV, Ruurlo, The Netherlands ABSTRACT Problems occur regularly with intravenous therapy, especially with the flow behavior. A mechanical model can predict which components of intravenous therapy systems introduce non-ideal effects in the flow. This study concentrates on gaining quantitative information of each separate component for intravenous therapy, characterize its non-ideal effects and combine these quantities in one system-level model. The model will help in the development of a mass flow sensor which can be used in a control system for intravenous therapy. KEYWORDS intravenous therapy, flow sensor, infusion, Coriolis INTRODUCTION According to reference [1], between 2005 and 2009, the FDA (US Food and Drug Administration) received more than 56,000 reports of problems associated with infusion pumps. To find the health risks for intravenous therapy, measurements have been done in the past on infusion pumps, tubes and other components. Reference [2], for example, summarizes the main problems based on a literature study. However, to understand all non-ideal effects and predict the behavior of intravenous therapy, the entire system must be described in one model. Our study concentrates on gaining quantitative information of each separate component, characterize its nonideal effects and combine these quantities in one systemlevel model. This model is part of the development of a new micro Coriolis mass flow sensor based on reference [3], which can be used for real-time monitoring or as a calibration method for systems for intravenous therapy, leading to safer infusions.
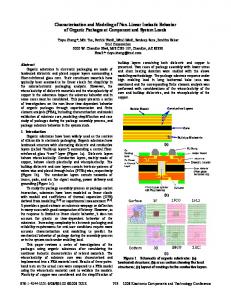
(a) Practical infusion setup. infusion pump stepper motor
belt
worm
syringe
tubes
needle
(b) Schematic overview of the components motor ωmotor
belt Nbelt
TF
worm ωbelt
syringe Nworm
TF
M⋅sin(ωt)
v
Nsyringe
TF
tube
needle
Rtube
φ
Ctube
Mworm
(c) System-level lumped elements model. Figure 1: Intravenous therapy.
Rneedle
F (t) = Rt · v(t),
(1)
T (t) = Rr · ω(t),
(2)
P(t) = Rf · φ(t).
(3)
with t the time, F the force, T the torque and P the pressure. And for equivalent capacitors (e.g. a compiant tube), the following equations hold: Z 1 v(t) dt, (4) F (t) = Ct Z 1 T (t) = ω(t) dt, (5) Cr Z 1 φ(t) dt. (6) P(t) = Cf Transformers (e.g. a syringe converts a velocity to a flow) are two-ports, and obey following equation: 1 ein (t), with e = F ∨ T ∨ P, N f out (t) = N f in (t), with f = v ∨ ω ∨ φ.
eout (t) =
(7) (8)
In Figure 1c, the major parts of an intravenous therapy system are represented using the described elements. The sine-block in Figure 1c models the shape of a bent worm, modeled by a sine wave with amplitude Mworm and frequency dependent of the angular velocity of the worm. MODEL PARAMETERS All parameters are estimated using calculations,
finite element simulations and measurements on commercially available components. Stepper motor Stepper motors rotate by actuating the rotor in steps. This allows good control of the angular velocity, but may introduce non-smooth transitions between steps. Therefore, measurements where done using a 10-bit contactless magnetic angular encoder (Avago AEAT-6600-T16) on a stepper motor (17H130HM) from an infusion pump (NE-300), using the measurement setup in Figure 2a. Oversampling of 30 times was used to increase the resolution. As shown in Figure 3, there where no significant steps or other non-ideal effects observed, which means that the stepper motor can be modeled as a straight-forward source of angular velocity.
N Z
B
magnetic angular encoder
mark camera
(a)
(b)
Figure 2: Measurement setup for the characterization of the infusion pump, with (a) contactless motor angle measurement and (b) displacement measurement. 350 300 Angle [degree]
MODEL OVERVIEW Systems for intravenous therapy consist of infusion pumps, syringes, tubes and needles. Infusion pumps consist of stepper motors, belts and worm wheels (Figure 1b). A stepper motor generates an angular velocity ωmotor . This angular velocity is transmitted via a belt (ωbelt ) to a worm, which transforms it into a velocity v of the plunger. The syringe transforms the velocity into a fluid flow φ. The mentioned components can be modeled with lumped elements (Figure 1c), where each component is modeled as an equivalent electronic resistor (R), capacitor (C) or transformer (N). This method for modeling dynamical systems is done in many applications; the modeling of micropumps [4], for example. For equivalent resistors (e.g. a small needle), the following equations hold:
250 200 150 154
100 50
152 830
0 0
500
1000
840 1500
2000
Time [s]
Figure 3: Characterization results of the stepper motor with an equivalent pumping speed of 0.49 mL h−1 at 100 Hz and 30× oversampling.
Worm Non-ideal transformation effects of the worm were found using video measurements. By recording (640×480 pixels, 15 FPS) the movement of the cart on the worm wheel, the displacement over time is measured. Figure 2b
shows schematically the measurement setup. A moving average filter (31) is applied on the data, the result and its derivative are shown in Figure 4. 10
2.5
8
2
6
1.5
4
1
2 Displacement Velocity
0.5
The measurement results for two frequently used tubes and needles are available in Table 1. The results were checked using finite element simulations for the capacitive values and Hagen-Poiseuille calculations for the resistive values. The values correspond in the same order of magnitude.
Velocity [mm/s]
Displacement [cm]
3
0
0
-2 0
10
20
30
40
50
60
Table 1: Resistance and capacitance measurements of infusion tubes and needles.
Time [s]
Figure 4: Characterization results of the worm with an equivalent pumping speed of 49 mL h−1 .
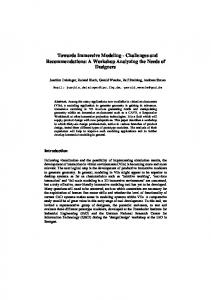
It can be concluded that the the influence of the non-ideal shape of the worm on the velocity is more than 75 %. This value is expected to be much smaller for most infusion pumps, since this measurement was done on a worn infusion pump. The measurement setup will be used to characterize the worms of different infusion pumps in the future. Tubes and needles Characterization of two types of tubes and needles is done using the setups in Figure 5. R φ
constant flow and measuring the pressure. This can be calculated by deriving the following equation from Equation 3: P(t) Rf (t) = . (10) φ
P
R C
φ
(a)
P
C
(b)
Figure 5: Measurement setup for the characterization of tubes, with (a) capacitive measurement and (b) resistance measurement.
The capacitances have been measured by filling the tubes with water, clamping one end while expanding the tubes with constant flow of water. The equivalent capacitance can be calculated from Equation 6. For constant flow, this is related to the flow, time and pressure as shown in following equations: Cf (t) = φ
t . P(t)
(9)
The resistances have been measured by pumping a
Tube 1a Tube 2b Needle 1c Needle 2d Flow sensore a b c d e
Resistance 1.3 · 1010 Pa s m−3 4.8 · 1010 Pa s m−3 3.3 · 1010 Pa s m−3 1.3 · 1012 Pa s m−3 ≈1 · 1013 Pa s m−3
Capacitance 2.3 · 10−12 m3 Pa−1 3.5 · 10−13 m3 Pa−1
Clinico Medical Sp. z o.o PVC Infusion Line (2 m). Biocath PE/PVC Extension Line (2 m). BD Microlance 3 0.8 × 25 mm needle. BD Microlance 3 0.3 × 13 mm needle. Bronkhorst L01 flow sensor, derived from datasheet.
Other parameters The resistance of the plunger is connected in series with the source of velocity, hence, this will not influence the flow. The compliance of the plunger is, according to finite element simulations, also not significant compared to the compliance of the tubes. The compliance of the belt, the inertia of the worm and the compliance of the needle are assumed not significant compared to the other resistances and compliances in the system. For the rest, the used flow meter consists of a stainless steel tube that is similar to a needle. SIMULATION The parameters used in the model of Figure 1c are printed in Table 2. The simulation software 20-sim was used to simulate the model. The set point changes from 0 mL h−1 to 1 mL h−1 and back to 0 mL h−1 , which simulates a practical medical situation. Results are shown in Figure 6. It is clear that the RC-effect and the modulation effect have a major influence on the flow.
1.2
Table 2: Values used in the model of Figure 1c.
a b c d
Value 0.5 1.3 · 10−4 m rad−1 5% 6.2 · 10−4 m2 1.3 · 1010 Pa s m−3 2.3 · 10−12 m3 Pa−1 1 · 1013 Pa s m−3
1
Description Ratio of belta Ratio of worma Worm modulationb Ratio of syringec Tube 1d Tube 1d Flow sensord
Calculated from the results in Figure 3 and Figure 4. Expected, to be specified in future work. Calculated from the section area of a syringe. From the results in table 1. 1.2
Flow [ml/hr]
1 0.8
1 0.8 0.6 0.4 0.2 0
0.6 0.4 Set Sim.
0.2 0
265
-0.2 0
50
100
150
270 200
275 250
300
Time [min]
Figure 6: Simulation results, with a clear RC-effect of tube and needle combination and the modulation effect of a non-ideal worm.
MEASUREMENTS To validate the model, measurements of the complete system were done. The setup in Figure 1b was used, where the needle is replaced by a a flow sensor. Purified water was used for the fluid flow. The results are shown in Figure 7. It can be concluded that there are differences between the model and the measurements: the frequency of the modulation of the worm is higher in the simulation. Besides, the RC-time is lower. Latter may be because of the connection tubes between flow sensor and setup. Nevertheless, the model supports the major non-ideal effects. CONCLUSION The first system-level model for intravenous therapy systems is realized. A stepper motor and worm of an infusion pump as well as two different tubes and needles
Flow [ml/hr]
Parameter Nbelt Nworm Mworm Nsyringe Rtube Ctube Rneedle
0.8
1 0.8 0.6 0.4 0.2 0
0.6 0.4 Set Meas.
0.2 0
265
-0.2 0
50
100
150
270 200
275 250
300
Time [min]
Figure 7: Measurement results, also with a clear RC-effect of tube and needle combination and the modulation effect of a non-ideal worm.
are characterized and included in the simulation. The RCtime as a result of the compliance and resistance of the tube and needle and the modulation as a result of the shape of the worm have major influences on the flow. Measurements on a complete intravenous therapy system agree with these observations. Future work will focus on further characterization of different systems for intravenous therapy, improving the model and the development of a new mass flow sensor can be used in a control system for intravenous therapy. ACKNOWLEDGEMENTS The authors gratefully acknowledge support by the Eurostars Programme through the TIPICAL project (E!8264), Roland Snijder and Jarno Groenesteijn.
REFERENCES [1] T. Agres, “FDA seeking safer infusion pumps,” Pharmacy Practice News, may 4th 2010. [2] A. C. van der Eijk et al., “A literature review on flow-rate variability in neonatal iv therapy,” Pediatric Anesthesia, vol. 23, no. 1, pp. 9–21, 2013. [3] J. Haneveld et al., “Modeling, design, fabrication and characterization of a micro coriolis mass flow sensor,” Journal of Micromechanics and Microengineering, vol. 20, no. 12, p. 125001, 2010. [4] T. Bourouina et al., “Modeling micropumps with electrical equivalent networks,” Journal of Micromechanics and Microengineering, vol. 6, no. 4, p. 398, 1996.