zromii, cbse-up framus. Replay scams. Play-Break(SQ. Segmedtatbsn. Set ofstat-and fSQ's. Ca1nM1ate S tati0fin ot' _Mid-LevlFeabno_s. Coructed SEQ's.
COVER SHEET Tjondronegoro, Dian and Chen, Yi-Ping Phoebe (2006) Towards Universal and Statistical-Driven Heuristics for Automatic Classification of Sports Video Events. In Feng, Hua Min and Yang, Shiqiang and Zhuang, Yueting, Eds. Proceedings The 11th Multimedia Modeling (MMM2006), pages pp. 43-52, Beijing, China.
Accessed from http://eprints.qut.edu.au Copyright 2006 IEEE
Towards Universal and Statistical-Driven Heuristics for Automatic Classification of Sports Video Events Dian Tjondronegoro1 Yi-Ping Phoebe Chen' School of In/brn?ination Systems, Queensland University of Technology, Brisbane, A ustraliat Scho,olof In_bi-mation Technology, Deakin University, Melbolurne, Australia2 cdian(aXqut. edit. ait phoebe (d,deakin. edit.aul features that can be detected flawlesslv during training due to the absence of manual supervision. Moreoveiadding a newv feature into a particulai model will iequire re-training of the whole model. Thus, it is generally difficult to build extensible probabilistic models that allow gradual devrelopment or improvement in the feature extraction algorithms. To tackle this limitation, ouI s-tatistical-driven models care consti-ucted based on the chaaractenistics of each feature. Any addition of new feature will only result on updates of the irules that wvere associated with that feature. Another altemative for audio-visual ftision is to use manual heuristic ruLles. For example, the temporal gaps between specific features during basketball goal have a predictable pattern that can be perceived manually [6]. The main benefit of this approach is the absence of comprehensive training for each highlight and the computations are relatively less complex. However, this method usually relies on manual observations to consti-uct the detection models for different events. Even though the numbers of domains and events of interest care limited and the amount of efforts is affordable, we prilmnarily aim to reduce the subjectivity and limitation of manual decisions. These two approaches also have two major
Abstract
Researchers worldwide have been acti ely seeking for thlc most robust and power-ful solutions to detect and classify keye events (or highlights) in vanious sports domains. Most approaches have employed manual heurIistics that model the typical pattern of audio-visual featLuL-es within particular sport events To avoid manual obser\.!ation and knowledge- machine-leaming can be Used as an alternative appi-oach. To briidge the gaps betw.een these twvo alternatives, an attempt is made to intearate statistics into heuiistic models during highlight dletection in oUI investigation. The models can be desi ened with a modest amount of domain-kniowledge, -iking themn less subjective and more robust for different sports. We have also successfully used a univrersal scope of dletection anid ( standard set of featuires that can be applied for different spor-ts that include soccer, basketball alndl Atuisti-rlian football. An experiment on a large dataset of' sport videos, vith a total of ar-ound 15 hours, has dem-ionstr-ated the effectiveness and robustness of our
aIlgorithlms.
1. lintioduction Automatic content analysis is an essential requii-ement Cor constructing an effective sports video surnmarv. It has become a wvell-known theorv that the high-level semantics in spoir video can be detected based on the oCCurrelnces of specific audio and visual features which cLan be extracted automatically. To date, there are two mainl approaches to f'use audio-visual features. One alternative, called machine-learning approach, uses probabilistic models to automatically capture the unique patterns of audio v isual feature-measurements in specific (highlight) events. For example, Hidden Markov Model (1-1MM) can be trained to capture the transitions of 'still,
drawbacks, namelyv * The lack of a definitive solution for the scope of highlight detection such as where to start and finish the extraction. For example, Ekin et al [3] detect goals by examining the video-frames between the global shot that causes the goal and the global shot that shows the restart of the game. However, this template scope was not used to detect other events. On the other hand, Han et al [4] used a static temporal-segment of 30-40 sec (empirical) for soccei highlights detection. * Thie lack of a uiliveisal set of features foi detectin1g diffdrent highlights and across different sporis. Features that best describe a highlight are selected using domain knowledge. FoI instance, wlhistle in soccer is only used to detect foul and offside. while excitement and goal-area are used to identif goal attempt [1].
standing, walking. throwing, jumping-down and iuruingdowrn' states during athletic spoits events, which are detected based on color, texture and global-motion mieasurements [8]. The main benefit of using such ap-X1proaclh is; the potential robustness, thalnks to the modest usa&ge of donmain-specific knowledge which is only n,ecded to select the best featur-es set to describe each ev\ent. H-lowever, one of the most challenging r-Ctlii-ements for constructing i-eliable models is to use 1-4244-0028-7/06/$20. 00 (©2006 IEEE
43
To solve the first drawback, some approaches have claimed that highlights are mainly contained in a play scene [5, 9]. However, based on a user study, we have founid that most users need to watch the whole play and break to understand fully an event. For example, when a wxhistle is blown during a play in soccer video, we would expect that something has happened. During the break, the close-up views of the players, a replay scene, and/or the text display will confiirm whether it was a foul or o/fside. Consequentlv, it is expected that automated semantic analysis should also need to use both play and break segments to detect highlights. As for the second drawback. we aim to reduce the amount of manual choice of features set. FoI in stance. it is quite intuitive to decide that the most effective event-dependent features to describe a soccer foul are whistle, followed by referee appearance. However, based on statistical features that will be discussed in section 3. we were able to identify some additional char-acteristies of foul that could be easily missed bv manual observation such as shorter duration as compared to shoot and less excitement as compared to goal. 'T'he focus of this paper is to present a statisticaldriv,en framework for automatic highlight classification that is based on a universal scope-of-detection and a standard set of audio-visual features. The effectiveness aind robLustness of this fi-amework has been tested with a large dataset of soccer (around 7 hours), basketball (3 hours) and Australian Football (4.5 hours). At this stage, our algorithms have successfully detected and classified soccer highliglhts, including goal, shoot (goal attempt), and foiul, and detecting non-highlights. With very minor changes, the syvs;tem can also distinguish goal, behind, ,,nork, tackl-e, and non-highlight in Australian Football (.kL). and goal, free throw7v, foiul and tinmeoutt in balsketball. Soccer and basketball are chosen as the case domain since they have a world-wide audience with many dliffe-rent national leagues and international competitions. A.FL is selected as one of largest sectors in Australia's 51port and recreation industrv!, attracting more than 14 million people to watch an average of 10 hour per week lixe-broadcasted matches Moreover, there is yet any significant work presented for this domain.
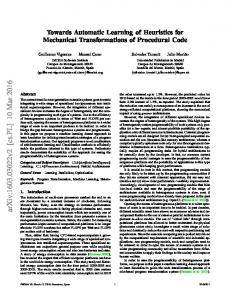
play that could end with scoiing of a goal. After a goal is scored, zoom-in -and close-up shots will be dominantly used to capture players and supporters celebration during the break. Subsequently, some slow-motion replay shots and artificial texts are usuallv inserted to add some additional contents to the goal highlight. Given that: a) the start of a play sequence is mariked by the first framiie of a long global shot (e.g. > 5 sec) and b) the start of a break sequence is marked by the first frame of a long medium shot, (slow-motion) replay shot. or zoom shot of medium length; it should be clear that play-break sequences should be effective containers for a semantic content since they contain all the requi-ed details. Moreover, most events are contained within a play-break sequence. Using this assumption, we shotuld be able to extract all the phenomenal features fi-om playvbreak that can be utilized for highlights detection. As shown in Figure 1, the scoping of event detection should be from the last play-shot until the last break shot. However, more play shots can be included for viewing, depending on how much detail on the play that users prefer, thereby reducing the subjectivity level rather than selecting particular frames. It is important to note that if the scope of play and break for detection is changed wve need to re-calculate the statistics. Benefits of using play-break to serve as a definitive scope for the start and end of features observation: * It becomes possible to use comparative measurements (e.g. break ratio) which are more robust and flexible as compared to definitive measurements such as length of break. * We can potentially design a more standard benchmarking of different highlight detection approaches. For example, we caimot literally compare two approaches. If one uses play-break segment while the other one uses play-break-play segment, or a static empirical based. * We can reduce the level of subjectivity during manual observations for ground-tirith. For example, we should not simply conclude that an aitificial text always appear after/during a goal highlight as text can be used during the break segment and/or the fiIrst play segment after the break segmlent. We should therefore take a precaution to include a text when it is too far from the highlight itself (e.g. two oI thl-ee play segments after the highlight) as it can belong to another highlight (or no highlight at all).
2. Utilizing Play-Br-eak as a Definitive and tJniver sal Detection Scope
A play is when the game is still flowing, such as when the ball is being played in soccer and basketball. A break is when the game is stopped or paused due to specific reasons, such as when a foul or a goal happens. Most broadcasted spoIt videos use transitions of typical shot types to emphasize stoiy boundaries while aiding important contents with additional items. For example a longa global shot is normally used to describe an attacking
Sequence 1
Sequence 2
Sequence 3
| PI BjBIBI B. B- |p~~~~ BfP||:A:J *-> Highlight 1
Highlight 2
Figure 1. Play-break Scoping for Highlight Detection
44
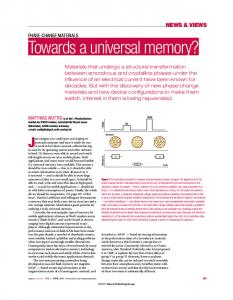
Analysis of canera-views transition in a sports video has been used successfully for play-break segmentation (suLch as in [2]). We have extended this approach by adding' replay-based corri ection to improve the per-fornmance. Replay detectioni is veiy important to locate additional breaks which are often recognized as play shots (i.e. replay shot often use global view). Replay scenes should be regarded as part of a break since they contain non real-time match contents. Based on the expenimental results which has been reported in [7], replay-based col-ection on play-bieak segmentation can fiN\ a lairge number of imperfect sequences due to shorter breaks, locate missing sequences due to missed breaks, and av!oid false sequences due to falsely detected play which is followed byr a bireak. Figure 2 illustrates the main processing required for OLr semantic analvsis scheme. First, play-break sequences are segmiented using the outputs from view classification and replay detection. Second, in order to classify the highlight contained in each sequence, statistics of the mid-level features are calculated and compared to the trained statistics using specific heuristic irules. Finally, for each (classified) highlight, some text-altemative aimuiotation can be extracted to construct the summairy. It should be noted that dashed boxes represent processes that ai-e only used during training. In particular, dominant-hue index training is usually required for new video while training of statistics is required for new highlights.
Do-Hue Indecx Tr,li
V"tiotrofDarniut-hlz "xes view-class ificuadio I each1-sec fian e
Replr detectimn (Senui-supenrised)
cn
Set of stat-eid of Replay scams
Set of stwt-.e2¶of obal, zromii, cbse-up framus
Play-Break(SQ S egmedtatbsn
Set of stat-and fSQ's Coructed SEQ's
and Midlml
Ca1nM1ate S tati0fin ot' _Mid-Levl Feabno_s each SEQ Extractir
Feators
Tr ½*ofStatisticsfor eachHiylits
SqD, Ng& RpD,
-------------....... Excin HighligIt CiassifixatiniPo C1
mt,
fc%,nsar
fo eachSEQ
t 1r*c. etf
{ f> Cons uctioz-tofIndex .
(Chatr atid:)
~~~~Eyt:aztimD ofTe:xt
;ltemdtw'es ArnoWioi for each H idit
Figure 2. Processing Steps of Highlight Classification During training. statistics of each highlight are calculated with the following parameters (the examples are based on AFL video): * SqD = duration of cun-ently-obseived play-break sequence. For example, we can predict that a sequence that contains a goal will be much longer than a sequence with no highlight. * B-R = duration of break / ,SD. Rather than measuring the length of a break to deteimine a highlight, the ratio of break segment within a sequence is more robust and descriptive. For example, we can distinguish goal from behind based on the fact that goal has higher break ratio than behind due to a longei- goal celebration and slow motion replay. * PIR = duration of play scene / S'qD. We find that most non-highlight sequences have the highest play ratio since they usually contain veiv short break. * RpD = duration of (slow-motion) replay scene in the sequence. This measuremenit implicitly represents the number of slow motion replay shots which is generally hard to be detemined due to many camera changes during a slow motion replay. * ExcR = duration of excitement / SqD. Typically, goal consists of a very high excitement ratio whereas nonhighlight usually contain no excitement. * NgR = duration of the frames containing goalarea/duration of play-break sequence. A high ratio of near goal area during a play potentially indicate goal. * CuR = length of close-up views that includes crowd, stadium, and advertisements within the sequence / SqD. We find that the ratio of close-up views used in a sequence can predict the type of highlight. For exaimiple, goal anid belliind liglhliglhts generally lias a
3. Semi-supervised Discovei'y of Heuristics
We aim to minimize the amount of manual sLUperVision in discovering the phenomenal features that exist in each of the different highlights. Moreover, in developing the rules for highlight detection, we should use as little domain klowledge as possible to make the ft-amewor-k more flexible for other sports with minimum adjustments. For this purpose, we have conducted a semisupervised training on 20 samples from different broadcasters aild diffeient matches foi each highlight to deteimiine the characteristics of play-break sequences containing different highlights and no highlights. It is semi-superviised as we manually classify the specific highlight that each play-br-eak sequence (for training) conitains. Moreover, the automatically detected playbreak boundaries and mid-level features locations within each plav-br-eak (such as excitement) are manually checked to ensui'e the accuracy of training. It should be noted that a separate training should be peifoi'mled for non-lighlight to find its distinctive characteristics.
45
To-,aniple. IVidec.
highei close-up views dtue to focusing on just one player such as the shooter and goal celebration. Adv,ertisements after a coal wvill be detected as closeUp 01o 110
Jr-lay ratio".
I.,.
5c
AFL
...
BtisL o
BnsLion2
0
A.FL C oIHaw 2
gr1as18S.
[Ihis set of features is selected as they are generally el'tectiv!e lrOI describing spoIrt events, in particulai-, soccer, basketball and any sports with similar A 11. characteristics. Hoxxever. xs histle occur-ence is not used though it is v ery usetul toi many SpoItS; it is due to the fI-act that ws histles aire hai-dlv audible and often falsely detected fi-om histle blow 1n bv audience. Similaily, inserted texts ocouiiTence is not used as their location w-ithin a sequtence is not piedictable. For example, caption toir a goal is usuallv displaved in the next play shot after goal celebrtioatn while caption for a shot is isually displax ed dui-ing the break. Table 1 shoN.s the tr-aining data based on an AFL match in temills of the locations of play-break sequences that ma;ke up the video and the mid-level featur-es contained Nx ithin each sequence. In this table, the highlighted segments are used for training puIp05es while others clrC used fior detection experiment. Using this type of data. the statistical parameter-s of each highlight for eaech sport genre can be calculated. Table 2 is an example ol the training data used for AFL goal event. After the mid-level fLeatures based parameters are calculated for eacll samiple. the statistical characteristics are then derived as mininmtm maximum, and average values. The statistical data of the universal feature sets within each highlight are pr-esented in Table 3.
10l
O35
i1 el, GO-R, Li 1 L_-H Ao n3' :, S nsLonol (lSi ul 66 Stlb-HAWl, PCol Haw 2______ 48
1.+
Bn}s-L on2
17
CPol-e
Jel
I't
)t, 0 17
1.S
Close-III) I'fttO
4: 00 4:3 (39) btelttlitn (go0l)
2-29 .t.-3u
0:0.95:45 13)
la;y
5: 46 6:06 0k (soitteot te ecse
2
1)
11-33 o23)
36-39 (4o
34-45 121
43-46040
4'-59
/13)
ratio
55-59 0140
0-35
3342
46-54
xNt
il0 jtt t.d
Table 1. Example of Training Data
036
(100 58o9)
00
.
I?
31s
jN
i^
_4___
_
1) 2-;.rl 411) '~ ~ ~f~ ~ ~ ~ ~ 41t 1)41.' j' '
i{'
,2>(
!J
:71
C_c-l-_ __2 07__ 0
r
0 1r (16C, 33
1__
_
__
__
1lI'~ i) 6,7 lil !:-
5r
7
1Cl,1r"iIit.
l
_3
_
.^
4_ ___ 'i f; J81ir 1!1_ IjIbzi 0 01t) 0I f .7 1 2, j,9,f'.'3 54 , I 4^,',:4 0 ,4
0I 6t
Toc
AF-L
Soccer
G=Goal,S=Shoot,
iiax;
Dtiratiott (D)
Play
Raio
(PIR)
Neai-Goal (NgR)
(ExcR)
104-
41)
.x7; 0.87; Fp (0.64; 0.97; Np1()0.73 0.91; Sp (0
Gii (0.47,1;
Gd
Bd_,l
Tt I
Sti_(O.xi; O. Ge
(0.2
((0.17
MP
Tp
NDp
Go
ttR)
Sc
(0.26- 0.o1x 0.08)
Nto
Be
Me
0)
0.74;
Te Ne
0.1
Gii (0.49,0.9?'- 0.04) F (0.4O; G) 09' I- 00': 'S. 0)G tt
00.S
n
0)
Ge_(0.41: Os. 020' Ie (03 0. 0o FIe (0,44; 0.90; Te (0'24] 0483 0.05) 0.8; 0) Go F (0.11; 69;
0.04; 0) (O.038 081 0) (00.8 0.91;0)
0
0.02'; 0O.'9: 01)O)
(O.O3.0.7;,
O5 S o6 0)
0 76 McO..'008 0.O6 0)
0
0
0
FT
o.
;
0.68,0)
To (0.49- O.8- 0.16) T_(..018 0.44; 0) Nc (O2'9; 0.69; 0) Ne (0.2; 0.63', 0) Gr (9; '238°)0l_ O. 0; 0) F
Gf(25; 34; 20) Sr_(6; 16; 0)
Br (6, t0O 0) Mir (1 14-0)
0)
O)
(0.01
Ge (0.308
B0 .
(0.12 0.'9°)
(0;
0.940 ).'7 t 0 Fjp (Ox.O; 06.1; 0.' . Tp1tO 12'0o2-'t 0.05)
(0.6'; 0.S6 0. 6) (00.55,0.S; O.OS)
Ge (0.29
Nc_(0.2 0.6.0)
Ni
9.6)
nO; 11) '4). 'i. '"x !
20
GIo
9);
Close-Ltp
Fr_(6; '2;
8
Fp (0.48 0.7'
Moo
(0.';0.6;
Replay
F `f
m11xa
FTio (0."5. 00) 0(0.0 0 t' 0) 0 1I r) r 0o o00' 0,IO (0 .4; 0
081;
Ne
(Rpt)
o"5;610
6.. 1
4
)
O 081 0.1 ?) l-t 0. 43,; 0.0-') G i(O.I 10; O 0.02) Bi (O.
0.13)
(0.45; 08.83 0.10) 0.79-,0) 0'0;0;80) 3
1l( G Fe+ 4 -> MU+ 5 -> Non+-
2 4 B++ (Extra point)IfD between Orn_min & Bdrnmax 4 G+'
Figure 4. Highlight Classification Rules for AFL. 4
'T++
4 >T4
.
\
I
(',
E
or2&(Gp DO0)
PIP I - G++ 2-' FT++
F++, if RpD>O G++&FT++,ebe
jWlgR)
ag
Else
A PlR _VDJ 1}| P EXC4
3 -> F++
Figure 5. Highlight Classifi'cation Rules for Baslietball
5.1. Performance of Soccer Events Detection Based on Table 6 and Figure Sa, most soccer highlights can be distinguished from non-highlights with high recall and precision. It is to be noted that that D = detected, All = missed detection, F = false detection, Ti- = Total number in Truth, Det = Total Detected, RR = Recall Rate, and PR= Precision Rate; Tru= PD+D+MVf, Det = PD+D+F, RR = (PD+D+M)/Tru * 100%, PR= (PD+D)lDet * 100%.
4.4. Events Classification in Basketball Compared to soccer- and AFL, goals in basketball are not celebrated and do not need a special resume such as kick off Therefore, it is noted that the rules applied to soccer and AFL cannot be used directly for basketball
goals. Figure 5 shows the highlight classification rules for basketball. Let G, FT, F, T be the highlight-score for g^oal, f-ee-hrow. fou/l, and timeout respectively. Thus, for basketball event let: detection, Det Basketball Region(vcul) = Region(val.stat G,stat
As there are noimally not many goal highlights in a soccer match, it would be ideal to have a high RR over a reasonable PR; 5 out of 7 goals are coiTectly detected from the 5 sample videos while 2 shoots and 1 nonhighlight are classified as goals. The shoot segments detected as goals veiy exciting and nearly result in goal. On the other hand, the non-highlight detected as a goal also consist of a long duration and replay scenes and excited commentaries due to a fight between players.
stcat FstatT)
The algoiitlhm firstly checks if current PIR belongs to
statf.r (i.e. output = 4), then the sequence is most likely to
contain timeout. This is followed by comparing: Cur, RpD, JVgR, and D values: each time that the output of comparison is equal to 4, T is fuLther incremented. Else (if culTent PIR does not belong tostatT), it is moIe likely to contain goal, fiee-throw, or foul (if RpD > 0). This is followed by checking: * If NgR belongs to region statGor stat. (i.e. output= 1 or 2). then the comparison is based on the values
48
Samnple Group (Broadcaster) Soccer: UEFA ChalTpions League Group Stage Matches (SBS) S_)Ccer: ITEFA (Chamttpions league (S BS lititiiatioit Rountds Soccer: FIFA World cuLp Final (Nite) So.cer: hitternlationlal Exlubitionl (S BS) Soccet: FIFA\ 100 Atauiversary
Ehlubitto(SoBS) AF1 Letastie Mslatches (Nine'
AFL, Lxeazue \Matclles iTeltti
.A\F. L,easue Filtal rottuid. (Tent)
IBasketball: Athens 2004 COlympics
(S ev erl)
Basketball: Athens 2004 COlympics SBS)
missing some goal segments. For our experiment, we did not use this option as we want to use a uniiversal
Videos "teaml-teams2_period-[dtiratiouil'
MfarnchesterUtcl-Deportivol,2-[9:S1. 19:50] A zatirid-AIikatil, 2[9:55,9:52] Juvents-AMadtridl. 2:[I 9:,9:509 Milans-Intternoziontalel,':[9:40,5:53]
threshold for all highlights. Based on Table 7 and Figure 5b, basketball goal detection achieves high RR and reasonable PR. This is due to the fact that goals generally have very unique characteristics as compared to foul and free throw. Timeouts can be detected veiry accurately (high RR and PR) due to their veiy long and many replay scenes. Moreover, most broadcasters will play some in-between advertisements -when a timeout is longer than 2 minutes, thereby increasing the close-up ratio. Free throw is also detected very well due to the fact that free throw is mainly played in near-goal position; that is, the camera focuses on capturing the player with the ball to shoot. However, it is generally distinguishable from goal based on: less excitement, higher near goal. and more close-up shott; that is, goal scorer is often just shown with zoom-in views to keep the game flowing. However, the system only detected 28 out of 54 foul events. This problem is caused by the fact that after foul, basketball videos often abruLptly switches to a replay scene which is followed bv time-out or free-throw. This can be fixed with the introduction of additional knowvledge such as whistledetection.
Milani-Deporl,2-[51:15,49:36] (SI)
M1adrid-BayernMwicilil.2-[59:41,59:00] (S2)
Depor-Porto-[50:01,59:301 (S3) Bra:il-Gesmna, v 9:.I29,19:46]
Aussie-SthAfhical,2-[48:31.47:50] (S4)
Brazil-Fra,ocel.2-[31:36,37:39] (S5)
COL-GEEL_2-[28:391 (A3) StK-HAW_3-[19:33] (A4)
Rich-StK 4-[25:20] (A5) COL-HAW 2-[28:151 (Al) ESS-BL_2-N35:28] (A2) BL-ADEL l,2:[35:33,l8:00] (A6)
Port-Geel_3.4-[30:37,29:00] (A7)
Wotnen: AusBtazil 1,2,3-[19:50,19:41,4:20] (BI) Women: Russia-USA 3-[19:58] (B2) Ment: Australia-USA 1,2-[29:51,6:151 (B3) Ment: USA-Angola 2,3-[22:25,15:01] (B4) Wonten: Australia-LUSA 1,2-[24:04-1:11] (B5)
Table 4. Details of Sample Data for Experiments 'fhe foul detection is also effective as the RR is 81% and most of the misdetections are either detected as shoot or noon which have the closest characteristics. However, the PR is considerably lowv since some shoots and nonhighlights are detected as foul. An altemative solution is to use whistle existence for foul detection, but we still need to achieve a really accurate whistle detection that can overcome the high-level of noise in most of spoIt domains. Onlv 46 out of 266 non-highlight sequences \Vere incoiTectlv detected as highlights. These additional highlights will still be presented to the viewers as there ar-e gener allv not many significant events during a soccer X'ideo. In fact, most of these false highlights can still be inter-esting for some viewers as they often consist of long excitement, near-goal duration and replay scene.
5.3. Performance of AFL Events Detection Based on the infoimation from Table 8 and Figure Sc the overall peiformance of the AFL highlights detection is found to yield promising results. All 37 goals from the 7 videos were correctly detected. Although the RR of behind detection seems to be low, most of the missdetections are actually detected as goal. Moreover, behind is still a sub-type of goal except that it has lower point awarded. The slightly lower perfoimance for detection of mark anid tackle detection is caused by the fact that our system does not include whistle feature which is predominantly used during these events. Based on the experimental results, mark is the hardest to be detected and needs additional knowledge. It should also be noted that in Table 11, PR and RR for behind is N/A because 1 behind was detected as goal while Mark = N/A because 5 marks were detected as goal.
5.2. Performance of Basketball Events Detection Highlights detection in basketball is slightly harder than soccer and AFL due to the fact that: 1) goals are generally not celebrated as much as soccer and AFL, 2) non-llighlights are often detected as goal and vice versa. Foirunately, non-highlights mainly just include ball out play which hardly happen in basketball matches. Thus, we have decided to exclude non-highlight detection and ieplace it with timeout detection which can be regarded as non-highlights for most viewers. However, for some spoIt fans. timeouts may still be interesting to show the
References
[1] Duan, L.-Y., Xu, M., Chua, T.-S., Qi, T. and Xu, C.S., A mid-level representation framework for semantic SpOrtS video analysis. in ACAl AL412004, (Berkeley, USA. 2003), ACM, 33-44. [2] Ekin, A. and Tekalp, A.M., Generic play-break event detection for summarization and hierarchical sports video analysis. in International Conference on A/hmedia and Exrpo 2003 (IC'MEO3), (2003), IEEE, 6-9 July 2003. [3] Ekin, A. and Tekalp, M. Automatic Soccer Video Analysis and Summarization. IEEE Transaction on Itmage Processing, 12 (7). 796-807.
players and coaches for each
team and some replay scenes. In addition to these problems, sequences containing fouls are sometimes inseparable from the iesulting fi-ee thl-ows. For such cases, the fouls are often detected as goal due to the high amount of excitement and long near-goal. However, fouls which are detected as goals can actually be avoided by applying a higher minimum highlight point for goal but at the expense of
49
[41 Han, M., hLa. W.. Chen, T. and Gong, Y., Feature design in soccer video indexing. in Iniformation, ( o0l7nunications anda' Signal Processing, 2003 and the F/orth Pacific Rimi Conference on Alultitnedia. Pr-oceedings of the 2003 Joint Confer-ence of the Fourth Ihtternational Con7fer ence onl. (2003). 950-954. 151 Li. B. and Ibrahim Sezan, M., Event detection and sLtmmar-ization in sportts video, in Conten7t-Based Access o?f Image and Fideo Libraries, 2001. (CBAIVL 2001). IlEE rffO,rkshop1 onl (Sharp Labs. of America, Camas, WA. USA. 2001), Practical, 132-138. [6] Nepal. S., Srinivasan. U. and Reynolds, G., Automatic detection of 'Goal' segments in basketball videos, in .AC,I hitern1ationial Conifer ence on AfIltimnedia, Ottat\a: Canada, 2001), ACM, 261-269. 171 -TIondronegoro. D., Chen, Y. -P.P. and Pham, B., A Statistical-driven Approach for Automatic Classification olf E:vents in AFL Video Highlights. in The 28th u lstr alasian Comlputer Science Con7fe7 ence, (Newcastle, Australia. 2005). ACS, 209-218. 1X] Wu, C., Ma, Y.-F., Zhang. H.-J. and Zhong, Y.-Z., Fvents recognition by semantic in-ference for spolts video, in .lhultimiedia andExpo, 2002 Proceedinigs. 2002 Il-Ek' Inernational Con?ference on, (2002). 805-808. [19 Xu. P.. Xie. L. and Chang, S.-F., Algorithms and Sy\stem for Segmentation and Structure Analysis in Soccer- Video, in IEEE I7ten77ational Conference on M1hiltinmedia and EVo7. (Tokyo, Japan,, 1998), IEEE.
Ground truth
Goal
Goal Behind Mark Tackle Non Total
Highlight classification of 7 AFL videos Behind Mark Tackle Non
37 11 15 4 4
0 12 1 0 4
71
17
0 7 35 9 11 62
0 0 8 20 3 31
Total
Truth
0 2 5 2 33
37 32 64 35 55
42
Table 8. Highlight Classification Performance in AFL Videos e
_ PR
82,
PR RR
N.^
|
O
8PR
M;--
RR
F-| Shol|
.
oa
RR PR
RR
0
20
40
60
80
1OC
(a)
Highlight classification of 5 soccer
Ground
truth
Goal
videos Shoot Foul I_ 2 0
Non
Goal
5
Slhoot IFoul
2
66
32
12
112
0
13
91
13
117
Non
1
11
34
220
266
8
90
159
245
_=
TFotal
Detected
(b)
Total Truth
0
7
Table 6. Highlight Classification Performance in Soccer Videos Griound tr-uth Highliglht classification of 5 basketball videos GoalI
Free throwv
Foul
Goal
56
0
Fr-ee throxv Foul
4
14
21
2
Timeout
0
0
Total Detected
81
16
Timeout
Truth
0
2
58
0
0
18
28
3
54
0
13
13
28
18
(C)
Figure 6. Distribution of Highlight Classification Performance in a) Soccer, b) AFL and c) Basketball
Table 7. Highlight Classification Performance in Basketball Videos
50