Anderson et al. (2016)) already ..... REFERENCES. Anderson, Jennings, Soden, Robert, Anderson, Kenneth M., Kogan, Marina, and Palen, Leysia (2016). âEPIC ...
Michael Auer et al.
OSM History for Disaster Activation Monitoring
Towards Using the Potential of OpenStreetMap History for Disaster Activation Monitoring Michael Auer
Melanie Eckle
GIScience Research Group, Institute of Geography, Heidelberg University
GIScience Research Group, Institute of Geography, Heidelberg University
Sascha Fendrich
Luisa Griesbaum
GIScience Research Group, Institute of Geography, Heidelberg University
GIScience Research Group, Institute of Geography, Heidelberg University
Fabian Kowatsch
Sabrina Marx
GIScience Research Group, Institute of Geography, Heidelberg University
GIScience Research Group, Institute of Geography, Heidelberg University
Martin Raifer
Moritz Schott
GIScience Research Group, Institute of Geography, Heidelberg University
GIScience Research Group, Institute of Geography, Heidelberg University
Rafael Troilo
Alexander Zipf
GIScience Research Group, Institute of Geography, Heidelberg University
GIScience Research Group, Institute of Geography, Heidelberg University
ABSTRACT
Over the last couple of years, the growing OpenStreetMap (OSM) database repeatedly proved its potential for various use cases, including disaster management. Disaster mapping activations show increasing numbers of contributions, but oftentimes raise questions related to the quality of the provided Volunteered Geographic Information. In order to better monitor and understand OSM mapping and data quality, we developed the ohsome software platform that applies big data technology to OSM full history data. OSM full history data monitoring allows detailed analyses of the OSM data evolution and the detection of remarkable patterns over time. This paper illustrates the specific potential of our platform for disaster activations by means of two case studies. Initial results demonstrate that our flexible and scalable platform structure enables fast and easy information extraction and supports mapping processes and data quality assurance. Keywords
OpenStreetMap, OpenStreetMap History, Disaster management, Street network analyses INTRODUCTION
Up-to-date geodata is a valuable source of information in the aftermath of a disaster, e.g., to coordinate disaster response and to support routing and navigation in the affected areas. When using proprietary or authoritative map data, it is difficult to provide such up-to-date information. In contrast, openly accessible maps such as OpenStreetMap (OSM) enable collaborative and quick mapping of disaster-affected areas, thereby constituting WiPe Paper – Geospatial Technologies and Geographic Information Science for Crisis Management (GIS) Proceedings of the 15th ISCRAM Conference – Rochester, NY, USA May 2018 Kees Boersma and Brian Tomaszewski, eds.
317
Michael Auer et al.
OSM History for Disaster Activation Monitoring
a valuable source of information. For example, after the Nepal earthquake 2015 more than 7 000 volunteers contributed map data to the OSM database using current satellite imagery (Radford 2015). The Humanitarian OpenStreetMap Team (HOT) coordinates such mapping activities through organized mapping tasks using the HOT Tasking Manager (HOT Tasking Manager 2018) and communicating the needs of the relief organizations and the affected population on the ground. Over the last couple of years, OSM data repeatedly proved its potential for disaster applications, in the disaster response as well as the other phases of the disaster cycle (Palen et al. 2015; Dittus et al. 2016b; Eckle et al. 2017). The mapping activations that are supported by many volunteers with various levels of experience oftentimes raise questions related to the quality of the provided Volunteered Geographic Information (VGI). Learning about the data quality that can be expected in a disaster activation helps to evaluate the quality and fitness for purpose of the OSM data. For example, in the case of disaster routing, missing or inaccurately represented streets directly affect the routing quality. Quality assurance mechanisms are directly integrated into the HOT workflow in the form of validations carried out by experienced volunteers. Furthermore, such evaluations can be carried out extrinsically by measuring the data quality of OSM in comparison to other data sets, e.g., proprietary or authoritative data (Haklay 2010; Neis and Zipf 2012; Neis, Zielstra, et al. 2013). While this method proved to be useful in providing measurable results, data to conduct such comparisons are rarely available for the areas of interest (Mooney et al. 2010). Therefore, data quality assessments need to be conducted intrinsically by making use of the OSM full history data. These data sets contain all edits (being it additions, deletions or modifications of objects) that were made by the OSM community since the beginning of OSM in 2004. While these data sets offer a great variety of crucial information, their analysis is challenging due to the large amount of raw data and the evolving object taxonomy in OSM. In order to address these challenges, we develop the ohsome software platform that applies big data technology to the OSM full history data. This paper introduces the platform and illustrates its potential for disaster activation monitoring by means of two case studies. RELATED WORK
Monitoring disaster activations has already proved to be of great potential for the mapping community itself, and for data users to get a better idea about the data quality. For the Nepal earthquake response in 2015, Anhorn et al. (2016) presented a framework to iteratively validate and update OSM objects. The study focused on the spatio-temporal dynamics of spontaneous shelter camps in OSM. Additionally, the accuracy of the mapping was analyzed using a crowdsourcing approach. Dittus et al. (2016a) also presented a monitoring approach analyzing the different levels of engagement of volunteers and the resulting impact on the data and user activity. As disaster mapping activations are oftentimes criticized for a lack of data maintenance, Quattrone et al. (2016) conducted a long-term monitoring study and assessed OSM data contributions in different countries. Besides monitoring during disaster activations, several post-hoc analyses and evaluations have been conducted, e.g., for Haiti 2010, Typhoon Haiyan 2013 (Zook et al. 2010; Soden and Palen 2014; Palen et al. 2015) and for the more recent activation in Nepal 2015 (Poiani et al. 2016; Soden and Palen 2016). With the iOSMAnalyzer, Barron et al. (2014) developed a first framework for intrinsic OSM analyses and provided quality indicators for different use cases. Jokar Arsanjani et al. (2013) furthermore evaluated the evolution of OSM data to investigate specific patterns. First comprehensive intrinsic OSM data analyses related to collaborative disaster mapping have been conducted by Dittus et al. (2017), providing insights about mapper behavior, the mapping community and effects on the contributed OSM data. Openly accessible OSM analysis platforms like OSM Analytics (2018) (a web based interactive visualization of OSM feature density) and EPIC-OSM (a collection of customize-able statistics over raw OSM history data by Anderson et al. (2016)) already provide some quantitative information about data contributions and contribution activity for, e.g., specific HOT projects, but do not provide a full picture of the history of OSM data. Existing software tools to support intrinsic data quality assessments are typically limited by offering only subsets of analysis methods, and/or operate only on small database extracts for a defined number of case study regions. THE OHSOME OSM HISTORY ANALYTICS PLATFORM
OSM offers a large quantity of data that is also quite diverse in respect of feature variety and scale. One aspect of this is the free taxonomy scheme which is based on tags consisting of key-value pairs that are defined by the community itself. This causes the task of analyzing how the data evolved over time to be rather complex, also explaining the lack of general purpose analysis software until now. WiPe Paper – Geospatial Technologies and Geographic Information Science for Crisis Management (GIS) Proceedings of the 15th ISCRAM Conference – Rochester, NY, USA May 2018 Kees Boersma and Brian Tomaszewski, eds.
318
Michael Auer et al.
OSM History for Disaster Activation Monitoring
The aim of the ohsome platform (Ohsome 2018) that is presented in this paper is to implement a distributed database and computing infrastructure that gives access to OSM history data and allows for fast parallel processing. In order to permit arbitrary spatio-temporal analyses, all information that is present in the original OSM history data set and all available metadata fields are herein considered. The ohsome platform is co-developed with the OSM History Database (OSHDB). The contained data is divided into spatio-temporal data cubes which may be distributed over a computing cluster infrastructure. In order to meet different user demands, the platform provides an application programming interface (API) at each of the following three abstraction levels: • The ohsome-API implements a representational state transfer (REST) web service that permits one to interactively answer and visualize common predefined research questions and analyses. That is, the analyses may be conducted in a standard web browser. This API is most suitable for the general public and for non-programmers. • The OSHDB-API exposes the MapReduce big data programming model (Dean and Ghemawat 2004) in the Java programming language. The Java-API is more flexible than the REST-API but still accessible with basic knowledge of the Java programming language. Most of the more advanced analyses can be realized using it. • A low level raw data access gives even more direct access to the OSM data objects stored in the database and more fine-grained control over the data processing. However, a basic understanding of the internal database structure is required in order to interpret the results of a data request correctly. Besides the above-mentioned focus on intrinsic data quality metrics, further application of the platform include exploratory data analyses such as visualizing OSM contributor activity and examining individual OSM objects, the analysis of OSM contribution patterns, or general geo-statistics and visual analytics. Possible applications of these functionalities and their potential are presented in the following two case studies. Their purpose is not to provide comprehensive scientific insights, but to illustrate the kind of analyses that may be performed for scientific investigations of OSM history data. CASE STUDY 1: NEPAL EARTHQUAKE 2015
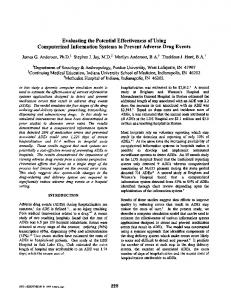
On April 25 and May 12 of 2015, two major earthquakes with magnitudes of 7.8 (36 km east of Khudi) and 7.2 (19 km southeast of Kodari) and several minor tremors hit the central part of Nepal. In this case study we use the ohsome platform to facilitate an exploratory analysis of the evolution of the OSM street network in the aftermath of the Nepal earthquakes 2015 in scope of the disaster mapping activities. Thereby, we focus on the OSM’s fitness for use for disaster routing applications. Common intrinsic quality indicators concerning the street network are completeness of the data set, positional and semantic accuracy and topological correctness (Neis and Zipf 2012; Barron et al. 2014). With respect to routing applications, topological errors in OSM data are described as one of the major challenges (Neis, Singler, et al. 2010; Sehra et al. 2016). For instance, junctions cannot be determined if intersecting OSM ways do not share a common node (Neis and Zipf 2012). Sehra et al. (2017) assess the street navigability of OSM data in Northern India using heuristic indicators and by analyzing road lengths as well as attribute completeness and semantic completeness. In this case study the evolution of the OSM street network (OSM tag highway=*) is investigated for the Nepal earthquake 2015 based on the following quality indicators: • Completeness: (a) street lengths aggregated for street categories and (b) percentage of streets which include street names (e.g., Sehra et al. (2017)), • Topological correctness: (c) percentage of intersecting OSM ways that do not share a common node (d) percentage of OSM endpoints close (distance ≤ 1 m) but not connected to an OSM way (Jokar Arsanjani et al. 2013; Neis and Zipf 2012; Neis, Zielstra, et al. 2013), • User activity: (e) Number of users that edited OSM streets (Neis and Zipf 2012). We examine the topological correctness in monthly time steps for the year 2015, the completeness and user activity is investigated on a daily basis in order to evaluate the direct response phase. The results are presented in Fig. 1. Volunteers started to map streets in OSM right after the April 2015 earthquake. Within seven days 3 619 OSM users added about 310 000 km to the OSM street network. The maximum number of contributors was reached two days after the event. Thereafter, the number of mappers decreased from more than 1 000 on April 27, to about 100 per WiPe Paper – Geospatial Technologies and Geographic Information Science for Crisis Management (GIS) Proceedings of the 15th ISCRAM Conference – Rochester, NY, USA May 2018 Kees Boersma and Brian Tomaszewski, eds.
319
Michael Auer et al.
OSM History for Disaster Activation Monitoring
hwy=*
1e8
length [m]
1.2551 0.7926 0.3302
% of all hwys % of all hwys
highway=road 12.90
16.77
7.84 2.79
hwy with name
11.34 5.92
junction without node % of all jcts.
3.59 2.21 0.83
% of all endpts.
endpoint next to way 1.60 0.87 0.14
number of contributors count
1078 539 0
% of all hwys
impassable hwys 0.019 0.013 0.008 Jan 1
Feb 1
Mar 1
Apr 1
May 1
June 1
July 1
Aug 1
Sept 1
Oct 1
Nov 1
Dec 1
2015
Figure 1. Intrinsic quality indicators, Nepal earthquake response 2015.
day one month later and about 25 contributors per day at the end of June. The Kathmandu district and surrounding regions are the areas with the highest number of contributions. Fig. 2 (left) shows the spatial distribution of the mapping activities and the area for which specific road mapping tasks have been defined via the HOT tasking manager. Not only did the number of mapped streets increase, but also the number of topological errors (Fig. 2, right). A total of 2 018 intersecting OSM streets without a common node have been detected before the earthquake on April 1, increasing up to 6 332 on May 1. The percentage of such errors was relatively constant before the earthquake. However, topological correctness of the data set has been continually deteriorated after the event. Regarding OSM street categories we focused on the tag highway=road. This tag is considered to be temporary and is used for unknown or unverified roads (OSM Wiki: Nepal 2018). During the direct disaster response of the OSM community, the percentage of streets tagged as roads doubled from 6% to 12% within three days. This indicates possible semantic inaccuracies in the post-disaster OSM data set. However, the percentage of streets with the tag highway=road went back to 6% two weeks after the earthquake, meaning that the streets have been further edited and validated. Furthermore, we assessed the attribute completeness for the OSM key name. The percentage of streets with a name tag decreased from 13% down to 8% within 10 days after the earthquake on April 25. In contrast to the streets tagged as highway=road, not much editing was done in the post-disaster data set and the percentage of streets with a name attribute remained low throughout the year 2015. Disaster relief routing applications rely on up-to-date OSM information. Thus, this information is crucial to effectively support relief organizations. This exploratory analysis shows that the collaborative mapping efforts provided a large amount of street network data after the Nepal earthquake 2015. In the direct-response phase this was achieved at the expense of data quality. However, contributors continued their mapping activities and corrected, WiPe Paper – Geospatial Technologies and Geographic Information Science for Crisis Management (GIS) Proceedings of the 15th ISCRAM Conference – Rochester, NY, USA May 2018 Kees Boersma and Brian Tomaszewski, eds.
320
Michael Auer et al.
OSM History for Disaster Activation Monitoring
Figure 2. Evolution of the OSM street network in Nepal 2015; the extent of the HOT tasks which focused on street mapping is marked in red (left). Heatmap showing the density of crossing OSM ways without common node (right).
e.g., the possible semantic inaccuracies due to streets tagged as roads to a certain amount. The presented quality indicators were calculated in a few minutes, providing high potential for near-real time quality analyses and, thus, facilitating feedback mechanisms to the OSM mapping community that can help to address issues in a timely manner. This can help to improve data quality and, thus, applications like OSM routing services to support disaster response. CASE STUDY 2: COMPARATIVE STUDY OF HOT ACTIVATIONS
As described above, HOT was activated for several disasters and provided their support with an increasing number of mapping volunteers over the last years. In each of these activations, main contributions are provided in the response phase of the disasters which generally lasts for more than four weeks after the launch of an activation. While the numerous contributions proved to be of great value for the coordination of disaster management, the VGI character of the data and the different levels of experience of the contributing mappers cause uncertainty regarding the usability of the data in the field. These kind of questions can be addressed using the ohsome platform, e.g., by conducting a follow-up analysis to assess further changes and, therefore, validations that had to be conducted. To achieve this, we extract OSM objects that were added during the direct disaster response period and analyze changes that were applied to the data after the activation period. Because information about buildings and roads are often the most valuable for disaster response, we focus our analyses thereon. The three HOT disaster activations that were selected are the Haiti earthquake activation 2010, the Typhoon Haiyan activation 2013 and the Nepal earthquake activation 2015. While the Typhoon WiPe Paper – Geospatial Technologies and Geographic Information Science for Crisis Management (GIS) Proceedings of the 15th ISCRAM Conference – Rochester, NY, USA May 2018 Kees Boersma and Brian Tomaszewski, eds.
321
Michael Auer et al.
OSM History for Disaster Activation Monitoring
Haiti
Philippines
Nepal
% of created objects changed
30 25 20 15 10 5 0 3
6
9
12
15
18
21
24
27
30
months after the disaster response
Figure 3. Comparison of changes to data that was created during activations (accumulated).
Haiyan and Nepal activation were among the largest in sense of contributors and scope, comparing these activations to the earliest activation in Haiti enables assessing possible developments of the mapping community over time. Similar to the event-response on the ground, mapping also undergoes different stages of activity: pre-event, event, event-response and post-event. The three events are characterized through some key statistics for the respective periods. While the pre-event period shows average numbers of 0.94 (Haiti), 675.18 (Philippines) and 369.46 (Nepal) total contributions per day, these numbers rise to maxima of 12 156, 76 047 and 186 854, respectively, shortly after the event. However this has to be seen in relation with the total area of the countries (Haiti: 27 750 km2 , Philippines: 300 000 km2 , Nepal: 147 181 km2 (Central Intelligence Agency 2018) as well as the amount of OSM-Data available at the start of the activation (Haiti: 1 653 elements, Philippines: 460 079, Nepal: 1 357 336). The three events are furthermore characterized through their respective activation outreach with Haiti showing a mean of 33 unique mappers per day during the event-response while the Philippines and Nepal responses both have averages nearly three times as high (Philippines: 96; Nepal: 81). This exemplary follow-up study, run within minutes and with only little coding effort on the ohsome platform, can help to estimate, e.g., the quality of the added objects and the maintenance of the added data. Quality is high if the data does not need to be changed shortly after the event while maintenance increases the number of changes on the long term. Figure 3 shows the percentage of OSM objects created during the event-response period and changed during the post-event period for our three case-studies. This indicates that quality of the added data is high because a maximum of 15% of the objects were changed until one year after the event. The percentages in the more recent Philippines and Nepal activations indicate even higher data quality. At the same time maintenance seems to take place because these numbers still rise two years after the event. Speaking in total numbers 18 185 objects were changed in Haiti (Philippines: 42 747, Nepal: 46 720) within 30 months after the disaster activations. These changes were contributed by 233 unique mappers in Haiti while the Philippines were corrected and maintained by 943 and Nepal by 1 639 unique mappers. Hence while data quality rises, the number of mappers also rises whereby the mean contribution-share of each mapper decreases. Furthermore, the ohsome platform was used to detect the type of edits that have been applied to the OSM data (see Fig. 4). Thereby possible patterns, the evolution of the data and differences between the three events can be investigated. Comparing the activations, variations in type of edits become apparent. Figures 4a and 4c show that most edits after the Haiti earthquake were tag changes, while most edits after the Nepal earthquake consisted in geometry changes. These patterns could represent the ad hoc character of the Haiti activation that caused a lack of coordination and structure, e.g., regarding tagging schemes, that had to be corrected afterwards. Less changes in the later activations could show experience in activation coordination and training, and therefore less need for corrections. On the other hand, frequently updated satellite data, used as mapping-aid can also lead to a high number of geometry changes if the alignment of imagery varies. While ohsome cannot directly provide information about all factors influencing mapping in OSM, it enables detecting patterns that can then be further analyzed through qualitative assessments of the data and the activation WiPe Paper – Geospatial Technologies and Geographic Information Science for Crisis Management (GIS) Proceedings of the 15th ISCRAM Conference – Rochester, NY, USA May 2018 Kees Boersma and Brian Tomaszewski, eds.
322
number of changes made by category
Michael Auer et al.
OSM History for Disaster Activation Monitoring
80,000
80,000
60,000
60,000
40,000
40,000
20,000
20,000
0
0 3
6
9
12
15
18
21
24
27
30
3
6
9
12
15
18
21
24
27
30
months after the disaster response
(a) Haiti
(b) Philippines
80,000
60,000
other changes 00 0 60tag changes geometry changes 0 3 9 15 21 27 deletions
40,000
20,000
0 3
6
9
12
15
18
21
24
27
30
(c) Nepal Figure 4. Number of changes by type for the three selected disaster responses (accumulated).
itself. Its combination with other data sets and contextual information can thereby in the future deliver further insights. CONCLUSION AND OUTLOOK
We presented two case studies which demonstrate the potential of the ohsome OSM history analytics platform to extract valuable information from the OSM history data, including mapping processes and data quality related to disaster management. Due to its flexibility and scalability, the platform facilitates these kind of analyses of the OSM data evolution and the detection of contribution patterns in VGI data. The exploratory analysis of the street network in the aftermath of the Nepal earthquake 2015 shows that the collaborative mapping efforts could provide a large amount of data within a short time. However, this was at first achieved at the expense of data quality. Additionally, the evolution of OSM objects that were added during the very active direct event-response phase was analyzed for Haiti 2010, Haiyan 2013 and Nepal 2015. The results indicate that maintenance of the added OSM data takes places as the total number of follow-up edits increases in the long term. Comparing the three activations reveals a higher percentage of OSM objects changed in the aftermath of the Haiti activation. This could represent the ad hoc character of the first HOT activation, whereas the more recent activations indicate a higher data quality. The ohsome OSM history analytics platform is not limited to post-hoc disaster response analyses but can also be applied to gain deeper insights into OSM data at all four stages of disaster management (mitigation, preparedness, event, response). Likewise to disasters, OSM data itself changes during these phases. Such patterns and changes can be analyzed using our platform and enable addressing further questions related to recovery, preparedness and mitigation: Is the OSM data that was added and/or changed during the response period of an event maintained in and after disaster recovery? What influence does preparedness mapping have for disaster response and data quality? Further extensions of the database and data analysis framework will make it possible to analyze the OSM data in respect to its metadata such as changeset attributes or user-to-user communication via OSM notes and changeset discussions. While in this study we have shown the potential of the OSM history platform for post-hoc analyses, future work will also facilitate monitoring OSM data contributions during disaster activation in near-real time. Quasi-live OSM data updates (by implementing a mechanism that applies OSM’s minutely data updates to our database) will make it possible to create new tools that help to actively improve OSM data quality by providing feedback-loops between data producers and consumers. Timely data quality assessment during disaster response WiPe Paper – Geospatial Technologies and Geographic Information Science for Crisis Management (GIS) Proceedings of the 15th ISCRAM Conference – Rochester, NY, USA May 2018 Kees Boersma and Brian Tomaszewski, eds.
323
Michael Auer et al.
OSM History for Disaster Activation Monitoring
can help to align training materials, coordination of mapping activities as well OSM-based applications like disaster relief routing. ACKNOWLEDGMENTS
This work is supported by the Klaus Tschira Foundation (KTS), Heidelberg. We thank the anonymous reviewers for their helpful suggestions. REFERENCES
Anderson, Jennings, Soden, Robert, Anderson, Kenneth M., Kogan, Marina, and Palen, Leysia (2016). “EPICOSM: A Software Framework for OpenStreetMap Data Analytics”. In: Proceedings of the 49th Annual Hawaii International Conference on System Sciences (HICSS). Piscataway, NJ, USA, pp. 5468–5477. Anhorn, Johannes, Herfort, Benjamin, and Albuquerque, João Porto de (2016). “Crowdsourced validation and updating of dynamic features in OpenStreetMap an analysis of shelter mapping after the 2015 Nepal earthquake”. In: Proceedings of the 13th International Conference on Information Systems for Crisis Response and Management (ISCRAM). Rio de Janeiro, Brazil. Barron, Christopher, Neis, Pascal, and Zipf, Alexander (2014). “A Comprehensive Framework for Intrinsic OpenStreetMap Quality Analysis”. In: Transactions in GIS 18.6, pp. 877–895. Central Intelligence Agency (2018). The World Factbook. url: https://www.cia.gov/library/publications/the-worldfactbook/ (visited on 03/20/2018). Dean, Jeffrey and Ghemawat, Sanjay (2004). “MapReduce: Simplified Data Processing on Large Clusters”. In: Symposium on Operating System Design and Implementation (OSDI). San Francisco, CA, USA, pp. 137–150. Dittus, Martin, Quattrone, Giovanni, and Capra, Licia (2016a). “Analysing Volunteer Engagement in Humanitarian Mapping: Building Contributor Communities at Large Scale”. In: Proceedings of the 19th ACM Conference on Computer-Supported Cooperative Work & Social Computing (CSCW). San Francisco, CA, USA, pp. 108–118. Dittus, Martin, Quattrone, Giovanni, and Capra, Licia (2016b). “Social Contribution Settings and Newcomer Retention in Humanitarian Crowd Mapping”. In: Social Informatics. Ed. by Emma Spiro and Yong-Yeol Ahn. Cham: Springer International Publishing, pp. 179–193. Dittus, Martin, Quattrone, Giovanni, and Capra, Licia (2017). “Mass Participation During Emergency Response: Event-centric Crowdsourcing in Humanitarian Mapping”. In: Proceedings of the 20th ACM Conference on Computer-Supported Cooperative Work & Social Computing (CSCW). Portland, OR, USA, pp. 1290–1303. Eckle, Melanie, Herfort, Benjamin, Yan, Yingwei, Kuo, Chiao-Ling, and Zipf, Alexander (2017). “Towards using Volunteered Geographic Information to monitor post-disaster recovery in tourist destinations”. In: Proceedings of the 14th International Conference on Information Systems for Crisis Response And Management (ISCRAM). Xanthi, Greece, pp. 1036–1047. Haklay, Mordechai (2010). “How Good is Volunteered Geographical Information? A Comparative Study of OpenStreetMap and Ordnance Survey Datasets”. In: Environment and Planning B: Planning and Design 37.4, pp. 682–703. HOT Tasking Manager (2018). HOT Tasking Manager. url: https://tasks.hotosm.org (visited on 01/25/2018). Jokar Arsanjani, Jamal, Helbich, Marco, Bakillah, Mohamed, and Loos, Lukas (2013). “The emergence and evolution of OpenStreetMap: A cellular automata approach”. In: International Journal of Digital Earth 8.1, pp. 76–90. Mooney, Peter, Corcoran, Padraig, and Winstanley, Adam C. (2010). “Towards Quality Metrics for OpenStreetMap”. In: Proceedings of the 18th SIGSPATIAL International Conference on Advances in Geographic Information Systems (GIS). San Jose, CA, USA, pp. 514–517. Neis, Pascal, Singler, Peter, and Zipf, Alexander (2010). “Collaborative mapping and emergency routing for disaster logistics–case studies from the Haiti earthquake and the UN Portal for Afrika”. In: GI Forum. Salzburg, Austria. Neis, Pascal, Zielstra, Dennis, and Zipf, Alexander (2013). “Comparison of Volunteered Geographic Information Data Contributions and Community Development for Selected World Regions”. In: Future Internet 5.2, pp. 282– 300. Neis, Pascal and Zipf, Alexander (2012). “Analyzing the Contributor Activity of a Volunteered Geographic Information Project — The Case of OpenStreetMap”. In: ISPRS International Journal of Geo-Information 1.3, pp. 146–165. WiPe Paper – Geospatial Technologies and Geographic Information Science for Crisis Management (GIS) Proceedings of the 15th ISCRAM Conference – Rochester, NY, USA May 2018 Kees Boersma and Brian Tomaszewski, eds.
324
Michael Auer et al.
OSM History for Disaster Activation Monitoring
Ohsome (2018). Ohsome OpenStreetMap History Analytics Platform. url: http://www.ohsome.org (visited on 03/13/2018). OSM Wiki: Nepal (2018). OpenStreetMap Wiki – Nepal/Roads. url: https://wiki.openstreetmap.org/wiki/Nepal/ Roads (visited on 01/25/2018). OSM Analytics (2018). OSM Analytics Tool. url: http://osm-analytics.org (visited on 01/25/2018). Palen, Leysia, Soden, Robert, Anderson, T. Jennings, and Barrenechea, Mario (2015). “Success & Scale in a Data-Producing Organization: The Socio-Technical Evolution of OpenStreetMap in Response to Humanitarian Events”. In: Proceedings of the 33rd Annual ACM Conference on Human Factors in Computing Systems (CHI). Seoul, Republic of Korea, pp. 4113–4122. Poiani, Thiago Henrique, Rocha, Roberto dos Santos, Degrossi, Livia Castro, and Albuquerque, Joao Porto de (2016). “Potential of Collaborative Mapping for Disaster Relief: A Case Study of OpenStreetMap in the Nepal Earthquake 2015”. In: Proceedings of the 49th Annual Hawaii International Conference on System Sciences (HICSS). Piscataway, NJ, USA, pp. 188–197. Quattrone, Giovanni, Dittus, Martin, and Capra, Licia (2016). “Exploring Maintenance Practices in CrowdMapping”. In: Proceedings of the 27th ACM Conference on Hypertext and Social Media. HT ’16. Halifax, Nova Scotia, Canada: ACM, pp. 285–290. Radford, Tyler (2015). Nepal Earthquake: A note of thanks to HOT’s aerial imagery providers. url: https : //www.hotosm.org/updates/2015-07-14_nepal_earthquake_a_note_of_thanks_to_hot%E2%80%99s_aerial_ imagery_providers (visited on 01/25/2018). Sehra, Sukhjit Singh, Singh, Jaiteg, and Rai, Hardeep Singh (2016). “Analysing OpenStreetMap data for topological errors”. In: International Journal of Spatial, Temporal and Multimedia Information Systems 1.1, p. 87. Sehra, Sukhjit Singh, Singh, Jaiteg, and Rai, Hardeep Singh (2017). “Assessing OpenStreetMap Data Using Intrinsic Quality Indicators: An Extension to the QGIS Processing Toolbox”. In: Future Internet 9.2, p. 15. Soden, Robert and Palen, Leysia (2014). “From Crowdsourced Mapping to Community Mapping: The Postearthquake Work of OpenStreetMap Haiti”. In: Proceedings of the 11th International Conference on the Design of Cooperative Systems (COOP). Nice, France, pp. 311–326. Soden, Robert and Palen, Leysia (2016). “Infrastructure in the Wild: What Mapping in Post-Earthquake Nepal Reveals About Infrastructural Emergence”. In: Proceedings of the 2016 Conference on Human Factors in Computing Systems (CHI). San Jose, California, USA, pp. 2796–2807. Zook, Matthew, Graham, Mark, Shelton, Taylor, and Gorman, Sean (2010). “Volunteered Geographic Information and Crowdsourcing Disaster Relief: A Case Study of the Haitian Earthquake”. In: World Medical & Health Policy 2.2, pp. 6–32.
WiPe Paper – Geospatial Technologies and Geographic Information Science for Crisis Management (GIS) Proceedings of the 15th ISCRAM Conference – Rochester, NY, USA May 2018 Kees Boersma and Brian Tomaszewski, eds.
325