www.nature.com/scientificreports
OPEN
Received: 11 July 2017 Accepted: 14 May 2018 Published: xx xx xxxx
Toxicity and Transcriptome Sequencing (RNA-seq) Analyses of Adult Zebrafish in Response to Exposure Carboxymethyl Cellulose Stabilized Iron Sulfide Nanoparticles Min Zheng1,2, Jianguo Lu2 & Dongye Zhao1,3 Increasing utilization of stabilized iron sulfides (FeS) nanoparticles implies an elevated release of the materials into the environment. To understand potential impacts and underlying mechanisms of nanoparticle-induced stress, we used the transcriptome sequencing (RNA-seq) technique to characterize the transcriptomes from adult zebrafish exposed to 10 mg/L carboxymethyl cellulose (CMC) stabilized FeS nanoparticles for 96 h, demonstrating striking differences in the gene expression profiles in liver. The exposure caused significant expression alterations in genes related to immune and inflammatory responses, detoxification, oxidative stress and DNA damage/repair. The complement and coagulation cascades Kyoto encyclopedia of genes and genomes (KEGG) pathway was found significantly up-regulated under nanoparticle exposure. The quantitative real-time polymerase chain reaction using twelve genes confirmed the RNA-seq results. We identified several candidate genes commonly regulated in liver, which may serve as gene indicators when exposed to the nanoparticles. Hepatic inflammation was further confirmed by histological observation of pyknotic nuclei, and vacuole formation upon exposure. Tissue accumulation tests showed a 2.2 times higher iron concentration in the fish tissue upon exposure. This study provides preliminary mechanistic insights into potential toxic effects of organic matter stabilized FeS nanoparticles, which will improve our understanding of the genotoxicity caused by stabilized nanoparticles. Iron sulfide (FeS) nanoparticles (NPs) have attracted increasing attention in the environmental remediation field due to their high adsorption capacity and reduction power for a variety of important pollutants1. It has been used for removal or immobilization of a broad spectrum of pollutants (e.g., heavy metals, metalloids, oxyanions, radionuclides, chlorinated organic compounds, nitroaromatic compounds, and polychlorinated biphenyls) in soil and water2–11. To facilitate in situ remediation of contaminated soil and groundwater, stabilized NPs are often employed. Typically, stabilized NPs are prepared by coating certain organic molecules on NPs to prevent the NPs from aggregation. Of various stabilizers reported so far, carboxymethyl cellulose (CMC) represents one of the best stabilizers, which is not only effective, but also green and inexpensive. For instance, Gong et al.12,13 prepared and tested CMC-stabilized FeS NPs for highly effective removal/immobilization of mercury in soil and groundwater. In addition to purposely stabilized NPs, NPs in the environment may become “passively” stabilized by dissolved organic matter (DOM) in the natural environmental systems14–16. Compared to the non-stabilized counterparts, stabilized NPs are often much smaller in size, more mobile in the environment, and more reactive17. They are 1
Environmental Engineering Program, Department of Civil Engineering, Auburn University, Auburn, AL, 36849, USA. 2School of Marine Sciences, Sun Yat-sen University, Guangdong, 510275, China. 3Beijing University of Civil Engineering and Architecture, Beijing, 100044, PR China. Correspondence and requests for materials should be addressed to D.Z. (email:
[email protected])
SCientifiC REPOrTS | (2018) 8:8083 | DOI:10.1038/s41598-018-26499-x
1
www.nature.com/scientificreports/ more transportable in soil or water18,19, and may pose broader and more severe toxic effects on the environment and biota. Yet, little information is available on the toxicity of stabilized NPs. To assure environmentally safe application of stabilized FeS NPs, it is important to understand the potential environmental risks to the ecosystem and human health. The aquatic environment is particularly vulnerable to manufactured NPs, as it acts as a sink for virtually all environmental contaminants20. Consequently, understanding the fate and eco-toxicological risks of NPs in the aquatic systems is urgently needed. However, our knowledge about the toxicity of FeS NPs, especially, stabilized FeS NPs, is very limited. Bare FeS NPs were reported to bind with DNA, limiting the ability of DNA to interact with other nucleic acids and amino acids21. Furthermore, it was shown that FeS NPs at concentrations above its solubility limit may pose genotoxicity by reacting with polynucleic acids, and may nick DNA molecules at concentrations below its solubility limit22. It was also reported that FeS particles can suppress the growth of microorganisms and plants. For instance, in the presence of 2 × 10⁻⁵ M to 5 × 10⁻³ M of non-stabilized FeS NPs, E. coli growth rate was reduced under anaerobic conditions23. FeS particles may impede nutrients uptake and were found partially responsible for reduced seed production and viability when precipitated on the roots of wild rice plants24. However, the underlying molecular mechanisms governing the genotoxicity of FeS or its NPs remain largely unknown. The recently developed transcriptome sequencing (RNA-seq) technique provides a powerful tool for investigating into the genotoxic effects and the molecular mechanisms in organisms after a chemical exposure. It is particularly useful for studying emerging environmental pollutants with limited toxicological information, such as NPs, since it allows for a global examination of biological response through gene expression. Zebrafish (Danio rerio), whose genome has been completely sequenced, is a common model organism for investigating genotoxic effects of chemicals, and it has been used in studying the eco-toxicological effects of engineered NPs25,26. As the environmental applications of stabilized NPs continue to rise, it becomes critical to understand their potential environmental implications. To this end, this study aimed to investigate the stress response of adult zebrafish to CMC-stabilized FeS NPs (CMC-FeS) through the state of the art RNA-seq technique together with the tissue burdens and histological alternation assessments. Differentially expressed genes (DEGs) profiles, gene ontology (GO) and Kyoto encyclopedia of genes and genomes (KEGG) pathways were acquired and analyzed to ascertain genomic responses to the specific stress under CMC-FeS exposure. The reliability of the transcriptomic results were validated by RT-qPCR of selected genes.
Materials and Methods
Chemicals. Iron sulfate heptahydrate (FeSO4⋅7H2O) and CMC (MW = 90 000 in the sodium form, degree of substitution = 0.7) were purchased from Acros Organics (Morris Plains, NJ, USA). Sodium sulfide nonahydrate (Na2S·9H2O), hydrogen peroxide (H2O2), acetic acid, formalin and xylene were obtained from Fisher Scientific (Fair Lawn, NJ, USA). Nitric acid was obtained from Mallinckrodt Chemical (St. Louis, MO, USA). All chemicals are of the ACS reagent grade. All solutions were prepared with local tap water. To avoid effect of chlorine, the tap water was first dechlorinated under aeration at pH 6.0 for ~7 days. Table S1 in Supplementary Information (SI) gives the relevant water quality parameter. Synthesis and characterization of CMC-FeS nanoparticles. Stabilized CMC-FeS NPs were prepared
in 1000 mL flask with nitrogen purging/mixing. First, a CMC solution (0.1%, w/w) was prepared by dissolving CMC with tap water and the solution was purged with purified N2 (>99%) for half an hour to remove dissolved oxygen (DO). Likewise, a solution of 0.0114 M FeSO4 and 0.0152 M Na2S were also prepared with N2 purged tap water. Then, the FeSO4 solution was mixed with the CMC solution to yield a desired concentration of iron and the stabilizer. In this work, 0.001% (w/w) of the CMC was used to stabilize 10 mg/L FeS nanoparticles (i.e. a CMC-to-FeS molar ratio of 0.0005). The mixture was then purged with purified N2 for half an hour to complete the formation of Fe2+-CMC complexes. Then, the Na2S solution was introduced into Fe2+-CMC solution at an Fe-to-S molar ratio of 1:1 to yield the FeS nanoparticles. The nanoparticles were characterized within 1 h of preparation. The morphology of CMC-FeS was determined by Transmission Electron Microscopy (TEM) at 200 KV accelerating voltage (JEM-2100, JEOL, Tokyo, Japan). The hydrodynamic diameter and zeta potential (ζ) were determined by dynamic light scattering (DLS) using a Malvern Zetasizer Nano ZS (Malvern Instruments, Worcestershire, U.K.). In this paper, all data on particle sizes are given as mean ± standard deviation.
Zebrafish experimental study. All procedures involving the handling and treatment of fish used during
this study were approved by the Animal Care and Use Committee at the Heilongjiang River Fisheries Research Institute (ACUC-HRFRI). All experiments were conducted in accordance with the relevant guidelines and regulations. The zebrafish (Danio rerio) were obtained from the Heilongjiang River Fisheries Research Institute Zebrafish Facilities. Adult zebrafish of both sexes with an average age of 6 months, average weight of 0.61 ± 0.10 g and average length of 44.27 ± 2.77 mm were selected for the study. Before the tests, the fish were fed daily with commercially purchased fish food and maintained in aquaria at a temperature of 25 ± 1 °C with a 14 h:10 h light and dark cycle for four weeks. The fish were removed from aquaria and placed in static tanks and fasted for 24 h prior to each experiment, and no fish died before the intended exposure. The sub-lethal concentrations (LC50) were determined following the Organization for Economic Cooperation and Development (OECD) guidelines for testing chemicals27. Five different concentrations of CMC-FeS suspensions (100, 50, 25, 10 and 5 mg/L as total Fe) were prepared prior to use. The zebrafish were randomly assigned to 5 groups (10 fish each) and in turn exposed to an assigned concentration for 96 h in 1 L beaker containing 1 L of a test solution. The sixth group of 10 fish was used as no-dose control. Each treatment was run in triplicates under the same conditions with the natural light/dark cycle. For maintaining the quality of water, the fish were not fed SCientifiC REPOrTS | (2018) 8:8083 | DOI:10.1038/s41598-018-26499-x
2
www.nature.com/scientificreports/ for 24 h prior to the experiments and during the experiments. The water temperature was maintained at 25 ± 1 °C and pH in the range of 6.8–7.3. The number of dead fish was recorded every 12 h and they were removed from the treatment beaker immediately to avoid contamination. After the LC50 was determined, approximately half of the LC50 dose, i.e., the LC25 (LC25 = 10.5 mg/L as total Fe) was applied to 10 fresh zebrafish in 1 L of a test solution/suspension for 96 h. In order to maintain the constant concentration of the nanoparticles, the test solutions/suspensions were replaced every 24 hours28, where the fish were carefully removed from the solution/suspensions with a fish net without any further clean of the adhered NPs in order to avoid unnecessary perturbance of fish by handling, and then added a batch of freshly prepared solution/suspensions. The variation of total iron of FeS NPs were quantified by ICP-MS to be less than 0.2% at time 0 and 24 h in the system, and thus, residual sorbed NPs on fish did not pose a significant effect on the exposure concentration. All treatments were carried out in triplicate and no mortality was observed during the exposure experiments. After the 96 h of exposure, zebrafish in each treatment were rinsed with tap water three times to remove the nanoparticles on fish surface for further testing. To measure the amount of Fe2+ released from CMC-FeS into the solution, control testing suspensions were filtered at time zero and 24 h of preparation using a 25 nm Millipore membrane filter (Millipore Corp., Billerica, MA, USA) and dissolved Fe concentrations were analyzed using an Agilent 7500 cx ICP-MS (Agilent Technologies, USA) equipped with an Octopole Reaction System (ORS).
Tissue accumulations. After the 96 h of exposure, three zebrafish were removed from each of the triplicate testing beakers including the control, and then euthanized with tricaine methanesulfonate (MS222). The tissue samples were weighed (0.41 ± 0.10 g), and then digested for analyzing the Fe content. The digestion was performed in a MarXpress microwave system (CEM, USA). A homogenized tissue sample was transferred into a PTFE (polytetrafluoroethylene) vessel. Then, 5 mL HNO3, 2 mL H2O2 and 3 mL ultra-pure water were added, and then the temperature was ramped to 185 °C in 10.5 min, and kept at this temperature for 14.5 min. After cooling to room temperature, the samples were filtered using a 0.45 µm filter. Finally, 0.5 mL of a 100 mg /L internal standard Mix solution (Agilent Technologies, USA) was added into the filtrates and then diluted to a final volume of 50 mL using ultra-pure water. The samples were then analyzed for total Fe concentration via an ICP-MS system. Fish tissues in the control were also digested in the same way. Histopathology of liver tissue. Two randomly selected fish were removed from each of the triplicate treatment beakers at 96 h of exposure. Fish were euthanized in buffered MS222 and subsequently the liver tissues were dissected. The tissues were fixed in the Davidson’s Fixative (95% Ethanol, Acetic acid, formalin and deionized water) in cassettes for 48 hours. Then the tissues were stored in 70% ethanol. Further, the tissues were dehydrated using graded ethanol series 80%, 90%, 95% and 100% ethanol for 60 mins each, then another 30 mins in 100% ethanol, followed by 60 mins in Xylene, and another 60 mins in fresh Xylene. The carcasses were subsequently transferred to a Tissue Embedding System, and the tissues were embedded in paraffin. The tissue blocks were sectioned into 6 μm thick ribbons with microtome. The ribbons were transferred to a water bath set at 45 °C. Selected tissue sections were placed on slides, which were set vertical to air dry and then placed on a slide warmer set at 45 °C until completely dry. The slides were then stained using the hematoxylin and eosin (H&E) stain by the method of Shehand and Hrapchak29. The stained slides were mounted and covered with a coverslip. Lastly, the slides were observed using a light microscopy on an Olympus BX40 microscope, and photomicrographs were taken using an Olympus BX53 digital camera. High-throughput transcriptomic sequencing. Total RNA isolation and illumina sequencing. Total RNAs were isolated from triplicates of liver tissues (each replicate consisted of tissues pooled from three fishes) at control and treated zebrafish groups. The tissues were homogenized in the TRIzol Reagent and total RNA was extracted using RNeasy Mini Kit (Qiagen, Hilden, Germany) following the manufacturer’s protocol. The quantity and quality of RNA were examined by Thermo ScientificTM NanoDropTM 8000 Spectrophotometer and Agilent 2100 Bioanalyzer (Agilent Technologies, Santa Clara, CA, U.S.). Only RNA with OD 260/280 ≥ 1.8 and RNA integrity number ≥ 7 were selected for the subsequent experiments. Equal quantities of high quality RNA from each tissue sample were pooled together for cDNA synthesis and sequencing. After generating the clusters, library sequencing was performed on an Illumina Hiseq. 4000 platform, to create paired-end reads with a length of 150 bp.
®
Bioinformatics analyses. The quality control of RNA-Seq data was conducted using the NGS QC Toolkit30 with default parameters. Clean paired-end reads were aligned to the zebrafish reference genome sequence, GRCz10 version31, using TopHat32. To identify differential expression genes (DEGs) between two different samples, the expression level for each transcript was calculated using the fragments per kilobase of exon according to the million mapped reads (FRKM) method. Cuffdiff (http://cufflinks.cbcb.umd.edu/)33 was used for the differential expression analysis. The DEGs between two samples were selected based on the following criteria: 1) the fold change was greater than 2, and 2) the false discovery rate (FDR) was less than 0.05. To understand the functions of the differentially expressed genes, gene ontology (GO) functional enrichment and Kyoto encyclopedia of genes and genomes (KEGG) pathway analysis were carried out by Goatools (https://github.com/tanghaibao/Goatools) and KOBAS (http://kobas.cbi.pku.edu.cn/home.do)34. DEGs were significantly enriched in the GO terms and metabolic pathways when their Bonferroni-corrected P-value was less than 0.05.
Experimental validation by qRT-PCR. In order to validate the expression pattern of DEGs identified by RNA-Seq, we selected twelve genes from DEGs potentially associated with immune and inflammatory response,
SCientifiC REPOrTS | (2018) 8:8083 | DOI:10.1038/s41598-018-26499-x
3
www.nature.com/scientificreports/
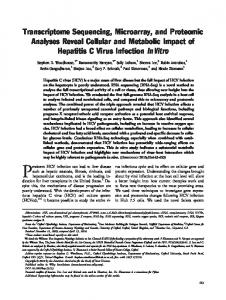
Figure 1. Transmission electron microscopy (TEM) image (a) and the histogram of size distribution (b) of CMC-stabilized FeS nanoparticles (FeS = 10 mg/L, CMC = 0.001 wt.%). The mean particle size is 32.18 ± 5.25 nm. detoxification, oxidative stress, and DNA damage/repair for qPCR validation, including flot2a, cp, stat2, tsc22d3, sgk1, sod3a, cyp1a, abcb4, krt18, pdia4, rad51b, and orc1. Total RNA was extracted using the TRIzol reagent following the manufacturer’s instructions. The RNA quality was assessed using 1% agarose electrophoresis and by measuring the 260/280 nm absorbance ratios. After purification using DNase I (Promega) to remove genomic DNA contamination, the total RNA was reverse-transcribed into cDNA and the gene transcription levels were analyzed using a SYBR Green PCR kit (Toyobo, Osaka, Japan) on an ABI PRISM 7300 Sequence Detector system (Perkin-Elmer, Applied Biosystems). Primer sequences of the selected genes were designed using Primer 3 software (http://frodo.wi.mit.edu/) (Supplementary Information (SI) Table S2). The relative gene transcription levels were calculated using the 2−ΔΔCT method; beta-actin was used as the reference gene and its transcription was constant among exposure groups. The Pearson’s correlation of log10 (fold-change) between qPCR and RNA-Seq was 0.80, indicating the accuracy and reliability of the RNA-Seq based transcriptome analysis.
Statistical Analysis. The statistical analysis approach described by Audic and Claverie35 was performed to
compare the difference in gene expression. The false discovery rate (FDR) was used to determine the threshold P-values in multiple testing and analysis35. A FDR 1 were used as the threshold to determine the statistical significant difference in gene expression36. For GO enrichment analysis, the Bonferroni correction was performed, and the corrected P-value (