BIOINFORMATICS
Vol. 14 no. 1 1998 Pages 92-97
Trace alignment and some of its applications Richard Mott Informatics Group, Sanger Centre, Wellcome Trust Genome Campus, Hinxton Hall, Cambridge CB10 1SA, UK Received on September 23, 1997; revised on October 16, 1997; accepted on October 21, 1997
Abstract Motivation: Extra useful information can be extracted from a DNA chromatogram trace, over that contained in the base-called DNA sequence. Many sequencing applications can benefit from examination of these traces. Results: An algorithm, based on dynamic programming, for aligning a DNA chromatogram to a DNA sequence is described and implemented. Its applications to vector clipping, EST alignment and mutation detection are discussed. Availability: The package is available by anonymous ftp from ftp://ftp.sanger.ac.uk/pub/badger/tracetools.tar.Z Contact:
[email protected] Introduction This paper addresses the problem of aligning a DNA sequence to the chromatogram produced by an automated sequencing machine. This is a special case of the more general problem of aligning a sequence of symbols from a finite alphabet to a continuous signal, and has been studied in other contexts (Sankoff and Kruskal, 1983). However, up until now, it has not been applied to DNA sequence data. DNA sequencing has been revolutionized by the use of automated sequencing machines such as the Perkin-Elmer ABI 373 and 377, together with base-calling software, which can generate data at a very high rate. In essence, the procedure involves measuring the migration rates of DNA fragments through an electrophoretic gel, where fragments ending in each of the four bases A, C, G and T are labelled with coloured dyes so that they can be distinguished. The signal intensities of the migrating fragments are sampled at fixed time intervals as they cross a detector. The result, after signal processing to deconvolve the dyes’ signals and remove background noise, is a chromatogram, or trace, comprising four superimposed curves, one for each base, conventionally coloured green for A, blue for C, black for G and red for T. The heights of the traces at a given time
Present address: Bioinformatics, SmithKline-Beecham Research and Development, New Frontiers Science Park (North), 3rd Avenue, Harlow CM19 5AW, UK
92
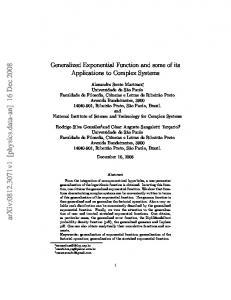
Fig. 1. Example of part of the trace of the EST yo13c02.s1, with the base calls aligned onto the trace, as indicated by the grey background bars.
sample point represent the corresponding signal intensities recorded by the detector. The sampling rate for an ABI trace yields ∼10–20 data points between successive peaks, so although the traces are in fact discrete, they appear continuous to the eye (Figure 1). The process of determining the underlying DNA base sequence, essentially from the order of peaks in the trace, is termed base-calling and the sequence obtained is called a read. Typically, the quality of a trace is poor for about the first 20–50 bases at the 5′ end, but is accurate for the next 300–400 bases (typical error rate ∼1%), before gradually deteriorating towards the 3′ end of the sequence as the migration rates of the fragments on the gel become more variable and the peak heights decline into the background. Applications such as single-pass EST sequencing and genomic sequence shotgun assembly mainly use the higherquality parts of the reads, but there are circumstances where the poor-quality regions at either end of the trace are of interest, or where the extra information held in the high-quality parts of the trace is of importance: (i) Clipping of sequencing vector. The reads obtained from subcloned DNA [as distinct from polymerase chain reaction (PCR) DNA] are generally sequencing vector for about the first 30 bases. This vector sequence needs to be clipped before the read is used. Vector clipping software is normally based on aligning the known vector sequence to the base-called read. If the basecalling is in error, this can result in unclipped vector which can cause problems later, e.g. during sequence assembly. E Oxford University Press
Trace alignment and some of its applications
(ii) Sequence alignment over the full length of the read. In sequence assembly, it is helpful to be able to recognize overlaps between neighbouring contigs, even when these overlaps are based on information from the poorer-quality 3 end. (iii) Identification of exons in genomic DNA by alignment with single-pass EST sequence data. The prediction of genes in uncharacterized genomic DNA sequence can be significantly improved by aligning a spliced EST sequence to the genomic DNA. Again, it is helpful to be able to align the poorer 3 region to obtain the maximum information. (iv) Identification of point mutations between a reference sequence and a set of sequences taken from a population of individuals. Here, the problem is one of looking for differences between the reference and the population which cannot be explained simply as base-calling errors. These are all variants of the same problem: could the trace (or a part thereof) have arisen from a given DNA sequence? The solution is to find the optimal alignment between the trace and the sequence. This paper describes a dynamic-programming algorithm to find this alignment. The algorithm automatically provides a score for each aligned base, indicating how well the base fits with the trace, which can be used to test the significance of the match found.
sequence, although it can be modified to allow deletions (see later). Suppose we have a DNA sequence where the base at position i is Xi , and a trace in which each coordinate t in the trace is a vector representing the intensities of the four nucleotides (ƒA, t , ƒC, t , ƒG, t , ƒT, t ). Typically these are 8-bit unsigned integers in the range 0–255. Associate a ‘state’, with each trace coordinate t, corresponding to the base at the current sequence position i. The key idea in the algorithm is to concentrate on state changes. Imagine moving forwards through the trace, accumulating a score according to the current nucleotide state. If we are at sequence position i and trace coordinate t, then we add ƒXi, t to the score. As we move from t to t + 1, we are allowed to stay in state Xi or make the transition Xi → Xi + 1. Obviously, we favour changing state when the trace for Xi drops below that for Xi + 1. The effect of this procedure is to cut the trace into contiguous segments, each being associated with a base in the sequence. There is no explicit search for peaks, in contrast to base-calling. If Xi and Xi + 1 are the same, i.e. are part of a run of the same base, then additional information about the shape of the trace is needed to ensure these transitions occur at local minima or shoulders. We introduce the state-transition measure WX,Y, t , which is the bonus for changing state X → Y between coordinates t – 1 and t. If X = Y, define:
NJ
L)R W X,X,t ² 0
Implementation The trace alignment source code is available from ftp://ftp.sanger.ac.uk/pub/badger/tracetools.tar.Z There are two application programs: trace_align, which aligns a sequence to an SCF trace (optionally allowing the insertion of introns) and svec_clip, which is specialized to the task of vector clipping, including random shuffling. The code is written in ANSI C and uses the free Staden SCF libraries from ftp://ftp.mrc-lmb.cam.ac.uk/pub/staden/ src/ to handle SCF files and ACEDB graphics libraries from ftp://ftp.sanger.ac.uk/pub/acedb/ for graphical display. The software optionally produces PostScript output (from which Figures 1, 4 and 5 were derived). The package has been developed on Digital AXP workstations running OSF, but has also been ported to Solaris and LINUX.
Algorithm The method is an adaptation of the standard dynamic-programming algorithm (Smith and Waterman, 1981) used for aligning DNA and protein sequences. The basic idea is to treat the sequence as fixed, and find the regions of the trace and sequence which most closely match. In its default form, the algorithm forbids deletions and insertions in the DNA
if L u 0, R u 0 otherwise
where max L ² så[t * d, t] (ƒȀ X,t * ƒȀ X,s)
and δ extends out so long as the derivative f ′X, s does not change sign, up to a maximum of five sample points. Thus, L is the largest change in the derivative of f ′X, s in the left neighbourhood of t. R is similarly defined. Consequently, W is always 0 unless t is a local minimum or a shoulder. If X ≠ Y, then WX,Y is calculated similarly except that fX, t is replaced by the envelope of traces, max (fA, fC, fG, ft) in the above formulae. [In our implementation, W is defined slightly differently to take account of technical problems connected with the discrete nature of the trace and with anomalies such as signal saturation. The source code describes the exact method.] We want to find the maximally matching subsequence and the corresponding subtrace, cf. the Smith–Waterman algorithm, so we modify the trace scores fX, t to make them mostly negative, by subtracting 90% of the maximum of the four traces at each coordinate point. We also define the trace fN, t , for the unknown base N, to be 0 at all sample points (in general the sequence to be aligned to the trace may contain Ns). We can now define a recurrence for the algorithm. Let Mi, t be the score of the best alignment up to base i in the sequence
93
R.Mott
and coordinate t in the trace. Let Xi be the base at position i. Write wi ,t for W Xi*1,Xi,t. Then: M i,t
ȡ MM ² maxȥ Ȣ0
) ƒ Xi,t ) aw i,t i,t*1 ) ƒ Xi,t * bw i,t i*1,t*1
The first term on the right-hand side is the cost of making the transition from Xi–1 to Xi, and the second that of continuing in state Xi. α, β are parameters controlling the relative weight attached to transitions. The inclusion of –βwi, t is to penalize internal minima, as these indicate possible base deletions in the sequence. We find that α = 3, β = 4 work well with 8-bit ABI data. The boundary values for the recursion are all zero. Backtracking starts from the maximum-scoring cell in the dynamic-programming matrix and terminates when the score vanishes. This effectively clips the trace at the points where it starts to diverge significantly from the sequence, either because the sequence genuinely differs, for example when aligning sequencing vector, or because the quality of the trace has deteriorated into noise. Alternatively, the full Needleman–Wunschtype alignment can be obtained by removing the 0 term from the recursion in the usual way. We have found that a necessary refinement is to require state changes to be at least m trace samples apart, so that bases which do not align easily with the trace, e.g. when a small peak is buried in the shoulder of a neighbour, are not squeezed out. Define cumulative trace sums for each nucleotide X: C X,t +
ȍ(ƒ
X,s
* bW X,X,s)
svt
so that the score of being in state Xi – 1 between coordinates t – m + 1 and t – 1 inclusive is D ² C Xi*1,t*1 * C X i*1,t*m The recursion becomes M i,t
ȡ MM ² maxȥ Ȣ0
) ƒ Xi,t ) D ) aw i,t ) ƒ Xi,t * bw i,t i,t*1 i*1,t*m
The first term is the cost of the best path to (i, t) ending with a state transition to Xi , conditional on being in the state Xi –1 for at least m time samples prior to that. In essence, a trace alignment is no more than the list of coordinates ck … cl giving the positions of the state transitions. From these coordinates, the alignment score may be recomputed easily. Formally, the recursion described above will choose k, l and ck … cl such that ci – ci – 1 ≥ m that maximizes the sum:
ȍ(ƒ
c i)1*1
l*1
i+k
Xi,ci
) aw i,t )
ȍ
ƒ Xi,t * bw i,t)
t+c i)1
Figure 1 shows an example of a small section of sequence aligned to the trace of the Washington University Merck EST
94
yo13c02.s1 using the algorithm. In this instance, the trace is aligned to its original ABI base calls. The grey bands in the background show how the trace has been segmented to align to the sequence. Note how information about shoulders (points of inflection) is used to find state transitions in, for example, the run CCCCC at the right of the figure. On a 400 MHz Digital AXP 500, it took 0.37 CPU s to align this trace (6600 sample points) to its original ABI base calls (550 bp), and 18.5 CPU s to align the same trace against a 34 kbp cosmid sequence. This algorithm has a significant memory requirement. A typical trace contains ∼7000 sample points so the alignment of a trace to a 35 kbp cosmid sequence requires a dynamic-programming matrix with 245 million cells. Fortunately, for backtracking only two directions (i.e. 1 bit) need to be stored per cell. Therefore, eight cells are packed into a byte, and 63 Mb of RAM are enough to store the path matrix in this instance.
Statistical properties It is useful to know the statistical properties of alignment scores between traces and random sequences, in particular their dependence on sequence length. It is hard to define what a random trace would be like because its smoothness and non-homogeneity mean that a statistical generator would be difficult to construct, and shuffling an existing trace would destroy its continuity. Therefore, we restrict attention to comparing a fixed real trace to a random sequence. Because it does not permit insertions or deletions in the sequence, the algorithm is really locating maximal-scoring segments similar to those of BLAST (Altschul et al., 1990). From previous theoretical and statistical studies of local protein and DNA alignment scores (Arratia et al., 1986; Karlin and Altschul, 1990; Mott, 1992; Waterman and Vingron, 1994), we expect, for long sequences, a linear relationship between the mean score and the logarithm of the sequence length n, and for fixed n, the scores to have an extreme-value distribution with exponential-type upper tail; i.e. if P(x) is the probability of observing a score ≥x (the P value), then as P → 0: –logP(x) ³ (xńl– log Kn)
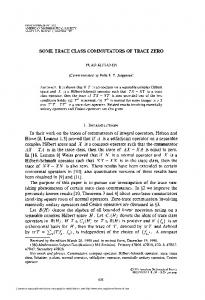
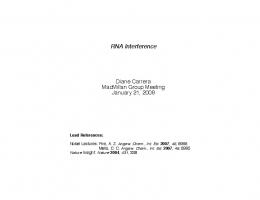
where λ, K are constants depending on the trace and the composition of the sequence. We aligned a trace to 12 sets of 50 fixed-length random sequences, the sets having lengths 16, 32, 64, …, 32 768 bp, using the default parameter settings. Figure 2 shows a plot of the mean score for each length versus the sequence length (log scale), and is approximately linear when n >100. We then aligned this trace to 20 000 random sequences of length 300 bp. P(x) was estimated as the observed fraction of comparisons with scores ≥x. Figure 3 plots the estimated P value (log scale) against score and shows an approximately linear relationship for P < 0.1 until the estimated probabilities
Trace alignment and some of its applications
Fig. 5. Trace alignment of sequence for human glycoprotein IIIa versus a trace with three putative mutations (indicated in pink).
Results Vector clipping Fig. 2. Plot of mean trace alignment score versus sequence length (log scale) for alignments between a trace and 12 sets of 50 randomly generated DNA sequences of varying lengths. The error bars show the standard errors of the means.
Fig. 3. Plot of estimated P value (log scale) versus the score from 20 000 comparisons between a trace and random sequences of length 300 bp.
Fig. 4. Trace alignment of M13 vector sequence onto the start of the trace 22af74g3.s1.
contain too few observations (about P < 0.00015 for these data) to be reliable. Further simulations (not shown) have indicate that log P(x) varies linearly with log n.
5′ Sequencing vector is sometimes difficult to clip using methods based on a sequence alignment of the base calls to the vector sequence because the trace can be very poor at the start of the read. The advantage of using trace alignment is that it is independent of the base-calling and can pick out features in the trace which match the vector sequence even when they are partially masked by artefacts such as saturation. In some examples, the start of the trace is so poor that it is not even clear by eye where the correct vector clip point is. Therefore, we repeat the alignment of the trace to 20 shuffles of the vector sequence: if the real alignment score is greater than all the shuffles, this is strong evidence that the correct site has been found. We use a slight variant of the algorithm described above. Since we know that the right-hand end of the vector sequence must match to the trace, instead of finding the maximal matching segment, we find the best alignment terminating at the sequence right end. This is easily achieved by taking the maximum scoring path terminating at the sequence end in the dynamic-programming matrix, instead of the global maximum. At the Sanger Centre, trace alignment is used routinely to clip sequencing vector from readings prior to assembly. We have developed a specialized tool, svec_clip, which first attempts to clip using alignment to the base calls. If the alignment score does not exceed 20 shuffles of the vector, then the trace is aligned. This program also clips 3 vector and checks whether the read is completely vector. Figure 4 shows an example of a poor-quality trace where the green A signal is interfering with the other dyes. By eye, it is possible to identify the region of the trace corresponding to M13 vector, ending at about trace coordinate 280. However, the ABI base calls for the trace over this region are: aaagtaaaaaaaaagagaaaaaa which do not align to the true vector sequence gccaacattgcatgcctgcaggtcgactctagaggatcccc As Figure 4 indicates, trace alignment of the vector sequence to the trace identified the vector region correctly.
95
R.Mott
EST alignment In the absence of completely reliable gene-prediction software, sequence annotators have found that one of the most certain ways of identifying exons in genomic DNA is by aligning it with a spliced sequence such as an EST. The traces for the ESTs sequenced by the Merck–WashU IMAGE consortium are all available by anonymous ftp (Hillier et al., 1996). Trace alignment may be helpful for identifying exons corresponding to the low-quality 3 end of a trace which might not match in a sequence comparison. However, the trace alignment algorithm described above will not work without modification to cope with arbitrary length introns in the DNA sequence. In a manner analogous to Mott (1997), we introduce a length-independent gap penalty G and define Pi,t as the sequence position corresponding to the best alignment ending at sample position t and such that Pi,t < i, and Bi,t as the associated score. Then we have:
M i,t
ȡ MB ȧ ² maxȥ M ȧ Ȣ0
) ƒ t,Xi ) D ) aw i,t * G ) ƒ t,Xi ) D ) aw i,t i,t*m i,t*1 ) f Xi,t * bw i,t i*1,t*m
The second term is the cost of the best path to (i, t) with an intron inserted from Pt – m + 1 to i – 1 inclusive. Also: B i,t ² max (B i,t, M i,t)
For clarity, we have written Bi, t , Mi, t , but in our implementation we save space by storing just the values Bt , Mt for the current row i. Whenever these values are updated, the previous pair is pushed onto a stack in case it is needed for backtracking. The algorithm needs to store three directions (2 bits) per cell, which unfortunately doubles the memory requirement. G should be chosen to be larger than the expected score of a random match, as this will exclude most random jumps. From Figure 2 and some experiments, we found that G = 3000–4000 is a good choice with the default parameter settings. This version of the algorithm is appreciably slower: it took 59.9 CPU s to align the example EST and cosmid used above, but found three exons rather than the single one reported by the original. If G is too small, then the algorithm finds many false matches and its statistical behaviour changes from a logarithmic to linear dependence on sequence length (Waterman et al., 1987).
Detection of errors and mutations Here the issue is to identify and classify differences between sequence and trace. For example, to search for polymorphisms (mutations), a reference sequence is aligned to traces derived from several individuals. Local misalignments indicate possible mutations or sequencing errors. As an aid, the algorithm recalculates the score for each aligned base, parti-
96
tioned into four components which measure different types of likely error: (i) the sum of the modified fX, t values, which is related to the average signal for the base, and measures the overall contribution of the aligned base (substitution errors); (ii) the left L and (iii) right R shoulder values from the W terms which quantify the peak definition (insertion errors); (iv) the sum of W values from any internal minima or shoulders, which indicate possible sequence deletions.
Table 1. Trace alignment scores for Figure 5. The columns are: DNA sequence position, trace coordinate, score for aligned base. These are partitioned into: sum of fX, t values, internal minima, left shoulder and right shoulder
Sequence position
Trace coordinate
Score
Sum
Internal minima
Left
Right
300 301 302 303 304 305 306 307 308 309 310 311 312 313 314 315 316 317 318 319 320 321 322 323 324 325 326 327 328 329 330 331 332 333 334 335 336 337
3314 c 3330 c 3339 c 3354 a 3366 g 3373 c 3389 a 3402 g 3408 g 3427 a 3444 c 3453 g 3460 a 3487 G 3492 t 3502 g 3513 c 3528 a 3540 g 3548 c 3560 c 3573 c 3585 c 3597 c 3612 g 3618 A 3623 g 3650 a 3669 g 3685 g 3694 G 3699 t 3713 c 3724 a 3736 g 3746 c 3758 c 3771 c
319 104 168 36 17 118 75 24 222 269 70 –13 264 –177 120 75 110 39 3 102 158 167 185 191 43 –232 147 328 258 172 69 325 139 8 6 97 132 156
225 82 118 16 11 80 43 12 150 185 32 –19 306 –203 72 43 68 25 7 68 118 135 149 149 29 –164 171 234 194 144 31 215 71 8 12 65 98 110
0 0 0 0 0 0 0 0 0 0 0 0 –88 0 0 0 0 0 –16 0 0 0 0 0 0 –68 –64 0 0 0 0 0 0 –12 –12 0 0 0
58 8 20 10 2 16 20 8 34 48 18 2 46 0 26 20 24 6 6 24 24 20 18 14 14 0 0 58 40 28 0 66 36 12 0 22 18 20
36 14 30 10 4 22 12 4 38 36 20 4 0 26 22 12 18 8 6 10 16 12 18 28 0 0 40 36 24 0 38 44 32 0 6 10 16 26
Trace alignment and some of its applications
Because the algorithm is maximizing the score, the effect of aligning the wrong base may be unexpected. For example the cheapest way to minimize the bases’ effects at positions 313 and 325 is to squeeze and displace them into lower-scoring regions. Consequently, the scores of neighbouring bases may be lowered by including local minima, as positions 312 and 326 illustrate. Figure 5 shows part of the alignment of the sequence for human platelet glycoprotein IIIa and a trace. The corresponding partitioned base scores are in Table 1. This example illustrates how differences between sequence and trace map onto the scores. There are three major discrepancies, highlighted in pink. (i) Position 313, G in sequence substituted for A in trace, substitution score = –203. (ii) 325, A substituted for G, score = –164; the average substitution score for this alignment is 75 ± 5, so these positions are extremely significant. (iii) 329/330 G deleted, shoulder scores = 0 (average 20 ± 1). We checked these differences by aligning with a trace from a reverse read. (i) and (ii) are genuine, while (iii) is an artefact, the reverse read showing three clear G peaks. This emphasizes the well-known fact that both forward and reverse read information should be used where available. We have found that a convenient way to display the putative mutations found amongst a large set of traces is to (i) align each trace to the reference sequence, (ii) create new SCF files with the aligned bases projected back onto each trace as artefactual base calls, (iii) create a GAP database (Staden, 1996) with each modified trace in a multiple alignment and with tags marking regions where the base scores are below a threshold value, and (iv) display and edit the database using GAP4. The user then reviews the traces at each tagged position to decide whether the mutation is genuine. The trace alignment code has the facility to write out the necessary tag files and revised SCF files. Another approach using traces to identify mutations is described in Nickerson et al. (1997).
Discussion We have described a general method for matching a trace to a DNA sequence, with a broad range of applications. The algorithm can be thought of as an extension of existing local sequence alignment methods, and has similar statistical behaviour. Trace alignment complements rather than directly competes with base-calling, providing instead a framework for testing hypotheses about sequences and traces. The bulk of work involving DNA comparison can of course be performed adequately using existing methods, but trace alignment will be of use whenever we require the additional information held in a trace but which cannot be captured adequately by base-calling.
We are currently extending the algorithm to align traces to traces to enhance the sensitivity and specificity of mutation and polymorphism detection (Kwok et al., 1995). A linear-space implementation of the algorithm, particularly for EST alignment, is a high priority. It would also be useful to add the constraint that the algorithm cannot spend more than a maximum time in each state, but this would be expensive to implement.
Acknowledgements We thank Cheni Kwok, Simon Dear, Richard Durbin and Gos Micklem for their help and advice. This work was supported by a grant from the Wellcome Trust.
References Altschul,S.F., Gish,W., Miller,W., Myers,E.W. and Lipman,D.J. (1990) Basic local alignment search tool. J. Mol. Med., 215, 403–410. Arratia,R.A., Gordon,L. and Waterman,M.S. (1986) An extreme value theory for sequence matching. Ann. Stat., 14, 971–993. Hillier,L. et al. (1996) Generation and analysis of 280,000 human expressed sequence tags. Genome Res., 6, 807–828. Karlin,S. and Altschul,S.F. (1990) Methods for assessing the statistical significance of molecular sequence features by using general scoring schemes. Proc. Natl Acad. Sci. USA, 87, 2264–2268. Kwok,P.-Y., Deng,Q., Zakeri,H., Taylor,S.L. and Nickerson,D.A. (1995) Increasing the information content of sts-based genome maps: Identifying polymorphisms in mapped stss. Genomics, 31, 123–126. Mott,R.F. (1992) Maximum-likelihood estimation of the statistical distribution of Smith-Waterman local sequence similarity scores. Bull. Math. Biol., 54, 59–75. Mott,R.F. (1997) Est_genome: a program to align spliced DNA sequences to unspliced genomic DNA. Comput. Applic. Biosci., 13, 477–478. Nickerson, D.A., Tobe, V.O. and Taylor, S.C. (1997). PolyPhred: automating the detection and genotyping of single nucleotide substitutions using fluorescence-based resequencing. Nucleic Acids Res., 25, 2745–2751. Sankoff,D. and Kruskal,J.B. (eds) (1983) Time Warps, String Edits, and Macromolecules: The Theory and Practice of Sequence Comparison. Addison-Wesley, Reading, MA. Smith,T.F. and Waterman,M.S. (1981) Identification of common molecular subsequences. J. Mol. Biol., 147, 195–197. Staden,R. (1996) The Staden sequence analysis package. Mol. Biotechnol., 5, 233–241. Waterman,M.S. and Vingron,M. (1994) Rapid and accurate estimates of statistical significance for sequence database searches. Proc. Natl Acad. Sci. USA, 91, 4625–4628. Waterman,M.S., Gordon,L. and Arratia,R. (1987) Phase transitions in sequence matches and nucleic acid structure. Proc. Natl Acad. Sci. USA, 84, 239–1243.
97