Appeared in S. Kounev, I. Gorton, and K. Sachs (eds.) ...... Experimental Design, Measurement, Simulation, and Modeling. 1st edn. John. Wiley & Sons (April ...
Appeared in S. Kounev, I. Gorton, and K. Sachs (eds.), Performance Evaluation - Metrics, Models and Benchmarks: Proceedings of the SPEC International Performance Evaluation Workshop 2008 (SIPEW ’08), volume 5119 of Lecture Notes in Computer Science, pages 283–302, Heidelberg. Springer. June 2008. The original publication is available at www.springerlink.com
Trace-Context Sensitive Performance Profiling for Enterprise Software Applications? Matthias Rohr1 , Andr´e van Hoorn1 , Simon Giesecke2 , Jasminka Matevska1 , Wilhelm Hasselbring1 , and Sergej Alekseev3 1 2
Software Engineering Group, University of Oldenburg, Germany OFFIS Institute for Information Technology, Oldenburg, Germany 3 Nokia Siemens Networks GmbH & Co KG, Berlin, Germany
Abstract. Software response time distributions can be of high variance and multi-modal. Such characteristics reduce confidence or applicability in various statistical evaluations. We contribute an approach to correlating response times to their corresponding operation execution sequence. This provides calling-context sensitive timing behavior models. The approach is based on three equivalence relations: caller-context, stack-context, and trace-context equivalence. To prevent model size explosion, a tree-based hierarchy provides timing behavior models that provide a trade-off between timing behavior model size and the amount of calling-context information considered. In the case study, our approach provides response time distributions with significantly lower standard deviation, compared to using less or no calling-context information. An example from a performance analysis of an industry system demonstrates that multi-modal distributions can be replaced by multiple unimodal distributions using trace-context analysis.
1
Introduction
Response time monitoring data is a valuable artifact for software performance analysis of software systems, such as enterprise information systems based on Java EE. For instance, response time data from such systems is used for online performance evaluation, such as performance optimization and failure diagnosis, and for offline performance evaluation, such as performance tuning, benchmarking, profiling, and performance prediction. Typically, not only end-to-end response times are considered, but also response times of operations (alternatively called methods, routines, procedures, or sometimes services), i.e., software architecture entities that group statements to larger blocks of software. Enterprise software applications are usually deployed in middleware environments that do not provide real-time properties and show non-trivial scheduling and queueing behavior. These systems typically have to serve large numbers of concurrent and heterogeneous user requests competing for computational resources. Therefore, the timing behavior of such systems tends to be of high ?
This work is supported by the German Research Foundation (DFG), grant GRK 1076/1
1
Appeared in S. Kounev, I. Gorton, and K. Sachs (eds.), Performance Evaluation - Metrics, Models and Benchmarks: Proceedings of the SPEC International Performance Evaluation Workshop 2008 (SIPEW ’08), volume 5119 of Lecture Notes in Computer Science, pages 283–302, Heidelberg. Springer. June 2008. The original publication is available at www.springerlink.com
variance and follows complex distributions. Unfortunately, many analytical and statistical performance evaluation approaches may produce low quality results for such timing behavior or cannot handle complex distribution families. Operation executions show specific timing behavior for the calling-context of an operation execution, which is given by the call trace that corresponds to the execution of an operation. We discovered that a significant part of undesired distribution characteristics result from calling-context specific timing behavior of software operations. Our approach is to derive calling-context specific response time distributions by correlating response times to sequences of operation executions (see also Rohr et al. [1]). The resulting timing behavior model consists of multiple, calling-context specific response time distributions for each operation. For large and dynamic systems, the number and size of traces might be very large. To prevent model size explosion [2], a hierarchy of abstraction levels for calling-context information is provided. Three abstraction levels are given by three equivalence relations: caller-context, stack-context, and trace-context equivalence. A tree-based hierarchy provides timing behavior models that provide a trade-off between timing behavior model size and the amount of callingcontext information considered. We contribute new empirical data on trace-context specific timing behavior distributions from a commercial telecommunication software system and a detailed analysis for a non-trivial Java online store demo application. Tracecontext analysis is also compared to two other types of calling-context types (stack-context, caller-context). Furthermore, it is analyzed how the number of instrumented software operations relates to the calling-context analysis. Finally, the case study provides quantitative data showing that trace-context information is a major source of dispersion in response time distributions. In contrast to our former results [1], the reduction of standard deviation is studied for a large number of random instrumentations, to provide results that are independent from the selection of monitoring points. The document is structured as follows. Section 2 discusses calling-context dependence in software timing behavior. Our approach to modeling timing behavior in dependence to calling-contexts is presented in Section 3 in combination with an example based on monitoring data from an industry system. Section 4 presents a step to optimize the timing behavior model. The case study is presented in Section 5. A discussion of our approach is in Section 6 before the related work and the conclusions follow in Section 7 and 8.
2 2.1
Calling-Context Dependence of Software Response Time Distributions Software Response Time Distribution Characteristics
In this paper, the duration between the start and the end of an operation execution is denoted its response time [3]. This response time metric does not distinguish CPU time for the operation execution from other times, such as I/O
2
Appeared in S. Kounev, I. Gorton, and K. Sachs (eds.), Performance Evaluation - Metrics, Models and Benchmarks: Proceedings of the SPEC International Performance Evaluation Workshop 2008 (SIPEW ’08), volume 5119 of Lecture Notes in Computer Science, pages 283–302, Heidelberg. Springer. June 2008. The original publication is available at www.springerlink.com
0.008 0.000
0.004
Probability density
700 500 300 100
Response time in microseconds
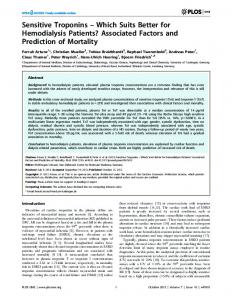
processing time, resource waiting time, and response times of invoked operations (sub-calls). Hence, this metric less accurately describes the resource demands (e.g., CPU and I/O) than other timing metrics that do that distinction. The advantage of this simple response time metric is that it can be efficiently monitored and it does not require platform-specific monitoring functionality such as hardware performance counters. Response time distributions of operations in software systems, such as in Java EE applications, often show high variance and do not follow simple distribution families, such as exponential or normal distributions. For instance, we measured the software operation response times displayed in Figure 1(a) during a performance evaluation of a large industry software system of Nokia Siemens Networks. The system evaluated is one of the leading commercial software platforms for implementing signaling services in telecommunication networks. The shape of the response time distribution (Figure 1(b)) of this operation cannot be accurately described by a single exponential or normal distribution.
14:18
14:20
14:22
14:24
0
Calendar time (hour:minute)
100
200
300
400
500
600
Response time in microseconds
(a) Response times measured for operation f .
(b) Probability density distribution for operation f .
Fig. 1. “Clusters” and multi-modality in the software operation response times monitored in an industry telecommunication signaling system.
Another example of multi-modal timing behavior distributions is provided by Bulej et al. [4]. These authors reported multi-modal response time distributions in different versions of CORBA middleware and use the term “cluster” for each group of similar response times. Bulej et al. [4] illustrate that clusters in timing behavior measurements reduce the potential to detect changes in the timing behavior of software. The authors experienced this problem in the context of performance regression benchmarking, which aims at detecting regressions in software performance between different versions of a software product. High variance in response time distribution reduces the confidence in various statistical evaluations. An example for such an evaluation is the statistical hypothesis test that two response time observation sets belong to the same distribution. The confidence of this test usually decreases by increasing standard deviation, or more samples are required to reach the same confidence.
3
Appeared in S. Kounev, I. Gorton, and K. Sachs (eds.), Performance Evaluation - Metrics, Models and Benchmarks: Proceedings of the SPEC International Performance Evaluation Workshop 2008 (SIPEW ’08), volume 5119 of Lecture Notes in Computer Science, pages 283–302, Heidelberg. Springer. June 2008. The original publication is available at www.springerlink.com
Complex distributions, e.g., showing multi-modality, are not usable in many performance evaluation approaches because of mathematical tractability. Approximating complex distributions of response time measurements using simple distribution families is an option to satisfy requirements of performance evaluation approaches, but may lead to low quality results.
2.2
Calling-Context Specific Timing Behavior
Different timing behavior can correspond to multiple calling-contexts for the same software operation. Possible reasons are that the contexts correspond to particular software system states or operations show different timing behavior when they are used in different types of service requests. An example for the first is that a system provides different levels of personalization depending on the current workload intensity [5]; an example for the latter is that the response time of a service might heavily depend on the type of the request e.g., a watermarking service in an online media store might show different response time distributions for different media types that use individual watermarking techniques. Calling-context is the set of circumstances or facts that surround an operation call. Software operation executions are embedded in sequences of interacting operation executions that participate in answering external service requests (from users or other systems). We consider three simplified models of the general calling-context that take into account different parts of the execution sequence of an execution: caller-context, stack-context, and trace-context. These models will be described in more detail in the next section. Many aspects of the context of an operation execution are relevant to performance behavior. A key activity of performance modeling is the selection of the relevant aspects to consider. Obviously, the more such aspects are included, the higher precision can be expected from performance analysis. Modeling all relevant aspects to timing behavior is usually not an option, since the overall modeling and analysis effort grows by increasing modeling detail. Additionally, in some cases such as performance modeling during the early design of a software system, relevant context information may be unknown and it has to be decided, whether unknown relevant context information is estimated and included, or if it is excluded from the performance model. The response time distribution of an operation is composed of response times made in different calling-contexts. It is our hypothesis that this causes a significant part of the distribution variance or multi-modality. If this hypothesis is true, it follows that including relevant calling-context information into timing behavior modeling can improve timing behavior evaluation approaches that are sensible to high variance or multi-modality in response time distributions, such as many anomaly detection approaches.
4
Appeared in S. Kounev, I. Gorton, and K. Sachs (eds.), Performance Evaluation - Metrics, Models and Benchmarks: Proceedings of the SPEC International Performance Evaluation Workshop 2008 (SIPEW ’08), volume 5119 of Lecture Notes in Computer Science, pages 283–302, Heidelberg. Springer. June 2008. The original publication is available at www.springerlink.com
3
Approach to Calling-context Sensitive Timing Behavior Modeling
In this section, we describe how calling-context information can be used in timing behavior modeling. We compare three different types of calling-context information: caller-context, stack-context, and trace-context. Caller-context and stack-context information have been used in performance evaluation before by Ammons et al. [6] and Graham et al. [7]. 3.1
Software Behavior and its Monitoring
We assume that software systems are composed of components. The components provide operations that might be requested by other components, external users, or systems. Primary artifacts of runtime behavior are executions of the operations. We define a monitored execution as a tuple (o, i, r, st) of an operation o, its response time r, a start time st, and an identifier i, which is a number to distinguish executions of the same operation. As described in Section 2.1, we define the response time of an execution to be the number of time units (e.g., milliseconds) between the start and the end of an execution. A trace is a finite sequence of operation executions that results from a user request or a request of an external system. We limit the scope to synchronous communication between executions as defined in the UML [8]: the caller of an operation is blocked and has to wait until the callee returns a result before it continues its own execution. Figure 2 provides the UML Sequence Diagrams for the running example.
Fig. 2. UML Sequence Diagrams from a module of a partially instrumented telecommunication signaling system of Nokia Siemens Networks derived from monitoring data. (Operation names changed, operations omitted).
5
Appeared in S. Kounev, I. Gorton, and K. Sachs (eds.), Performance Evaluation - Metrics, Models and Benchmarks: Proceedings of the SPEC International Performance Evaluation Workshop 2008 (SIPEW ’08), volume 5119 of Lecture Notes in Computer Science, pages 283–302, Heidelberg. Springer. June 2008. The original publication is available at www.springerlink.com
A trace can be represented by a dynamic call tree [6]. Each node of such an ordered tree represents an operation execution by its operation name. An edge from one node to another, i.e. their parent-child relation, corresponds to the caller/callee relation within the trace. Figure 3 shows the four trees (three consisting of one node only) that represent the traces shown in Figure 2.
Fig. 3. Tree representation of each of the traces illustrated in Figure 2.
3.2
Types of Calling-Context Equivalence
It is our goal to partition operation response times that are within equivalent calling-contexts. In the following we specify three equivalence relations: – Caller-context equivalence: Two executions of the same operation are callercontext equivalent if they are called from operations with the same name. – Stack-context equivalence: Two executions of the same operation are stackcontext equivalent if the paths from the corresponding nodes to their roots are equal. – Trace-context equivalence: Two executions of the same operation are tracecontext equivalent if the corresponding trees are equal and both executions correspond to dynamic call tree nodes with the same position within the tree. Trace-context equivalence implies stack-context equivalence and stack-context equivalence implies caller-context equivalence. Each of the three equivalence relations specifies a partitioning of the monitored executions and its response times into equivalence classes. In the following, we use the terms caller-, stack-, and trace-context to refer to an equivalence class of executions that are caller-, stack-, and trace-context equivalent respectively. The term calling-context refers to any of those three equivalence classes. 3.3
Example: Trace-Context Analysis
As presented in Section 2.1, operation f has a multi-modal response time distribution (Figure 1(b), page 3). Applying calling-context analysis to the monitoring data and corresponding traces, shown as trees in Figure 3, identifies sets of
6
Appeared in S. Kounev, I. Gorton, and K. Sachs (eds.), Performance Evaluation - Metrics, Models and Benchmarks: Proceedings of the SPEC International Performance Evaluation Workshop 2008 (SIPEW ’08), volume 5119 of Lecture Notes in Computer Science, pages 283–302, Heidelberg. Springer. June 2008. The original publication is available at www.springerlink.com
calling-contexts. This set is consists of three trace-contexts, two stack-contexts (d(), a(), f () and f ()), and two caller-contexts ($(), denoting the external caller, and a()). The stack-contexts and caller-contexts are identical for this operation. Therefore, stack-context information does not allow one to distinguish more calling-context than using caller-context information in this case.
0.008 0.000
0.004
Probability density
0.008 0.004 0.000
Probability density
Stack-Context Analysis and Caller-Context Analysis Figure 4 shows the corresponding probability density distributions that would result from stack-context analysis and caller-context analysis for this operation. The first stack-context still shows a multi-modal distribution (Figure 4(a)). The standard deviation of all response times for that operation is 136.47, the standard deviation corresponding to stack-context 1 is 155.54 and for stackcontext 2 it is 49.74. The average standard deviation for the stack-context sensitive model, weighted by the observed calling frequency, is 120.13. This means that 11.97% of the standard deviation for the monitoring data of this operation can be removed using stack-context information.
0
100
200
300
400
500
200
Response time microseconds
250
300
350
400
450
Response time in microseconds
(a) Probability density distribution for stack-context 1.
(b) Probability density distribution for stack-context 2.
Fig. 4. Stack-context analysis identifies two stack-contexts for operation f .
Trace-context Analysis Trace-context analysis allows one to distinguish three response time distributions as illustrated in Figure 5. These trace-contexts correspond to different calls of operation f shown in the UML Sequence Diagrams in Figure 2 on page 5: Trace-context 1 (solid line in Figure 5(a)) corresponds to the first call of f () in SD1, trace-context 2 (Figure 5(b)) to the second call of f () in SD1, and trace-context 3 (dashed line in Figure 5(a)) to the call of f () in SD4. The three probability distributions for these trace-context are not multimodal. This demonstrates that a multi-modal response time distribution can be replaced by multiple unimodal distributions using trace-context analysis, in an industrial software system. Caller-context analysis or stack-context analysis is not able to resolve multi-modality in this case.
7
0.20 0.00
0.10
Probability density
0.004
0.008
0.012
Trace−context 1 Trace−context 3
0.000
Probability density
Appeared in S. Kounev, I. Gorton, and K. Sachs (eds.), Performance Evaluation - Metrics, Models and Benchmarks: Proceedings of the SPEC International Performance Evaluation Workshop 2008 (SIPEW ’08), volume 5119 of Lecture Notes in Computer Science, pages 283–302, Heidelberg. Springer. June 2008. The original publication is available at www.springerlink.com
200
300
400
500
65
Response time in microseconds
70
75
Response time in microseconds
(a) Probability density distribution for trace-context 1 and 3.
(b) Probability density distribution for trace-context 2.
Fig. 5. Trace-context analysis identified three trace-contexts for operation f .
The standard deviation corresponding to trace-context 1 is 53.83, for tracecontext 2 it is 2.20, and for stack-context 2 it is 49.74. Weighted by the calling frequency of the monitoring data, the average standard deviation for a tracecontext sensitive model is 35.94. This means that 73.66% of the standard deviation for the monitoring data of this operation can be removed using stack-context information. Hence, most of the dispersion in the response time distribution of this particular operation can be removed by making trace-context dependence explicit. In this case, the benefit in terms of removing standard deviation, is much higher for trace-context analysis than for stack- or caller-context analysis. To study this for all operations of a software system, Section 5 presents a quantitative analysis on how much standard deviation of operation response time distributions depends on which type of calling-context information for random partial instrumentations.
4
The Calling-context Tree
Using the same calling-context analysis detail for all operations of a system may uncover some undesired model properties (see Section 4.1). To overcome this, we present an additional step to find a more adequate context-sensitive timing behavior model than trace-context analysis alone would provide. This step consists of the representation of the results from caller-, stack-, and trace-context analysis in a tree (Section 4.2) and the application of tree modification operators (see Section 4.3). The application of these operators reduces the resulting number of calling-contexts and amount of calling-context information used to model the timing behavior of a system. 4.1
Undesired Calling-Context Analysis Results
The analysis presented in Section 3 may produce results with undesired properties:
8
Appeared in S. Kounev, I. Gorton, and K. Sachs (eds.), Performance Evaluation - Metrics, Models and Benchmarks: Proceedings of the SPEC International Performance Evaluation Workshop 2008 (SIPEW ’08), volume 5119 of Lecture Notes in Computer Science, pages 283–302, Heidelberg. Springer. June 2008. The original publication is available at www.springerlink.com
– Too many calling-contexts: The efficiency and feasibility of performance analysis methods may depend on the size of the timing behavior model. – Calling-contexts with an insufficient number of measurements: Many basic statistical methods require a minimum number of observations in order to provide robust results. – Calling-contexts may be distinguished that do not differ in their timing behavior distributions. – Trace-context analysis may be used in cases for that the computationally cheaper stack- or caller-contexts would produce an equal result. 4.2
Construction of the Calling-context Tree
To form a timing behavior model free of the undesired properties presented above, the results of all three calling-context analyses are connected within a tree, denoted calling-context tree (CCT). Moreover, the implication relationship between the three equivalence relations allows to organize the calling-contexts into a tree, denoted . An example of an CCT is illustrated in Figure 6. A callingcontext tree is constructed as follows: – The root of the calling-context tree is given by all observations monitored. – The nodes of the first level of the CCT represent calling-contexts for the observations corresponding to the software operation with the same name. – The nodes of the second level of the CCT represent the caller-contexts. Based on the callee’s operation name, each second level node is connected to its corresponding first level node. – The third CCT level is defined by stack-context equivalence. Each third level node is connected to its corresponding second level node. – The fourth level of the CCT is the partitioning defined by trace-context equivalence. Each trace-context node has an edge to its corresponding stackcontext node. A complete timing behavior model consists of any node subset of the CCT that is a complete partitioning of all monitored observations. For instance, each subset of all tree nodes that resulted from the same type of calling-context analysis is a complete partitioning, and hence, is a complete timing behavior model. A set of tree operators, described next, is applied to the tree to identify the node subset that both considers as much calling-context information as possible and is free of the undesired properties. 4.3
Modification of the Calling-context Tree
The maximum level of calling-context information would be included in the timing behavior model given by the nodes of the fourth layer of the CCT, i.e., the trace-contexts. However, this timing behavior model may have the undesired properties described in Section 4.1. We define three operators to the CCT tree leafs to remove the undesired properties:
9
Appeared in S. Kounev, I. Gorton, and K. Sachs (eds.), Performance Evaluation - Metrics, Models and Benchmarks: Proceedings of the SPEC International Performance Evaluation Workshop 2008 (SIPEW ’08), volume 5119 of Lecture Notes in Computer Science, pages 283–302, Heidelberg. Springer. June 2008. The original publication is available at www.springerlink.com
Monitored response times of all instrumented software operations
RT = [ ... ]
Partitioning based on operation name equality Partitioning based on caller−context equivalence Partitioning based on stack−context equivalence Partitioning based on trace−context equivalence
Fig. 6. The monitored operation response times of a system are partitioned according to their calling-contexts. The calling-context equivalence relations organize the monitored observations into a tree.
Leaf nodes without siblings are removed
Leaf nodes without a sufficient amount of observations are linked to an ancestor node
Leaf nodes with similar distribution characteristics are merged
Fig. 7. Node merging, removing, and linking to reduce the number of calling-contexts, avoid unrequired trace evaluations, and to have leaf nodes corresponding to a sufficient number of observations.
1. Leaf nodes that have no siblings are removed from the tree. The removal of leaf nodes reduces the size and computational costs for applying the callingcontext tree as performance model in some evaluations, e.g., when it is used as a reference model in anomaly detection or regression benchmarking. For instance, a trace-context node that has no siblings is removed, since it makes no sense to compute and evaluate the complete trace for trace-context analysis, while stack-context analysis already provide the same response time distributions for the corresponding operation calls. 2. Leaf nodes having similar response time distribution characteristics and that are siblings may be merged. Merging is performed until some stop criterion,
10
Appeared in S. Kounev, I. Gorton, and K. Sachs (eds.), Performance Evaluation - Metrics, Models and Benchmarks: Proceedings of the SPEC International Performance Evaluation Workshop 2008 (SIPEW ’08), volume 5119 of Lecture Notes in Computer Science, pages 283–302, Heidelberg. Springer. June 2008. The original publication is available at www.springerlink.com
such as that the number of leafs in the tree is equal or below a user-specified maximum number of timing behavior model entities. An alternative stop criterion is the absence of additional sufficiently similar merging candidates. Similarity is defined based on a user-defined similarity metric for probability distributions. Only nodes are merged that have enough observations to robustly determine the distribution similarity. 3. Nodes in the CCT without a sufficient number of observations are linked to an ancestor node that has a sufficient number of observations. The linking semantics is that all corresponding executions and response times of the linked node are used for the node that links to it. How many observations are sufficient depends on two aspects: the underlying probability distribution for the sample observations [9], and the statistical analysis that is to be performed in the subsequent performance evaluation. These three operators are repeatedly applied in random order to the CCT until no further applications of operator 1 and 3 are possible and a user-defined stop criterion for operator 2 is satisfied. An example for the application of the three operators is illustrated in Figure 7. The final context sensitive timing behavior model is given by the leaf nodes of the CCT. A detailed discussion of similarity metrics between response timing distributions is out of the scope of this paper. We used a distance metric based on interquartile-range and distribution median. These two metrics are considered more robust to characterize a distribution than the more common sample mean and standard variation, which are sensitive to extreme outliers. We experienced that few extremely large response times are not uncommon, especially for small software operations. This confirms to models that use log-normal distributions for response time data, which is for instance suggested by the research of Mielke [10] for end-to-end response times in Enterprise Resource Planning (ERP) systems.
5
Case Study
This case study explores the relation between the number of monitoring points and the number of resulting calling-contexts, and compares the calling-context specific response time distributions to the response time distributions without calling-context analysis. The most important empirical result of this analysis is that trace-context information is responsible for a significant part (20% to 40%) of the average standard deviation for the large majority of random partial instrumentations. Trace-context analysis outperforms stack-context and callercontext analysis that show relatively similar results. 5.1
Setting
The software system analyzed in the case study is the iBATIS JPetStore4 , which is a demo Java Web application implementing an online store scenario. The in4
http://ibatis.apache.org/
11
Appeared in S. Kounev, I. Gorton, and K. Sachs (eds.), Performance Evaluation - Metrics, Models and Benchmarks: Proceedings of the SPEC International Performance Evaluation Workshop 2008 (SIPEW ’08), volume 5119 of Lecture Notes in Computer Science, pages 283–302, Heidelberg. Springer. June 2008. The original publication is available at www.springerlink.com
strumentation to monitor response times of the internal operations of the JPetStore is given by the software instrumentation package Kieker [11]. The evaluation abstracts from the problem selecting monitoring points by evaluating more than 95,000 random partial instrumentations of the 2199 possible partial instrumentations. The traces and response times are taken from several fully instrumented experiment runs of 20 minutes. The first 3 minutes are considered the warm-up period and are ignored in the evaluation. The JPetStore is deployed in the Apache Tomcat Servlet container (version 5.5.23) running on a desktop computer equipped with an Intel Pentium 4 3.00 GHz hyper-threaded CPU and 1 GB physical memory and Linux 2.6.17.13. The application server software employs Sun Java SE 1.6.0 03. JPetStore uses a database management system (MySQL 5.0.18) for storing business data running on a GNU/Linux 2.6.15 system with two Intel Xeon 3.00 GHz CPUs and 2 GB of physical memory. The application server and the database back-end are connected via 100 Mbit Ethernet. A workload generator runs on a separate desktop computer being identically equipped and configured as the application server node above. The workload for the JPetStore is generated by the workload driver Apache JMeter 2.2 extended by our probabilistic workload driver Markov4JMeter [12]. This tool allows to emulate users based on an application model and a mix of corresponding probabilistic user behavior models. The think time between user requests is configured to be normally distributed. The number of concurrent users is set to 10, which can be handled without any problems by the system under monitoring. A detailed description of the workload can be found in van Hoorn et al. [12]. 5.2
Results
Table 1 outlines characteristics of the monitoring data collected during the experiment runs and the range of the number of caller-, stack-, and trace-contexts resulting from calling-context analysis. Table 1. Summary of case study characteristics Instrumentation # Instrumented Operations # Monitored Executions # Traces # Caller-contexts # Stack-contexts # Trace-contexts
Full (199 mon.pts.) 199 2,032,573 36,036 290 368 7021
Random 1–198 1–2,032,572 1–36,036 1–312 1–368 1–7021
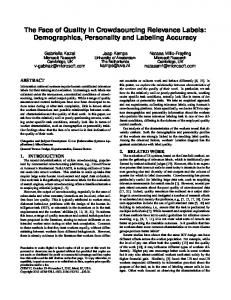
The number of resulting calling-contexts is illustrated in Figure 8 (1,500 samples of 95,000 plotted) in dependence to the number of monitoring points. The
12
8000 6000 4000 2000
Number of contexts
Trace−contexts Stack− and Caller−contexts
0
100
200
300
Stack−contexts Caller−contexts
0
Number of contexts
Appeared in S. Kounev, I. Gorton, and K. Sachs (eds.), Performance Evaluation - Metrics, Models and Benchmarks: Proceedings of the SPEC International Performance Evaluation Workshop 2008 (SIPEW ’08), volume 5119 of Lecture Notes in Computer Science, pages 283–302, Heidelberg. Springer. June 2008. The original publication is available at www.springerlink.com
0
50
100
150
200
0
Number of monitoring points
50
100
150
200
Number of monitoring points
(a)
(b)
Fig. 8. The number of monitoring points in relation to the number of contexts.
number of stack-contexts and caller-contexts both grow linearly with similar rates by the number of monitoring points, as shown in Figure 8(a). In most of the instrumentation scenarios (80%), the number of stack-contexts was larger than the number of caller-contexts for the same instrumentation. In contrast to the number of distinct stack- and trace-contexts, the number of caller-contexts is not at its maximum for full instrumentation. This demonstrates that adding monitoring points can reduce the number of caller-contexts. Figure 8(b) visualizes the numbers of trace-contexts resulting from the random instrumentation scenarios. The number of trace-contexts increases much faster than the number of stack-contexts and caller-contexts does. In general, the number of distinct calling-contexts tends to grow with the number of monitoring points. Adding a new monitoring point to an existing instrumentation also increases the number of trace-contexts and stack-contexts, while adding a monitoring point may reduce the number of caller-contexts. However, the fact that an instrumentation with n monitoring points has m callingcontexts does not imply that a second instrumentation with n0 > n monitoring points has more than m calling-contexts (in the same software system and for the same workload), since different monitoring points can increase the same numbers of calling-contexts differently. Response Time Distribution Variance Related to Calling-Context Information Figures 9(a) – 9(c) show the average standard deviation reduction in the timing behavior model resulting from caller-, stack-, and trace-context analysis. These diagrams show the distribution of this metric as boxplotted for bins of numbers of monitoring points. Figure 9(a) reveals that caller-context information corresponds to about 6.8% of average standard deviation of all response times in a fully instrumented experiment run. For less monitoring points, there is a larger uncertainty on how much average standard deviation could be removed by caller-context analysis. If half of the operations are instrumented, 75% of the instrumentations result in an average standard deviation isolation of more than 6.2%. For smaller numbers
13
10
30
50
70
90
110
130
150
170
40 30 20 10
Average relative st.dev. decrease in %
Mean
0
10
20
30
40
Mean
0
Average relative st.dev. decrease in %
Appeared in S. Kounev, I. Gorton, and K. Sachs (eds.), Performance Evaluation - Metrics, Models and Benchmarks: Proceedings of the SPEC International Performance Evaluation Workshop 2008 (SIPEW ’08), volume 5119 of Lecture Notes in Computer Science, pages 283–302, Heidelberg. Springer. June 2008. The original publication is available at www.springerlink.com
190
10
30
50
Number of monitoring points
50
70
90
110
130
150
170
110
130
150
170
190
190
50 20 10 5 0
Number of monitoring points
(c) Trace-context analysis.
Trace−context analysis Stack−context analysis Caller−context analysis 1st and 3rd quartile
2
Average relative st.dev. decrease in %
80 60 40 20
30
90
(b) Stack-context analysis.
Mean
0
Average relative st.dev. decrease in %
(a) Caller-context analysis.
10
70
Number of monitoring points
50
100
150
200
Number of monitoring points
(d) Comparison of median, 1st and 3rd quartile curves for each calling-context analysis type. (Window size 10 mon.pts., step-size 10 mon pts).
Fig. 9. Average decrease in standard deviation for different numbers of monitoring points using calling-context information compared to standard deviation using no calling-context information.
of monitoring points, a majority of instrumentations results in below 2% but the boxplot also shows a large number of outliers (observations above an upper whisker in a boxplot [13]) representing cases in which up to 45% percent of standard deviation can be removed. In summary, cases exist where caller-context analysis is very effective. The benefit of caller-context analysis to average standard deviation reduction is in most cases below 7%. Stack-context analysis (see Figure 9(b)) shows slightly more benefits than using caller-context analysis. For instance, for higher numbers of instrumented operations approx. 11% of the average standard deviation can be removed. Figure 9(c) shows that much more average standard deviation is connected to trace-context information than to the other calling-context types. For full instrumentation, trace-context analysis leads results in about 42% less average standard deviation in the trace-context sensitive response time distributions than using no calling-context information. For more than the half of the evaluated
14
Appeared in S. Kounev, I. Gorton, and K. Sachs (eds.), Performance Evaluation - Metrics, Models and Benchmarks: Proceedings of the SPEC International Performance Evaluation Workshop 2008 (SIPEW ’08), volume 5119 of Lecture Notes in Computer Science, pages 283–302, Heidelberg. Springer. June 2008. The original publication is available at www.springerlink.com
instrumentations with around 40 monitoring points, 40% of average standard deviation could be removed and only few instrumentations of that size were in the results that had less than 10% of average standard deviation reduction. This shows that a large part of the standard deviation of the monitored and evaluated scenarios is related to trace-context information. Figure 9(d) compares the amount of average standard deviation that can be removed by each of the calling-context types. It underlines that stack-context analysis performs slightly better than caller-context analysis, and that tracecontext analysis outperforms stack-context analysis and caller-context analysis. Trace-context analysis removes for most instrumentation scenarios, in particular for those with more than 25 monitoring points, more than 10% of the standard deviation. For most instrumentation scenarios with more than 50 monitoring points, more than 40% standard deviation decrease was observed.
50 20 10 5
Trace−context analysis Stack−context analysis Caller−context analysis 1st and 3rd quartile
2
Average relative st.dev. decrease in %
Figure 10 presents how much standard deviation is connected to the callingcontexts in dependence of the number of calling-contexts. Figure 10 reveals that trace-context information is connected to more calling-context information than the other two calling-context types. This means that it does not “just” provide more different equivalence classes for each monitoring point, but also defines calling-contexts that are connected to more average standard deviation than using caller-, or stack-context analysis.
0
50
100
150
200
250
Number of calling contexts
Fig. 10. Average decrease in standard deviation for different numbers of callingcontexts using calling-context information compared to standard deviation using no calling-context information. Comparison of Median, 1st and 3rd quartile curves for caller-, stack-, trace-context analysis. (Window size 10 contexts, step size 2 contexts).
15
Appeared in S. Kounev, I. Gorton, and K. Sachs (eds.), Performance Evaluation - Metrics, Models and Benchmarks: Proceedings of the SPEC International Performance Evaluation Workshop 2008 (SIPEW ’08), volume 5119 of Lecture Notes in Computer Science, pages 283–302, Heidelberg. Springer. June 2008. The original publication is available at www.springerlink.com
6
Discussion and Limitations
In the following, application issues and limitations related to continuous runtime behavior monitoring during regular operation in distributed software applications are discussed. 6.1
Monitoring Overhead
As discussed in the introduction, typical application scenarios are runtime QoS management and failure diagnosis based on anomaly detection, such as [14–16]. This requires continuous monitoring during regular operation of the software system. Therefore, the monitoring overhead should be reasonably low. It is our experience that imposing less than 20% overhead on response times and throughput is accepted by the industry in exchange for monitoring and supervision. A detailed discussion on monitoring overhead is not part of this paper. In the case studies using our instrumentation prototype Kieker, we observed an overhead on response times of below 15% for systems that consist of one execution environment. For distributed software systems, an additional overhead exists for remote communication. This results from the absence of a distributed clock that could be used to order executions within a sequence, and from the requirement to pass unique trace identifiers together with remote methods calls in order to distinguish multiple concurrent executions within the system. Kieker uses aspect-oriented programming (AOP), similar to the monitoring framework InfraRED, for which an overhead of about 10% was reported [17]. 6.2
Distributed Software Systems
Our monitoring infrastructure allows to trace execution paths through multiple execution environments for certain types of remote communication such as the Hessian Web Service protocol5 , which is for instance supported by the Spring Java EE application framework. Support for other remote communication methods, such as Remote Method Invocation, may be future work. The contextdependent profiling technique presented in this paper is limited to synchronous communication, i.e. a caller is blocked and waits until the callee returns a result. Traces with parallel asynchronous communication, are automatically split into multiple execution traces that only contain synchronous communication. Therefore, the calling-context analysis cannot benefit from correlations between timing behavior and the execution traces characteristics that are not within the sequence of synchronous communication. This limitation could be resolved by using an alternative monitoring approach, such as Briand et al. [18]. 6.3
Representativeness and Completeness of Monitoring Data
In our approach, timing behavior distributions and calling-contexts result from monitoring data. This results in the two major risks that the monitoring data is 5
http://hessian.caucho.com/
16
Appeared in S. Kounev, I. Gorton, and K. Sachs (eds.), Performance Evaluation - Metrics, Models and Benchmarks: Proceedings of the SPEC International Performance Evaluation Workshop 2008 (SIPEW ’08), volume 5119 of Lecture Notes in Computer Science, pages 283–302, Heidelberg. Springer. June 2008. The original publication is available at www.springerlink.com
not representative for normal behavior and that not all calling-contexts are detected. For instance, calling-contexts are missing if possible execution sequences were not activated during the monitoring period, which depends on the system workload. These risks can be minimized by using a sufficient amount of monitoring data from real system usage. For instance, for a typical online store, we consider few weeks of monitoring data to be sufficient for timing behavior anomaly detection. For the identification of calling-contexts, static (source code) analysis provides an alternative to monitoring data analysis, since it does not depend on system workload. Since the performance behavior of a software system changes over time (e.g., improving of algorithms, changes in user behavior, changes in hardware), it is required to update software performance models regularly. 6.4
Considering other Types of Calling-Context Information
This paper explored the correlation between operation response time distributions and operation execution sequences, represented as dynamic call trees. The results showed that especially trace-context information can be strongly connected to response time distribution characteristics. As mentioned before, trace-, stack- and caller-context analysis only consider a part of the calling-context, i.e. the set of circumstances or facts that surround an operation call. It has been suggested to also consider parameter values [19] or workload intensity [20] in timing behavior modeling. Additionally, the information provided on lower system layers, such as performance counter metrics on cache hits and on the number of context switches, are also often correlate to timing behavior. In this paper, these other types of calling-context information were not studied. It is not known, to what extend these are beneficial for considering in the analysis of response times in enterprise software systems. Furthermore, we did not address whether multiple object instances of the same class show different timing behavior. Considering these other types of calling-context information may be beneficial as well, and should be subject to future research.
7
Related Work
Related work comes from the domains of profiling and trace analysis, performance evaluation, online failure diagnosis, and performance prediction. There is much literature in the domain of software profiling that addresses to connect response time behavior to method calls and context information. Graham et al. [7] introduced the profiler gprof. Gprof provides caller-context information (i.e., makes caller-callee relations explicit). The trace-context analysis studied in this paper is an extension of the concept of caller-contexts. Most modern profiling tools, such as Intel’s VTune Performance Analyzer follow gprof by providing caller-context information (see Xie and Notkin [21]). Ammons et al. [6] go beyond the caller-callee relationship and introduces what we call stackcontext equivalence. We extend the concept of stack-context equivalence by using the complete sequence of operations for the definition of equivalence. These
17
Appeared in S. Kounev, I. Gorton, and K. Sachs (eds.), Performance Evaluation - Metrics, Models and Benchmarks: Proceedings of the SPEC International Performance Evaluation Workshop 2008 (SIPEW ’08), volume 5119 of Lecture Notes in Computer Science, pages 283–302, Heidelberg. Springer. June 2008. The original publication is available at www.springerlink.com
authors do not discuss the timing behavior distributions resulting from callingcontext analysis, which is a major focus of our paper. A more recent approach to evaluating runtime behavior in the context of execution traces is given by the work on monitoring trace representation of Hamou-Lhadj [22]. This approach and other trace analysis approaches, such as those surveyed by Hamou-Lhadj and Lethbridge [2], apply high levels of abstraction in order to achieve compact models for very large traces. The amount of preserved calling-context information of such trace models are at stack-context level or below (e.g., caller-context). Those techniques do not focus on combining trace-context analysis with timing behavior evaluation. Bulej et al. [4], report and analyze timing behavior clusters for two CORBA implementations in the context of regression benchmarking of different software versions. The k-means clustering approach is used to identify clusters in timing behavior measurements. In contrast to our approach, this does not require to connect single execution observations to traces, therefore the requirements on the monitoring infrastructure are lower than in our approach. Our approach uses the trace information as additional information, which allows the precise distinction of timing behavior classes (if there are correlations to the trace-contexts). The kmeans clustering approach is a heuristic that performs well, if the correct number of clusters is known in advance and the values of the clusters are well separated. Various approaches have been presented to use timing behavior monitoring data of software systems in order to implement preemptive quality of service management. For instance, in the Magpie project by Barham et al. [23] it has been motivated to correlate monitored events for specific requests to timing behavior measurements to identify anomalies and perform failure diagnosis. The Magpie approach shares the general idea of correlating monitored events within a request to timing behavior with our approach, but details on the correlation or empirical data have not been presented, so far. The performance modeling approach of Koziolek et al. [19] considers parameter values as part of usage profiles in order to increase performance prediction precision. Parameter values can also be considered calling-context information. The three calling-context types described in this paper are not part of Koziolek et al. [19]’s software performance model.
8
Conclusions
Summary This paper presents empirical data from a lab case study and from monitoring data of an industry system that both show that a large part of the standard deviation in software response time distributions can be related to calling-context information. This allows to conclude that using calling-context information can significantly improve timing behavior evaluations, such as those that depend on the variance of response time distributions. In this paper, we presented our approach to evaluating operation response time measurements in dependence to their calling-contexts. Our approach creates a trace-context sensitive timing behavior model from monitoring data. We in-
18
Appeared in S. Kounev, I. Gorton, and K. Sachs (eds.), Performance Evaluation - Metrics, Models and Benchmarks: Proceedings of the SPEC International Performance Evaluation Workshop 2008 (SIPEW ’08), volume 5119 of Lecture Notes in Computer Science, pages 283–302, Heidelberg. Springer. June 2008. The original publication is available at www.springerlink.com
troduced trace-context equivalence, which extends the concepts of caller-context equivalence and stack-context equivalence. In a second step, our approach organizes equivalence classes of monitored observations in a tree-structure to reduce the number of resulting calling-contexts and to remove unrequired distinctions of calling-contexts. Additionally, we demonstrated for monitoring data of a commercial telecommunication signaling system that multi-modal distributions can be removed from timing behavior models by trace-context analysis. Future work Currently, the approach requires the complete trace to be recorded before an estimation of a response time for an execution within the trace is possible. This is not necessarily a problem in failure diagnosis approaches such as anomaly detection, but in some cases it can be desirable to estimate the expected response times of a method before its execution. In that case, only a part of the full trace for that request is recorded. In contrast to using the full trace, a prefix could be used to estimate the future response time of the method currently executed. This information could be useful to organize scheduling in multi-user systems.
Acknowledgement We would like to acknowledge Nokia Siemens Networks Berlin, Business Service Solution for supporting this project.
References 1. Rohr, M., van Hoorn, A., Giesecke, S., Matevska, J., Hasselbring, W.: Tracecontext sensitive performance models from monitoring data of software-intensive systems. In: Workshop on Tools Infrastructures and Methodologies for the Evaluation of Research Systems (TIMERS’08) at IEEE International Symposium on Performance Analysis of Systems and Software. (April 2008) 2. Hamou-Lhadj, A., Lethbridge, T.C.: A survey of trace exploration tools and techniques. In: Conference of the Centre for Advanced Studies on Collaborative research CASCON’04, IBM Press (2004) 42–55 3. Jain, R.: The Art of Computer Systems Performance Analysis: Techniques for Experimental Design, Measurement, Simulation, and Modeling. 1st edn. John Wiley & Sons (April 1991) 4. Bulej, L., Kalibera, T., T˚ uma, P.: Repeated results analysis for middleware regression benchmarking. Performance Evaluation 60(1-4) (2005) 345–358 5. Arlitt, M.F., Krishnamurthy, D., Rolia, J.: Characterizing the scalability of a large web-based shopping system. ACM Transactions on Internet Technology 1(1) (2001) 44–69 6. Ammons, G., Ball, T., Larus, J.R.: Exploiting hardware performance counters with flow and context sensitive profiling. In: Conference on Programming Language Design and Implementation (PLDI’97), ACM (1997) 85–96 7. Graham, S.L., Kessler, P.B., McKusick, M.K.: gprof: a call graph execution profiler. SIGPLAN Notes 17(6) (1982) 120–126
19
Appeared in S. Kounev, I. Gorton, and K. Sachs (eds.), Performance Evaluation - Metrics, Models and Benchmarks: Proceedings of the SPEC International Performance Evaluation Workshop 2008 (SIPEW ’08), volume 5119 of Lecture Notes in Computer Science, pages 283–302, Heidelberg. Springer. June 2008. The original publication is available at www.springerlink.com
8. Object Management Group (OMG): Unified Modeling Language: Superstructure Version 2.1.1 (February 2007) 9. Barrett, J.P., Goldsmith, L.: When is n sufficiently large? The American Statistician 30(2) (May 1976) 67–70 10. Mielke, A.: Elements for response-time statistics in ERP transaction systems. Performance Evaluation 63(7) (July 2006) 635–653 11. Rohr, M., van Hoorn, A., Matevska, J., Sommer, N., Stoever, L., Giesecke, S., Hasselbring, W.: Kieker: Continuous monitoring and on demand visualization of Java software behavior. In: IASTED International Conference on Software Engineering 2008, ACTA Press (February 2008) 80–85 12. van Hoorn, A., Rohr, M., Hasselbring, W.: Generating probabilistic and intensityvarying workload for web-based software systems. In: SPEC International Performance Evaluation Workshop (SIPEW’08). Volume 5119 of LNCS., Springer (2008) 13. Montgomery, D.C., Runger, G.C.: Applied Statistics and Probability for Engineers. 3rd edn. John Wiley & Sons, Inc. (2003) 14. Duzbayev, N., Poernomo, I.: Runtime prediction of queued behaviour. In: 2nd International Conference on the Quality of Software Architectures (QoSA’06). Volume 4214 of LNCS., Springer (2006) 78–94 15. Diaconescu, A., Mos, A., Murphy, J.: Automatic performance management in component based software systems. In: First International Conference on Autonomic Computing (ICAC’04), IEEE (2004) 214–221 16. Agarwal, M.K., Appleby, K., Gupta, M., Kar, G., Neogi, A., Sailer, A.: Problem determination using dependency graphs and run-time behavior models. In: 15th IFIP/IEEE International Workshop on Distributed Systems: Operations and Management (DSOM’04). Volume 3278 of LNCS., Springer (2004) 171–182 17. Govindraj, K., Narayanan, S., Thomas, B., Nair, P., P, S.: On using AOP for Application Performance Management. In: AOSD 2006 - Industry Track Proceedings (Technical Report IAI-TR-2006-3, University of Bonn). (March 2006) 18–30 18. Briand, L.C., Labiche, Y., Leduc, J.: Toward the reverse engineering of UML sequence diagrams for distributed Java software. IEEE Transactions on Software Engineering 32(9) (September 2006) 642–663 19. Koziolek, H., Becker, S., Happe, J.: Predicting the Performance of Componentbased Software Architectures with different Usage Profiles. In: 3rd International Conference on the Quality of Software Architectures (QoSA’07). Volume 4880 of LNCS., Springer (2008) 145–163 20. Rohr, M., Giesecke, S., Hasselbring, W.: Timing Behavior Anomaly Detection in Enterprise Information Systems. In: 9th International Conference on Enterprise Information Systems (ICEIS’07). INSTICC Press (June 2007) 494–497 21. Xie, T., Notkin, D.: An empirical study of Java dynamic call graph extractors. Technical Report UW-CSE-02-12-03, University of Washington Department of Computer Science and Engineering, Seattle, WA, USA (December 2002) 22. Hamou-Lhadj, A.: Techniques to Simplify the Analysis of Execution Traces for Program Comprehension. PhD thesis, Ottawa-Carleton Institute for Computer Science, School of Information Technology and Engineering (SITE), University of Ottawa (2005) 23. Barham, P., Isaacs, R., Mortier, R., Narayanan, D.: Magpie: online modelling and performance-aware systems. In: 9th Conference on Hot Topics in Operating Systems (HOTOS’03), USENIX Association (2003) 15–15
20