Raymond Matthew Flynn1, Pierre-André Schnegg2, German Mallèn3 and Pierre ... wells in an unconfined gravel aquifer demonstrated that prolonged tailing ...
GROUNDWATER FLOW Understanding local to regional scales XXXIII Congress IAH & 7° Congress ALHSUD Zacatecas, México 2004 ISBN 970-32-1749-4
TRACER TEST MONITORING USING WELLS WITH LONG SCREENED INTERVALS: BENEFITS AND DISADVANTAGES Raymond Matthew Flynn1, Pierre-André Schnegg2, German Mallèn3 and Pierre Perrochet1 1. Hydrogeology Centre, University of Neuchâtel, Emile Argand, 11, CH-2007, Neuchâtel Switzerland 2. Geomagnetism Group, University of Neuchâtel, corresponding author 3. GSF, Hydrology Section, Ingoldstäter Landstrasse 1, D –85764 Neuherberg, Germany
Abstract. Analytical and economic limitations often make fully-penetrating wells an attractive alternative for monitoring tracer test responses in aquifers. Modelling of breakthrough curves generated using long-screened (LS) wells in an unconfined gravel aquifer demonstrated that prolonged tailing could be reproduced with a series of partial breakthrough curves. The results suggested tracer arrived at multiple horizons. Subsequent measurements using a mobile downhole fluorometer demonstrated over 95% of tracer arrival occurred over a 2m depth interval. Simulations of complimentary single-well dilution test results, incorporating vertical flow measurements, indicated that tracer arrival occurred in a zone no thicker than 50cm before being transferred to a shallower level in the aquifer via the well. The probability of encountering this tracer-bearing horizon by installing four 1m long piezometers was approximately 1 in 2. The results highlight the importance of appropriate conceptual models and potential benefits/disadvantages faced by the hydrogeologist when dealing with LS wells in tracer tests. Keywords: Porous aquifer, well screen, tracer, breakthrough curve, downhole fluorometer, piezometer nest.
INTRODUCTION Tracer testing using solutes provides an important means of understanding mass transport processes in aquifers (Käss, 1998). However, this technique is not widely applied due, in part, to the heavy financial commitments associated with installation of groundwater monitoring points. The multi-level sampling instrumentation, often used to carry out detailed monitoring in thick sequences of aquifer material, can be expensive (Lerner et al., 1995), and may fail to sample the entire saturated thickness of the aquifer. This is particularly the case where piezometer nests are employed in a single hole and must be hydraulically isolated from one another, thus blocking off intervals to sampling. Moreover, sampling using multiple-level systems can place considerable strain on limited analytical resources and can constrain the number of samples analysed from each monitoring point. Wells/boreholes with long intervals exposed to an aquifer offer a more inexpensive means of monitoring conditions in groundwater, while potentially sampling a larger proportion of the saturated thickness. Unfortunately, monitoring tracer concentrations in groundwater at these points frequently fails to identify the horizons at which tracer arrival occurs and can result in significant mixing, since concentrations may be measured over the entire thickness of the well (Hutchins and Acree (2000)). This article describes the results of tracer tests that used long-screened wells for tracer test monitoring with particular emphasis on the significance of results obtained using a mobile downhole fluorometer and potential implications for using this type of monitoring point. Site Setting / Methodology A series of three tracer tests carried out at the Dornach test site, near Munich, Germany (Figure 1) investigated solute mass transport in a 12m sequence of heterogeneous unconfined saturated fluvioglacial gravels. Concentrations of Uranin (sodium fluorescein), injected into a fully penetrating two-inch internal diameter (ID) injection well (B1), were monitored in an eight-inch ID fully penetrating observation well 10 metres down gradient (B8) in all tests. Monitoring was carried out over a 24 hour period during all tests. This period was sufficient for the tracer peak concentration to pass and levels to return to 5% of the maximum concentration observed. (Previous tests carried out over 48 hours generated similar results and failed to detect subsequent secondary peaks in the breakthrough curve).
1
GROUNDWATER FLOW Understanding local to regional scales XXXIII Congress IAH & 7° Congress ALHSUD Zacatecas, México 2004 ISBN 970-32-1749-4
A series of three different tests were carried out as follows: 1. Fully well recirculation test: Monitoring in B8 during an initial series of experiments employed recirculation methods, where the water was pumped from the base of the well and passed through an online fluorometer, before being reinjected at the water table. 2. Low flow sampling test: A second set of tests monitored tracer concentrations in observation well B8 following injection at B1, using low flow techniques. Pumps set at four depths, using pumping rates that collectively induced less than 1cm of drawdown, discharged water to the surface where Uranin Figure 1: Site location map / geological cross-section, concentrations were monitored onDornach Test Site, Germany. Note fully penetrating line. injection and observation wells. 3. Downhole fluorometer monitoring: A third series of tests employed a mobile downhole fluorometer (Figure 2) to monitor the Uranin concentration profiles in B8 at 10 cm intervals following injection in B1. Complimentary single-well tracer dilution testing and vertical flow testing completed in the observation well, also using the downhole fluorometer experiments, permitted well water flow regime in B8 to be characterised. A discretised mass-balance numerical model, accounting for the vertical flow regime in the well, was used to ascertain the horizontal flux entering the well by reproducing the tracer concentration profile observed in the single-well dilution tests. RESULTS AND INTERPRETATION The long tailing observed in the breakthrough curve generated at B8 during the whole well recirculation test could not be adequately modelled using a single advective-dispersive term (Figure 3). However, fitting the data using three partial breakthrough curves (Maloszewski, (1992) provided a satisfactory fit suggesting that the tracer arrived at the well through different horizons with variable groundwater velocities. This interpretation was consistent with granulometric analyses that indicated that hydraulic conductivities could vary by over two orders of magnitude in the aquifer (Klotz et al, 1980). Similarly, monitoring during lowflow testing indicated a depth-variable tracer response. Monitoring failed to detect tracer in groundwater close to the base of the aquifer at 14 metres below ground surface (mBGS), whereas concentrations were highest at the sampling point 2m closer to the surface at 12mBGS. Similarly, tracer was not detected at 8.5mBGS, but was encountered in low concentrations in the shallowest sampling point (5.5mBGS). Figure 2 : Two-inch downhole flow-through field fluorometer.
The results of downhole fluorometer testing demonstrated that the highest tracer concentrations were observed in a zone approximately two metres thick between 10 and 12 mBGS. Moreover, maximum concentrations were consistently highest at approximately 12mBGS throughout the tracing tests. Additional tracer arrivals were noted in a thin zone at approximately 5.5 mBGS, where concentrations were more an order of magnitude lower than those observed at depth. However, the contribution made by this horizon had an insignificant influence on the depth 2
GROUNDWATER FLOW Understanding local to regional scales XXXIII Congress IAH & 7° Congress ALHSUD Zacatecas, México 2004 ISBN 970-32-1749-4
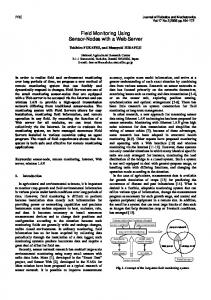
integrated tracer breakthrough curve. No tracer was observed at other depths in the well. The occurrence of Uranin observed using the downhole fluorometer is consistent with the results of the low-flow sampling test. The results of the tracer test using the downhole fluorometer indicated that over 95% of the tracer observed in B8 occurred in the 10-12 mBGS zone. Figure 3: Tracer breakthrough curve observed in B8 using whole well recirculation method. Solid lines Observed response (bold) and Composite partial breakthrough curve (light), Grey dotted line - Best fit single solution, Dotted black lines – Individual partial breakthrough curves.
The results of numerical modelling of single well tracer dilution profile (Figure 4a, 4b) indicate that once the vertical flow regime is accounted for, the tracer observed in this zone was derived from a zone that could be no thicker than 50cm. Simulations of tracer arrival in the well in this zone, using the vertical and horizontal specific fluxes determined for the single well dilution model adequately reproduced the tracer arrivals observed in B8 (Figure 4c). DISCUSSION
The results of the three tests carried out at Dornach illustrate that tracer was not transported between the injection well and the observation well in a uniform Uranine Uranine GroundwaterVelocity manner. The prolonged tailing observed in the (C/Co) (C/Co) (m/day) breakthrough curve generated during the full well 0 0.2 0.4 0.6 0.8 1.0 0 50 100 150 200 0 0.2 0.4 0.6 0.8 1.0 4.5 4.0 4.0 recirculation test suggested that the tracer arrived in the observation well via a number of different horizons (a) (b) (c) where it was transported under varying hydrodynamic 6.0 6.5 6.0 conditions. Indeed this is consistent with the very good model fit generated using partial breakthrough curve, as observed in Figure 3, and the differing tracer D responses observed at different depths during low flow 8.5 8.0 E 8.0 P sampling. Nonetheless, the results of the tests using the T downhole fluorometer demonstrate that tracer arrival is H overwhelmingly dominated by a thin horizon of (m) 10.0 10.5 10.0 preferential tracer transport, and that arrivals via other horizons are insignificant. This result emphasises the importance of an appropriate conceptual model 12.5 12.0 12.0 selection prior to carrying out numerical modelling of tracer transport. Observed Data Entering Observed Data 14.0
Simulated Data
14.5
Exiting
14.0
Simulated Data
Mass balance modelling of tracer dilution in B8 indicates that the zone transporting tracer to the observation well is estimated to be no thicker than 1/24 Figure 4: Tracer response measured using mobile of the total saturated thickness of the sequence at the downhole fluorometer. (a) Modelled and observed Dornach test site. Water entering the well through this single well dilution test results. (b) Horizontal specific horizon at 12 mBGS flows upwards in the well, where flux rates entering and exiting B8. (c) Observed and simulated tracer arrivals. it is mixed with tracer-free water before discharging back into the aquifer at 10 mBGS. The data are consistent with the observations of Elci et al.(2001) who remarked on the unreliability of open wells as sampling points, and the possibility of spreading contamination to adjacent horizons via wells screened against adjacent horizons with lower heads. On the other hand, it is noteworthy that the zone supplying the tracer to B8 occupies a very small proportion of the saturated thickness at Dornach. The chance of encountering this zone, if four one-metre long piezometers were installed, instead of the fully penetrating 3
GROUNDWATER FLOW Understanding local to regional scales XXXIII Congress IAH & 7° Congress ALHSUD Zacatecas, México 2004 ISBN 970-32-1749-4
well, is approximately one in two. This result highlights the importance of identifying potential preferential transport zones during the initial site investigation /well installation phase of a tracer study as a means of determining monitoring well installation depths if multiple level samplers are to be installed. However, in a study of vertical gradients in sand and gravel deposits, Church and Granato(1996) remarked that the preferential flow zones supplying water may be indistinguishable from adjacent horizons. Overall, the results of this series of experiments highlight the dilemmas faced by groundwater researchers wishing to carry out tracer tests, and the fact that installations employing costly multi-level sampling systems may not necessarily be the most beneficial utilisation of scarce resources. References Church PE and Granato GE 1996. Bias in groundwater data caused by well-bore flow in long-screen wells. Ground Water, 34, 262-273. Elci A, Moltz FJ and Waldrop WR 2001. Implications of observed and simulated ambient flow in monitoring wells. Ground Water, 39, 853-862. Käss W 1998. Tracing technique in geohydrology, A.A.Balkema, Rotterdam. Klotz D, Seiler, KP, Moser H and Neumaier F 1980. Dispersivity and velocity relationship from laboratory and field experiments. Journal of Hydrology, 45, 619-641. Lerner D and Teutsch G 1995. Recommendations for level-determined sampling in wells. Journal of Hydrology, 171, 355-377. Maloszewski P 1992. Mathematical modelling of tracer transport in different aquifers: Results from ATH test fields. In Hoetzl H and Werner A (eds.), Proc. 6th Int. Symp. Water Tracing Conference, Karlsruhe. Balkema, Rotterdam, 25-30.
4