SUT are recorded and later used as a golden run oracle to compare executions ..... for all tests is 45 seconds, excluding boot and setup time. In addition to the ...
T R EK ER: Tracing Error Propagation in Operating System Kernels Nicolas Coppik, Oliver Schwahn, Stefan Winter, Neeraj Suri DEEDS Group, TU Darmstadt Darmstadt, Germany {nc, os, sw, suri}@cs.tu-darmstadt.de
Abstract—Modern operating systems (OSs) consist of numerous interacting components, many of which are developed and maintained independently of one another. In monolithic systems, the boundaries of and interfaces between such components are not strictly enforced at runtime. Therefore, faults in individual components may directly affect other parts of the system in various ways. Software fault injection (SFI) is a testing technique to assess the resilience of a software system in the presence of faulty components. Unfortunately, SFI tests of OSs are inconclusive if they do not lead to observable failures, as corruptions of the internal software state may not be visible at its interfaces and, yet, affect the subsequent execution of the OS beyond the duration of the test. In this paper we present T R EK ER, a fully automated approach for identifying how faulty OS components affect other parts of the system. T R EK ER combines static and dynamic analyses to achieve efficient tracing on the granularity of memory accesses. We demonstrate T R EK ER’s ability to support SFI oracles by accurately tracing the effects of faults injected into three widely used Linux kernel modules. Index Terms—Software Fault Injection, Robustness Testing, Test Oracles, Execution Tracing, Operating Systems
for mutation testing, but commonly based on different assumptions regarding the types and distributions of the introduced faults (see [5], [6] for an overview of common fault assumptions in either application). After the injection, interactions between the SUT and the injection target are triggered by a test workload. To assess error propagation from the injection target to the SUT, the behavior of the SUT is observed while it is processing the workload to identify behavioral deviations in response to the injection. Unfortunately, oracles of this type are generally insufficient to make any conclusions whenever no such behavioral deviations are observed. In such cases it is unknown whether the fault (1) has not been activated, (2) has been activated, but its effects have not propagated to the user interface, or (3) does generally not affect the system behavior. While the first case can be identified by additional code that logs the activation of injected faults, disinguishing the latter two requires introspection of the system during test execution. SFI test frameworks commonly use execution trace comparisons across setups with and without injected faults as a secondary oracle to distinguish between these cases [2], [7], [8].
I. I NTRODUCTION Complex modern software systems1 generally consist of many interacting components. In larger systems, these components may be developed or maintained by different teams of developers and may differ in numerous aspects, including code quality and the amount of residual faults. In order to assess the resilience of the overall system, it is necessary to understand how it is affected by individual faulty components, a condition named error propagation in the Laprie taxonomy [1]. For this purpose, software fault injection (SFI), the deliberate introduction of faults in specific components to simulate their behavior in the presence of residual software faults, is an established approach [2]–[4]. In SFI tests, the system under test (SUT) is exposed to erroneous behavior of a component it is interacting with, the injection target. These fault injections are similar to mutations c 2017 IEEE. Personal use of this material is permitted. Permission from
IEEE must be obtained for all other uses, in any current or future media, including reprinting/republishing this material for advertising or promotional purposes, creating new collective works, for resale or redistribution to servers or lists, or reuse of any copyrighted component of this work in other works. 1 We will refer to software systems in the sense of software compositions from separately developed and compilable modules as “systems” in the following.
A. The SFI Oracle Problem for OSs While the usage of execution traces alleviates the aforementioned oracle problem, it is challenging for an important class of SUTs: Operating system (OS) kernel components, because all kernel components are interacting within the same address space and with the same privileges. Without memory protection between kernel components all memory is shared and directly accessible via pointers. This makes every memory operation in the system a potential cross-component interaction affecting the SUT that needs to be traced. Existing memory tracing approaches for user space applications (e.g., using Valgrind [9] or Pin [10]) are not applicable for OS kernels. Existing tracing approaches for OS kernels (e.g., SystemTap [11] or LTTng [12]), on the other hand, only provide tracing on the granularity of function calls instead of individual memory accesses. A na¨ıve tracing of all memory operations is infeasible, as the kernel code base is large and some parts, such as hardware interrupt handling routines, are performance critical. B. T R EK ER: Solving the SFI Oracle Problem To correctly identify and characterize the effects of residual software faults in kernel components, we present T R EK ER,
a scalable, fully automated approach for T Racing Error propagation in operating system K ERnels that relies on a combination of static and dynamic analyses to infer error propagation from a faulty kernel component to other parts of the kernel. T R EK ER limits the trace points to the injection target and infers error propagation from deviations in the injection target’s state and behavior that are visible to other parts of the kernel, thereby effectively improving the soundness of SFI tests for OSs at the cost of execution time overheads for trace collection and analysis. We demonstrate T R EK ER’s ability to trace the effects of faults in three widely used kernel components on the Linux kernel. We find that up to ∼10 % of seemingly successful runs in our fault injection experiments would be misclassified by conventional oracles. The remainder of the paper is organized as follows: Section II gives an overview over related work. Our proposed approach is detailed in Section III. We discuss T R EK ER’s implementation in Section IV and the experimental analysis in Section V. Concluding remarks can be found in Section VI.
used for execution tracing in SFI tests. As T R EK ER instruments kernel code during compilation, it is independent from kernel modules that need to co-evolve with changing kernel interfaces. In this respect it differs from the work of Feiner et al. [22] or Kedia et al. [24]. Moreover, approaches based on binary translation only work for a specific hardware architecture and require adjustment for others. PinOS [21], for instance, is limited to IA-32. The applicability of T R EK ER, in contrast, is not limited to any specific OS kernel or hardware architecture, as long as the instrumentation target can be compiled for that architecture with Clang/LLVM. As both PinOS and DECAF [23], [25] rely on virtualization, they cannot be applied for hardware-specific kernel code, such as device drivers, if that hardware cannot be emulated by the underlying hypervisors. B. Oracles for Kernel-Level SFI Tests
Due to the SUT/architecture specificity of available kernel tracing tools, SFI tests for these SUTs commonly employ other, less accurate oracles. Koopman et al. have introduced a classification of OS II. R ELATED W ORK failure modes that they consider relevant and implemented To classify the results of SFI tests on kernel code, T R EK ER corresponding detectors in the Ballista project [26]. Their traces the effects of injected software faults in OS kernels. We classification comprises five different failure modes, collectively discuss existing trace-based approaches for user mode software referred to as the “CRASH scale”, where each letter of the in Section II-A, alternative approaches for kernel-level SFI acronym stands for a failure mode. Catastrophic failures are failures that render the entire system unusable, e.g., kernel tests in Section II-B and trace comparison in Section II-C. panics. Restart failures denote cases where the OS silently A. Execution Trace Based Oracles for User Mode Software stops serving requests made by the executing test case. Cases where the OS detects a problem and notifies the executing Execution tracing has been widely adopted to determine the test (e.g., by signaling a segmentation fault) are called Abort outcome of SFI tests [2], [6]–[8], [13]–[16], similar to our failures. Silent failures denote the violation of the kernel’s motivation for T R EK ER. Execution traces of the unmodified specified behavior without corresponding notification to the SUT are recorded and later used as a golden run oracle to executing test. Hindering failures, on the other hand, are failures compare executions with injected faults against. To record that mislead debugging efforts, e.g., by returning a wrong error execution traces, three different techniques are used. code. Arguing that these are the most critical failure classes, One class of approaches (e.g., [13], [14], [16]) uses deBallista and similar approaches to OS robustness testing limit buggers to record execution traces. This imposes execution their oracles to the detection of the first three classes of the latencies that are not tolerable by most SUTs, among them CRASH scale [27]–[31]. OS kernels targeted by our work. Interrupt service routines, T R EK ER focuses on the detection of silent or “non-crashing” for instance, need to have short response times and exceeding failures, such as silent data corruption (SDC), which constitute those may result in unintended OS failures during test. A second class of approaches (e.g., [17], [18]) uses full- a significant threat to reliability [32]–[35] and have been mostly system simulation for execution tracing. Full-system simulators ignored by existing work on OS level SFI tests. The reliable implement the semantics of low-level hardware operations detection of restart failures requires kernel execution traces for a given platform in software. The SUT is executed on containing every single executed instruction. While T R EK ER this simulated hardware model. Although the simulation of is capable of implementing such a tracing policy, the required every single hardware operation in software imposes massive heavy-weight instrumentation may result in performance degraexecution time overheads, this is not observable by the SUT. dation similar to the approaches discussed in Section II-A. We, Any latencies observable by the SUT are based on the simulated therefore, limit the scope of our approach to the detection of hardware timer. Therefore, full-system simulators are generally error propagation in the case of terminating test executions and suitable for tracing OS kernel executions, but massively impair employ existing timeout-based detectors for restart failures. test throughput due to the simulation overhead. While a number of tools (e.g. SystemTap [11] and LTTng The third class of approaches (e.g., [7], [19]) relies on [12]) exist to trace the execution of OS kernel code using dynamic binary instrumentation/translation (DBI/T), e.g., using probes (cf. [36], [37] for SFI tracing), they are only capable Pin [10] or Valgrind [20]. Similar approaches have been of tracing function invocations and not individual memory developed for OS kernels [21]–[24], but none of them has been accesses. To identify how faults affect SUT state, i.e., the data
the SUT operates on, T R EK ER selectively instruments memory operations that are invisible to these tools. C. Trace Comparison To detect error propagation, T R EK ER compares traces of executions with injected faults to golden run traces of the unmodified SUT. Trace comparison is also commonly used for fault localization. Wong et al. give an extensive overview [38]. Such approaches typically compare traces of the same version of the SUT with different inputs to identify the root causes of behavioral divergences. Therefore, they are not directly applicable to the scenario targeted by T R EK ER. III. S YSTEM M ODEL We propose an approach for identifying how faults in components in a monolithic operating system affect the rest of the system. To that end, this section starts with a brief overview of the underlying fault taxonomy, followed by a discussion of the systems we consider and their component interactions. A. Faults and their Consequences As hinted at in Section I, we follow the Laprie taxonomy [1]. Any system or system component2 is assumed to implement a system function according to a functional specification. The system implements the system function as a sequence of states. The fraction of a system state that is perceivable at the system’s interface is called the external state. The sequence of external states implementing the system function is referred to as service and the deviation of service from the functional specification is called a failure. The deviation of an external state in the sequence that constitutes the service may be caused by a prior deviation of the system’s internal state that is invisible at the interface from a correct implementation of the system function. Such a deviation of the system state is called an error. The cause of an error is termed as a fault. By these definitions, a fault is “something that possibly leads to an error”, an error “something that possibly leads to a failure”, and a failure “a deviation of observed behavior from specified behavior.” When a fault causes an error, this is referred to as fault activation, and the effect an error has on subsequent system states is called error propagation. B. Monolithic Operating Systems and Composition We assume that monolithic operating systems consist of (a) a core part which provides essential functionality and is, therefore, always necessarily present and (b) an arbitrary number of modules implementing additional functionality. Modules can interact with one another or the core kernel through function calls, thereby exchanging information via parameters and return values. Furthermore, the system does not enforce any memory isolation between its components. All modules and the core kernel share the same memory address space and can, in theory, freely access and modify each others’ 2 We mean “system or system component” whenever we refer to “system” in this subsection.
data structures. Finally, modules can also access and modify any global data structures in the system. Although the implementation we describe in Section IV utilizes runtime loading and unloading of kernel modules, the fundamental approach described here does not conceptually rely on the availability of this functionality. Due to the lack of runtime isolation or protection mechanisms, a faulty module can affect other modules or the core kernel in a variety of ways. In particular, tracing mechanisms that only consider parameters and return values of function calls cannot capture differences in communication through shared memory. However, due to the aforementioned lack of isolation, distinguishing between memory accesses that constitute potential shared memory communication, particularly write accesses by a faulty component, and those that do not is usually not straightforward without examining the entirety of all other modules and the core kernel. However, the result of such an analysis would be dependent on the particular modules present in the system in question and changes to this configuration might well yield different results. Therefore, we limit our analysis to the faulty component itself and analyze which fraction of its state can be expected to be accessible by any other component in the system, independent from the actual system configuration. We denote this fraction of expected externally visible behavior as the component’s interface. The interface includes parameters of function calls from and return values of function calls to the component as well as memory accesses to locations that can reasonably be assumed to be used for transmitting data to other components via shared memory. We detail in the following what we do and do not consider such interface relevant memory accesses within a component targeted by our analysis. Read accesses are not generally considered part of the component interface. If the value that is read was previously written by the faulty module itself, the read access clearly does not constitute external communication. If, on the other hand, the value was written by another module, we do not consider the read access itself to be behavior visible to other components: While a faulty module may attempt to read from the wrong address, resulting in an unexpected value, this does not directly result in externally visible differences in behavior. Cases where it has indirect influence (for instance, if the faulty module proceeds to use the wrong value as a function parameter) will be captured under our notion of interface at the point where the behavior in question becomes externally visible. Local write accesses are store operations to addresses that are not known to any components other than the faulty one. Most notably, this includes accesses to stack-allocated local variables unless their address is passed to another component (either directly, e.g., as a function parameter or implicitly by writing it to another externally visible memory location). Access to regions of memory that are allocated and freed without ever being referenced in an externally visible manner (that is, as with stack addresses, passed to external functions or written to externally visible addresses) in between also fall into this category. Such accesses are not considered externally visible
@global = global i32 0
int global = 0;
void c_foo(int* x) { int a = 1; e_bar(&a); }
1
void e_bar(int* y); { ... }
void c_baz(int* z) { int c = 2; *z = c; global = c; }
2 3
define void @c_foo(int*)(i32*) { %2 = alloca i32* %3 = alloca i32 store i32* %0, i32** %2 store i32 1, i32* %3 call void @e_bar(int*)(i32* %3) ret void }
define void @c_baz(int*)(i32*) { %2 = alloca i32* %3 = alloca i32 store i32* %0, i32** %2 store i32 2, i32* %3 %4 = load i32, i32* %3 %5 = load i32*, i32** %2 store i32 %4, i32* %5 %6 = load i32, i32* %3 store i32 %6, i32* @global ret void }
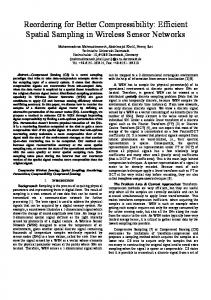
Fig. 1. Three different cases in which write accesses can be externally visible, in C and (simplified) LLVM IR.
for the purposes of our analysis and are therefore not deemed part of the component interface. Externally visible write accesses are store operations to addresses that are known to components other than the faulty one. This includes all addresses that are passed to the module from another component, for instance as a parameter or return value, as well as globals and addresses belonging to memory that has been allocated by the module itself but then communicated to other components. As mentioned above, it also includes all memory addresses that are reachable by following pointers from another externally visible address. Of these three categories, the one most relevant for our analysis is the last one, externally visible write accesses. We distinguish between three different cases of external visibility of write accesses: 1) Writes to an address that the component passes to another component or to addresses that are reachable from such an address; 2) Writes to an address that was passed to the component by another component or to addresses that are reachable from such an address; 3) Writes to global variables or to addresses that are reachable from a global variable. These three cases are illustrated in Figure 1. In the first case, a function in the component (c_foo) writes to a variable (a) and then passes the address of that variable to an external function (e_bar). Should the external function dereference that address, the result of the written value would be accessible to it. Note that we do not inspect whether such an access actually occurs, we just check whether it is possible. In the second case, a function in the component (c_baz) has received a pointer (z) as an argument and writes to that address. If the caller of c_baz is an external function (e.g., e_bar), that write access is visible to that caller. In the final case, a function in the component writes to a global variable (global). In all of these examples, the external visibility of the stores in question is fairly straightforward to recognize, requiring at most one pointer dereference. However, more complicated
cases exist, for which we introduce the following notion of reachability: An address p is directly reachable from an address q if p is stored at q (i.e. *q = p) or q is the base address of a data structure (e.g., an array or struct) and p is the address of a member of that data structure (e.g., p = &(q->foo)). An address p is indirectly reachable from an address q if there is an address r such that p is directly reachable from r and r is reachable (directly or indirectly) from q. We consider the externally visible behavior of a component at its interface with the rest of the operating system to consist of the values of parameters passed to functions outside the component, the values returned to callers outside the component, the externally visible memory addresses it writes to and the values it writes to them. Error propagation occurs when a faulty component exhibits externally visible behavior that a fault-free version of the same component will never exhibit under the same workload. IV. T R EK ER : T RACING E RROR P ROPAGATION IN OS K ERNELS The implementation work required to realize our proposed approach comprises two essential parts: An instrumentation tool capable of gathering the information required to fully capture the externally visible behavior of a target component and an analysis tool to perform the filtering and transformations required to distinguish between the cases described in Section III. We describe these parts in Section IV-A and Section IV-B, respectively. Trace comparison is described in Section IV-C. A. Component Interface Identification and Instrumentation The purpose of the instrumentation phase is to gather all the information required to reconstruct an accurate model of the externally visible behavior of the target component. To that end, it needs to capture the addresses and values of memory accesses as well as function calls, parameters and return values. Function call instrumentation needs to be performed both on the caller side, when the target component calls functions in other components, as well as the callee side, when other components invoke functions of the target component. In order to avoid limiting T R EK ER to a specific OS or architecture, we have decided to implement compile time instrumentation as an LLVM [39] optimization pass, allowing us to support native execution on a various different architectures. As an LLVM optimization pass, the instrumentation step operates on LLVM IR, a Static Single Assignment (SSA) representation. Unlike x86 assembly, only a small number of LLVM instructions operate on memory, most notably the load and store instructions. In addition to the memory accesses themselves, the instrumentation also needs to capture accesses to fields of data structures, or more specifically the computation of their addresses based on the base address of the data structure. In LLVM, this is typically modeled by the getelementptr instruction. Furthermore, the instrumentation should capture basic tracing information, such as function entry and exit, arguments and
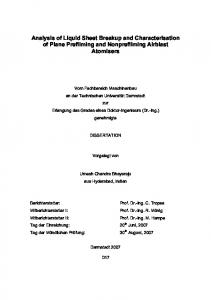
return values. Therefore, it also handles function calls (caller1) Reachability: We have introduced a notion of reachability side), function entry and function exit (callee-side). that incorporates both reachability through pointers as well as Finally, T R EK ER is designed to handle kernel code, ne- through access to member fields of data structures in Section III. cessitating a way to instrument inline assembly which is Our implementation of reachability analysis applies this notion common in operating systems code. Attempting to parse and to individual execution traces. First, we split the trace by process inline assembly directly suffers from many of the same dynamic function calls. For each function call, we extract drawbacks that make binary instrumentation an unattractive the caller, arguments, return value and called functions. For choice for kernel tracing, including lack of portability across calls to internal functions, we additionally extract the trace different architectures and significant added complexity. In entries generated during that function call. This results in a practice, however, inline assembly is usually specified using tree structure in which nodes represent dynamic instances of extended inline assembly syntax. Such extended inline assembly function calls and edges represent a caller-callee relationship. statements take a list of input and output variables and clobbers. Next, we perform the aforementioned reachability analysis The instrumentation can rely on these arguments and constraints for each of the three different cases in which stores performed to extract which memory addresses may be read from or written by the instrumented component may be externally visible. to by the inline assembly without parsing it directly. Based on For the first case, writes in the component that are reachable this information, instrumentation can be performed as it would from arguments passed to an external function, we first identify be for load or store instructions. each node representing a call to an external function taking at For each of the instrumentation points identified above, least one pointer argument in the aforementioned tree. Then, the instrumentation pass inserts a function call with the first for each such node, we iterate backwards over the preceding argument indicating its type. The subsequent arguments differ trace entries until we encounter another node representing an for the different types of instrumentation points. In addition to external function call. During this traversal, we build up a memory addresses and values, the information passed to the separate graph which we term the reachability graph from the function also includes static type information (e.g., whether encountered trace entries as follows: a value is of a pointer type) and hashes of global variable • For load or store entries, check if the address node has an names where applicable. This way, later analysis steps (e.g., the outgoing edge representing a previously seen load or store trace analysis described in Section IV-B) can identify pointer from that node, and if so, skip this trace entry. Otherwise, values in the trace without having to rely on heuristics, such as if the read or written value is a pointer, add an edge from checking whether a value belongs to a previously seen address the address node to the value node. range (as in [7]). • For data structure member access entries (i.e. The instrumentation pass inserts calls to inst_wrapper. getelementptr instructions in LLVM IR), add For our experiments on Linux kernel modules, we applied an edge from the source (i.e. base address) to the a patch to the Linux kernel that implements a stub for this destination (member address) node. function and a kernel module that, once loaded, handles the logging at instrumentation points. Prior to loading this “runtime” Non-existent address nodes are created on demand during kernel module, the kernel stub is effectively a no-op, allowing the construction of the reachability graph. the instrumented module to function even when the runtime In this reachability graph, we identify the set of nodes (adhas not been loaded. For other application scenarios, such as dresses) that are reachable from any of the nodes representing user-level code, different implementations of the runtime, for pointer arguments passed to the external function. This set instance in a library, would be possible as well. of addresses is a subset of the addresses that are visible to When the runtime module is loaded, it changes a function the external function, and for each of these addresses, the last pointer in the inst_wrapper stub to point to the actual write access is deemed visible to the external function. An logging implementation. That implementation uses printk illustration of a graph for this case can be seen in Figure 2: to output information at each instrumentation point in order The stack-allocated struct s_baz is accessible via the pointer to enable reliable tracing even in cases where the target may p passed to the external function and both of the stores to its crash. For other use cases, a trivial performance optimization members are visible to the called function. would involve caching trace data in memory to reduce the For the second case, writes in the component to global number of calls to printk. addresses or addresses reachable from them, we iterate over the trace, constructing a reachability graph as follows: B. Trace Analysis We have implemented a trace analysis tool that is capable of performing the reachability analysis for externally visible write accesses that we have described in Section III as well as deriving symbolic values for the addresses of memory accesses in order to facilitate comparisons between traces. We first describe our implementation of the reachability analysis, followed by our symbolic address generation.
•
• •
For load or store entries, if the address node already has an outgoing edge representing a read or write access, remove it. Add an edge from the address node to the value node. For data structure member entries, add an edge from the source to the destination address. Mark global addresses when they are encountered and annotate the corresponding node.
k
struct s_baz { int x, y; }; void c_foo(int* x) { struct s_baz s; struct s_baz* p; s.x = 0; s.y = 1; p = &s; e_bar(&p); }
define void @c_foo(int*)(i32*) { %1 = alloca %struct.s_baz %2 = alloca %struct.s_baz* %3 = getelementptr %struct.s_baz, %struct.s_baz* %1, i32 0, i32 0 store i32 0, i32* %3 %4 = getelementptr %struct.s_baz, %struct.s_baz* %1, i32 0 store i32 1, i32* %4 store %struct.s_baz* %1, %struct.s_baz** %2 call void @e_bar(s_baz**)(%struct.s_baz** %2) ret void }
%3 %2
%1
p
s
s.x
%4
* x− → − →. For writes in the component that are reachable from arguments passed to an external function, symbolic addresses are created using a similar mechanism. In this case, however, a set of anchor points consisting of return values of external functions, stack allocations, global variables and the results of pointer arithmetic is considered. If an address is reachable from several anchor points, we compare the lengths of the shortest paths from each anchor point to the address and pick the shortest one. The same symbolification is performed for values of pointer types.
C. Trace Comparison
Assessing the impact of faults on visible write accesses requires a mechanism for comparing traces of executions with Fig. 2. An example of a reachability graph and the corresponding code snippet. activated faults to fault-free executions (golden runs). Moreover, Solid lines indicate values stored at an address, dashed lines indicate offset in order to minimize the impact of non-deterministic runtime calculations. Writes to s.x and s.y are visible to e_bar. behavior, we need to compare a faulty execution to a set of fault free runs. While this allows us to more precisely extract those differences between traces that result from the activation In this reachability graph, we identify the set of nodes that of a fault (i.e. behavior that a fault-free implementation would are reachable from any node annotated as representing a global never exhibit), it also complicates the comparison process. We variable. As in the first case, write accesses operating on any compare traces using the following two-step approach: of these addresses are deemed visible to the external function. 1) Trace Merging: First, a set of traces from fault-free For the third case, writes in the component that are reachable runs is processed in order to generate a merged trace structure from arguments passed by an external function, we identify containing information about the addresses any execution writes each node representing a call to an external function that in turn to as well as the adddresses all executions write to, along calls functions provided by the component. This corresponds to with the corresponding values: Let t1 and t2 be traces from any external function node (including the root node) in the tree two fault-free executions, both of which consist of the same that has internal function child nodes. Then, for each component sequence of function calls and write to address a1 , with the function (that takes at least one pointer argument) called by such values being v1 (t1 ) and v2 (t2 ). The resulting merged structure an external function, we iterate over all trace entries belonging then contains a write access a1 ← {v1 , v2 }. Furthermore, let t1 to that function node and its child nodes, performing an in-order also write to address a2 . The merged structure then contains, traversal of a sub-tree with the component function at its root. separately, the set of addresses that all executions have written The traversal is stopped when we encounter another external to (Aall = {a1 }) as well as the set of addresses that at least function node. During this traversal, we once again build up a one trace has written to (Aany = {a1 , a2 }). Let t3 be a trace reachability graph, in the same manner as for global addresses, from a third fault-free execution which consists of a different apart from annotating nodes representing global variables. We sequence of function calls. The addresses and values written identify the set of nodes that are reachable from any node by t3 are stored separately from those of t1 and t2 . In order representing a pointer argument passed by the external function, to support workloads which exercise the target module using and as in the previous cases, deem the last write accesses to multiple threads or processes, merged structures are stored any of these addresses visible to the external function. separately for different threads and processes. 2) Symbolic Addresses: To compare traces from different 2) Trace Comparison: Next, this merged structure is used executions, where absolute addresses may differ, a mechanism in a comparison with a faulty execution. Let tf be a trace from to map concrete addresses to symbolic addresses is required. We such an execution. First, the threads or processes in tf need to generate symbolic addresses from reachability graphs similar be matched to their counterparts in the merged structure. Since to the ones described previously. A symbolic address consists absolute thread or process IDs may differ between executions, of an anchor point, and a path starting from that anchor point. they do not form a reliable foundation for such a mapping. For writes in the component that are reachable from arguments Instead, we perform the mapping by call sequence, looking passed by an external function and writes that are reachable first for exact matches. In cases where no exact match is found, from a global value (the second and third cases discussed the trace exhibiting the previously unknown call sequence can above), symbolic addresses use the argument or the global either be ignored so as to avoid introducing false positives, or variable as the anchor point and the shortest path from there a best effort comparison with the known call sequence with the to the address that was written to as the path. If, for instance, longest common prefix can be performed. We call the former a pointer x is passed to the component, and the component option strict mode. In the latter option, situations may arise writes to an address y that can be obtained by dereferencing in which several known call sequences have the same longest x and adding an offset k, the resulting symbolic address is common prefix length with the new call sequence. In this case, s.y
we compare with all of them and report the results for the compare both compilation and execution times of T R EK ER case in which we discover the fewest divergences. Best effort against native SFI test compilation and execution. comparisons are only performed over the common prefix so Does T R EK ER’s instrumentation affect SFI test results? that we never compare store visibility for different functions. As code instrumentation modifies the SFI target’s binary code For each address af that tf writes to, the trace comparison and thereby potentially its behavior, it is conceivable that checks if that address is also written to in at least one fault- the results of SFI tests are affected or even invalidated by free execution. In case it is not, the write to af is deemed the instrumentation. In order to assess if such an effect is an additional write access. Moreover, the comparison also observable for our approach, we compare the results of SFI checks if tf writes to all addresses ai that every fault-free tests with and without instrumentation of the injection target execution writes to. If it does not, a write to such an ai is using Fisher’s exact test for independence. deemed missing. Finally, for the set of addresses that both the faulty and at least one fault-free execution write to, the B. SUT value vf written by tf is checked against the set of values Although T R EK ER supports native execution, we perform written by the fault-free executions. If vf is not in that set, our evaluation in a virtualized environment to avoid frequent the write access differs from the corresponding write accesses hard machine restarts due to system crashes resulting from the seen in fault-free runs. Non-pointer values are not assigned tests. The toolchain we use in the experiments is illustrated in symbolic counterparts during trace processing but may in some Figure 3. The guest system is Debian 8.6 running in QEMU cases take on different values even during most fault-free runs. 2.6.0. It is configured with one CPU and 1 GiB of RAM This can be the case with, for instance, addresses that are and has virtual SCSI and NVMe devices attached. KVM is written as non-pointer types, timestamps or random values. In enabled. The guest kernel is Linux 4.4.25, patched to support order to minimize the number of false positives introduced by compilation with Clang/LLVM (using a modified version of the such cases, the comparison between faulty and fault-free runs 3 patch set created by the LLVMLinux project) and compiled ignores any values that differed in a majority of fault-free runs with Clang/LLVM 3.9.1. The host system is Debian 8.5 running (i.e. for which the number of observed values is greater than the distribution-provided 3.16 kernel. All experiments are half the number of fault-free runs). performed using four parallel QEMU instances running on The numbers of missing, additional and differing stores are a host system equipped with an i7-4790 CPU and 16 GiB of gathered separately for the three cases of write access visibility. RAM. Experiment control and timeout detection are handled by a controller running on the same host. The timeout value V. E XPERIMENTAL A NALYSIS for all tests is 45 seconds, excluding boot and setup time. In this section, we evaluate our approach by performing In addition to the timeout mechanism, we employ detectors experiments with real-world Linux kernel modules: a storage operating on the serial output of the guest system to detect error device driver and two file systems. The questions that we messages from the kernel. Our detectors distinguish between strive to answer in this evaluation are detailed in the following five different classes of kernel error messages (Call Trace, GPF, Section V-A. We describe our SUT in Section V-B. Section V-C BUG, Oops and Panic). We also check exit codes during the covers the injection targets and Section V-D our choice of workload execution to detect workload failures that did not workload. We report on our experimental results in Section V-E. result in kernel error messages, resulting in a total of eight different experiment result classes. A. Research Questions Is T R EK ER a sound detector for error propagation? To C. Injection Targets and Faultload Selection answer this question, we analyze if there are any spurious indications of error propagation by comparing memory traces of SFI tests for which the injected mutations have not been activated. As the injected faults cannot have an effect on the correct execution of the workload in this case, any differences in the memory traces are false positives. Does T R EK ER improve the soundness of SFI tests? Even if T R EK ER is a sound detector, it only improves the soundness of SFI tests if silent error propagation actually occurs in these tests. To assess if silent error propagation goes unnoticed in conventional OS-level SFI tests, we analyze T R EK ER’s memory traces for SFI tests that complete without any obvious error indications. What are the overheads resulting from T R EK ER’s instrumentation? Static code instrumentation always imposes a certain overhead at both compile-time and run-time. We
We apply our proposed approach to three different, widely used Linux kernel modules: (1) f2fs, the Flash-Friendly File System, a file system specifically designed for NAND Flashbased storage devices; (2) btrfs, a copy-on-write file system implementing various advanced features; and (3) nvme, the kernel module providing support for NVMe devices. For each of these modules, we perform the following series of steps: (1) We inject software faults using the SAFE tool4 [4] with default settings, (2) build the resulting module using our compile time instrumentation tool (Section IV-A), (3) execute a workload that utilizes functionality provided by the module, and (4) observe the resulting effects during execution and via memory trace comparison. 3 http://llvm.linuxfoundation.org 4 http://wpage.unina.it/roberto.natella/tools.html
Experiment Control & Result Detection
Module
Kernel
QEMU
Instrumented Module instr.
Runtime
SSH
Processed Trace
Trace Analysis Trace Symbolification
serial console
Exp. Log
Fig. 3. The QEMU-based virtualized test environment and toolchain
SAFE performs fault injection at the source code level using the G-SWFIT [3] fault operators. We build and instrument the target modules with Clang/LLVM 3.9.1. We use prefix matching for btrfs and f2fs to maximize the usage of recorded memory traces (see Section IV-C). As nvme directly interfaces with the system hardware and, thus, has a higher exposure to non-determinism, we use the strict mode to limit false positives resulting from this. D. Workload Selection All three modules in our study provide functionality related to file I/O. Two of them (btrfs and f2fs) are file systems and the third one (nvme) provides support for an interface standard for storage devices. Consequently, we apply the same workload to all three modules. Specifically, the workload consists of the following sequence of steps: 1) Loading the target module and any other required modules; 2) Creating a filesystem (F2FS for the f2fs and nvme modules, BTRFS for the btrfs module) on either an NVMe (nvme, f2fs) or SCSI (btrfs) device; 3) Mounting that filesystem; 4) Creating a new file and writing to it; 5) Creating a new directory; 6) Reading the file; 7) Removing the directory; 8) Removing the file; 9) Unmounting the filesystem; 10) Removing the target module and all other modules that were loaded in the first step. The instrumentation is active throughout the execution of the workload (that is, the runtime module is loaded prior to the first step and removed after the last step). This workload exercises most commonly used filesystem features and, through module insertion, device registration, I/O activity and removal, also exercises the essential functionality of the nvme module. E. Results We report on the experimental results obtained with T R EK ER and how they answer the research questions posed in Section V-A. The overall result distribution for runs with activated mutation according to the simple detectors discussed in Section V-B is shown in Figure 4.
1) Soundness of T R EK ER: In mutation-based SFI, there is a risk that the mutated code fraction does not get executed during the test and, obviously, no error propagation should occur in these cases. To reliably identify these tests, we track the execution of mutated code by dedicated log instructions. We then use T R EK ER to analyze their memory traces. Any error propagation indicated by T R EK ER are false positives. Figure 5 shows the number of trace deviations detected by T R EK ER for different numbers of golden runs used as comparison basis for runs with and without mutation activation, with the latter case representing false positives indicated by the dashed lines. For all three modules, we observe a false positive rate below 1 %. From Figure 5, we see that the number of detected trace deviations does not change beyond 800 golden runs. Consequently, we use this number as a comparison basis in our further experiments to keep the false positive rate in the presented results below 1 % and the comparison stable. 2) Soundness of SFI tests with T R EK ER: To assess the suitability of the proposed approach for detecting divergences in mutant behavior during apparently successful runs, we examine the sets of SFI test traces with mutant activations which finished without any obvious error indication, i.e. the runs that are marked as successful in Figure 4. We show the trace deviations found by T R EK ER in Figure 6 with overall rates ranging from 2.75 % (btrfs) to 10.1 % (nvme). From the analysis of different visibility types we observe instances of at least two different types of visibility for all modules. However, store visibility via a global variable only occurs for nvme. We conclude that, although the different types of visibility occur with different frequencies, analysis of all three is needed to obtain a complete picture of differences in memory access behavior between executions. The significantly higher rate of propagation to the callee rather than the caller is an interesting observation, as it indicates that errors tend to not propagate directly to components that invoke functionality of the targeted modules (i.e., their callers), but rather tend to spread further in the system. While a detailed study is needed to substantiate such a result, this finding illustrates the insights that T R EK ER fosters and that traditional SFI oracles cannot provide. TABLE I C OMPILE - TIME OVERHEAD (OH) OF INSTRUMENTATION . U SER TIMES ARE REPORTED IN SECONDS . Module
Buildtype
Median
MAD
OH
btrfs
instr uninstr
71.86 43.62
0.21 0.11
1.7
f2fs
instr uninstr
14.07 10.07
0.14 0.06
1.4
nvme
instr uninstr
2.43 1.62
0.02 0.02
1.5
3) Instrumentation Overhead: To assess the overhead associated with our instrumentation, we compare the durations for compiling and executing mutated modules in different instrumentation modes.
Module
0.100
btrfs (n=1981) f2fs (n=3350) nvme (n=1159)
Relative Frequency
Relative Frequency
0.6
0.4
0.2
0.0 c Su
ce
ss
rk
Wo
loa
ut
eo
im dT
r Wo
ad k lo
re
ilu
Fa
ll T
Ca
e rac
F
GP
g Bu
ps
Oo
nic
0.050
0.025
BTRFS
Result Class
Module
BTRFS F2FS NVME (strict)
Trace Deviation Rate
total callee caller global
0.000
Pa
Fig. 4. Result distribution for runs with activated mutation 0.15
0.075
Visibility Type
F2FS
NVME (strict)
Module
Fig. 6. Trace deviation rates for the three modules and different types of store visibility when compared with 800 golden runs.
Mutation activation activated inactive
0.10
0.05
TABLE II RUN - TIME OVERHEAD (OH) OF INSTRUMENTATION . W ORKLOAD DURATIONS REPORTED IN SECONDS . Module
Mode
Median
MAD
OH
btrfs
instr active instr inactive uninstr
2.714 1.113 1.109
0.139 0.012 0.008
2.5 1.0
f2fs
instr active instr inactive uninstr
1.951 0.101 0.101
0.061 0.006 0.006
19.3 1.0
nvme
instr active instr inactive uninstr
2.133 0.656 0.642
0.082 0.009 0.008
3.3 1.0
0.00 100
200
300
400
500
600
# Golden Runs
700
800
900
1000
Fig. 5. Result stability with increasing number of golden runs.
Compile-time Overhead: We measure the user time5 that make needs for building instrumented and uninstrumented versions of our mutants from a clean work space. Table I summarizes the median and the median absolute deviation (MAD) of user times. Column OH reports the overhead factors (between median values) for compilation with instrumentation for all modules. In the median, the compile-time overhead ranges from a factor of 1.4 for f2fs to a factor of 1.7 for btrfs. We deem these overheads as manageable in practice, especially since compilation is often a one-time effort and the actual needed real-time for compilation is much smaller than accumulated user time due to parallel compilation capabilities of build tools like make. Run-time Overhead: We run the same SFI tests using the full set of mutants in three different modes: without instrumentation, with instrumentation compiled into the mutants but disabled 5 We
employ the GNU time utility to collect user times.
during runtime, and with active instrumentation. We measure the durations of all workload executions that complete in all three modes. Table II summarizes the median and the median absolute deviation (MAD) of workload durations in seconds of real-time. Column OH reports the overhead factors (between median values) compared to the uninstrumented execution. The overhead for runs with active instrumentation ranges from a factor of 2.5 for btrfs to a factor of 19.3 for f2fs. We attribute the higher relative overhead for f2fs to the high concentration of logging output in its mount routine. We expect to achieve a lower overhead for such cases if data logging is changed to use a more efficient format rather than relying on the kernel’s printk facilities. Execution with inactive instrumentation imposes a negligible overhead. We observe the highest overhead for nvme with 14 ms. By comparison, PinOS [21] overheads with inactive instrumentation range from a factor of 12 to 120. DECAF [25] incurs a 15.2 % overhead with disabled instrumentation in addition to the overheads incurred by QEMU emulation. T R EK ER, in contrast, can run on bare metal configurations to avoid this overhead. We conclude that, with T R EK ER, instrumented modules could even be used in production, but data logging should be enabled only for tests
could be tackled by adjusting the corresponding values at the cost of a lower test throughput, similar to what has been DISTRIBUTION AND INSTRUMENTATION MODE reported in [40]. 5) Threats To Validity: We identify the following threats to Module p validity: 1) Non-determinism in the memory access patterns of btrfs 0.9834 the target modules that can, even in the absence of faults, lead f2fs 0.9978 nvme 0.8420 to divergences between execution traces for the same workload; 2) Limitations of the presented approach for identifying visible stores, assigning symbolic addresses and detecting divergences; or execution periods of interest for trace analysis. 3) The choice of target modules, SUT and workload. 4) Instrumentation Impact on SFI Test Results: We examine We take several measures to minimize the effects of nonthe effect of our instrumentation on the results of SFI tests. determinism: We use a large number of golden runs as a We use the same set of tests with three instrumentation modes comparison base, assign symbolic values to memory addresses that we used to assess the run-time overhead in Section V-E3. (including pointers that are used as value rather than address We consider all tests with activated mutation and compare operands in load or store operations) to avoid non-determinism the obtained result distributions for each module. We use introduced by concrete address values, and handle different Fisher’s exact test to test the null hypothesis (H0 ) that “there processes and threads individually as opposed to explicitly is no association between observed result distributions and the tackling concurrency. The low false positive rates obtained in instrumentation mode”. Table III reports the p-values obtained our evaluation demonstrate the effectiveness of these measures. from Fisher’s test. With p � 0.05 for all three modules, we T R EK ER has several restrictions on the scope within which, cannot reject the null hypothesis, i.e., there is no statistically for instance, store visibility is determined (e.g., only stores significant evidence that the instrumentation systematically between the prior external function and the current one are changes the result distribution. considered) or symbolic values are assigned (pointer arithmetic Nonetheless, in pairwise comparisons of executions of the that is not modeled by getelementptr instructions is same mutant with different instrumentation modes, we observe not analyzed). These restrictions result from the deliberately a small number of differences in outcomes. We focus on limited scope of our instrumentation and from performance the comparison between runs with activated instrumentation optimizations in the trace processing. Consequently, there may and uninstrumented runs and see a total of 79, 101 and be visible stores outside of the range considered by T R EK ER or 68 differences for btrfs, f2fs and nvme, respectively, different memory addresses that are assigned the same symbolic amounting to 0.79 %, 1.11 % and 2.46 %. As it is the module address. Such instances may result in the proposed approach that most frequently exhibits such divergences, we discuss the reporting fewer divergences than actually exist. nature of the divergences seen for nvme in some more detail: Finally, the evaluation targets three different kernel modules In 26 of the 68 cases, we observe a timeout only for the run providing related functionality, running on one kernel version with activated instrumentation. We hypothesize that these are and one system setup. Other categories of kernel modules most likely cases of spurious timeout detection, potentially or other operating systems may behave in a significantly a result of the overheads we discuss in Section V-E3. In a different manner, and our results may not generalize. Furfurther 21 cases, we observe neither a success nor a timeout thermore, different workloads could exercise different parts but different failure modes. For instance, there are several of the module. Long-running workloads, for instance, may be cases in which the uninstrumented run results in a kernel panic expected to spend less time executing parts of the module for whereas the run with activated instrumentation merely results which the instrumentation is particularly expensive, such as in a kernel oops before reaching the execution time limit. module insertion, potentially leading to lower mean overheads. These are, once again, likely related to longer test execution Furthermore, the likelihood of error propagation may increase times due to the instrumentation. We also observe two cases with longer workload running times. We believe that T R EK ER in which the instrumented run completes successfully whereas is applicable to a wide variety of usage scenarios and our the uninstrumented run does not, suggesting non-deterministic evaluation demonstrates the viability of the approach. behavior by the mutant. Among the remaining 19 cases, we VI. C ONCLUSION observe twelve in which the instrumented run fails shortly after activating a mutation whereas the uninstrumented run In this paper, we have presented T R EK ER, an approach does not (our data does not reveal whether the mutation was for identifying how faulty OS components can affect other activated during the uninstrumented run), six cases in which parts of the system. T R EK ER enables tracing memory accesses the instrumented run results in a failure after the end of the in a target module using compile-time instrumentation and workload execution and after removal of the runtime but prior to achieves low instrumentation overheads. We have presented system shutdown and finally one in which the uninstrumented a method for utilizing T R EK ER to improve oracles for FI execution times out but the instrumented run does not. We experiments targeting OS components. An evaluation with conclude that most of the differences in outcome we observe several widely used modules for the Linux kernel demonstrates are related to timeout detection and execution time limits and the viability of the approach, finding that conventional oracles TABLE III p- VALUES OF F ISHER ’ S TEST OF INDEPENDENCE OF OBSERVED RESULT
would misclassify up to ∼10 % of seemingly successful runs. The evaluation shows a false positive rate below 1 %. ACKNOWLEDGMENTS This work was supported by the German Federal Ministry of Education and Research (BMBF) as well as by the Hessen State Ministry for Higher Education, Research and the Arts (HMWK) within CRISP at TU Darmstadt. R EFERENCES [1] A. Avizienis, J. C. Laprie, B. Randell, and C. Landwehr, “Basic concepts and taxonomy of dependable and secure computing,” IEEE Trans. Depend. Sec. Comput., vol. 1, no. 1, pp. 11–33, 1 2004. [2] M. R. Aliabadi, K. Pattabiraman, and N. Bidokhti, “Soft-LLFI: A Comprehensive Framework for Software Fault Injection,” in Proc. of International Symposium on Software Reliability Engineering Workshops (ISSREW), 2014, pp. 1–5. [3] J. Duraes and H. Madeira, “Emulation of Software Faults: A Field Data Study and a Practical Approach,” IEEE Trans. Softw. Eng., vol. 32, no. 11, pp. 849–867, 11 2006. [4] R. Natella, D. Cotroneo, J. Duraes, and H. Madeira, “On Fault Representativeness of Software Fault Injection,” IEEE Trans. Softw. Eng., vol. 39, no. 1, pp. 80–96, 1 2013. [5] Y. Jia and M. Harman, “An Analysis and Survey of the Development of Mutation Testing,” IEEE Trans. Softw. Eng., vol. 37, no. 5, pp. 649–678, 9 2011. [6] R. Natella, D. Cotroneo, and H. S. Madeira, “Assessing Dependability with Software Fault Injection: A Survey,” ACM Comput. Surv., vol. 48, no. 3, pp. 44:1–44:55, Feb. 2016. [7] A. Lanzaro, R. Natella, S. Winter, D. Cotroneo, and N. Suri, “An Empirical Study of Injected Versus Actual Interface Errors,” in Proc. of ISSTA, 2014, pp. 397–408. [8] A. Thomas and K. Pattabiraman, “LLFI: An intermediate code level fault injector for soft computing applications,” in Proc. of SELSE, 2013. [9] N. Nethercote and J. Seward, “Valgrind: A Framework for Heavyweight Dynamic Binary Instrumentation,” in Proc. of PLDI, 2007, pp. 89–100. [10] C.-K. Luk, R. Cohn, R. Muth, H. Patil, A. Klauser, G. Lowney, S. Wallace, V. J. Reddi, and K. Hazelwood, “Pin: Building Customized Program Analysis Tools with Dynamic Instrumentation,” in Proc. of PLDI, 2005, pp. 190–200. [11] “SystemTap,” https://sourceware.org/systemtap/. [12] M. Desnoyers and M. R. Dagenais, “The LTTng tracer: A low impact performance and behavior monitor for GNU/Linux,” in OLS (Ottawa Linux Symposium), 2006, pp. 209–224. [13] J. Aidemark, J. Vinter, P. Folkesson, and J. Karlsson, “GOOFI: generic object-oriented fault injection tool,” in Proc. of DSN, 2001, pp. 83–88. [14] J. Carreira, H. Madeira, and J. G. Silva, “Xception: a technique for the experimental evaluation of dependability in modern computers,” IEEE Trans. Softw. Eng., vol. 24, no. 2, pp. 125–136, 2 1998. [15] T. Piper, S. Winter, P. Manns, and N. Suri, “Instrumenting AUTOSAR for dependability assessment: A guidance framework,” in Proc. of DSN, 2012, pp. 1–12. [16] T. Piper, S. Winter, N. Suri, and T. E. Fuhrman, “On the Effective Use of Fault Injection for the Assessment of AUTOSAR Safety Mechanisms,” in Proc. of EDCC, 2015, pp. 85–96. [17] M. Sand, S. Potyra, and V. Sieh, “Deterministic high-speed simulation of complex systems including fault-injection,” in Proc. of DSN, 2009, pp. 211–216. [18] H. Schirmeier, M. Hoffmann, C. Dietrich, M. Lenz, D. Lohmann, and O. Spinczyk, “FAIL*: An Open and Versatile Fault-Injection Framework for the Assessment of Software-Implemented Hardware Fault Tolerance,” in Proc. of EDCC, 2015, pp. 245–255.
[19] B. Zhou, M. Kulkarni, and S. Bagchi, “Wukong: Effective diagnosis of bugs at large system scales,” SIGPLAN Not., vol. 48, no. 8, pp. 317–318, Feb. 2013. [20] N. Nethercote and J. Seward, “Valgrind: A Framework for Heavyweight Dynamic Binary Instrumentation,” in Proc. of PLDI, 2007, pp. 89–100. [21] P. P. Bungale and C.-K. Luk, “PinOS: A Programmable Framework for Whole-system Dynamic Instrumentation,” in Proc. of VEE, 2007, pp. 137–147. [22] P. Feiner, A. D. Brown, and A. Goel, “Comprehensive Kernel Instrumentation via Dynamic Binary Translation,” in Proc. of ASPLOS, 2012, pp. 135–146. [23] A. Henderson, A. Prakash, L. K. Yan, X. Hu, X. Wang, R. Zhou, and H. Yin, “Make It Work, Make It Right, Make It Fast: Building a Platformneutral Whole-system Dynamic Binary Analysis Platform,” in Proc. of ISSTA, 2014, pp. 248–258. [24] P. Kedia and S. Bansal, “Fast Dynamic Binary Translation for the Kernel,” in Proc. of SOSP, 2013, pp. 101–115. [25] A. Henderson, L. Yan, X. Hu, A. Prakash, H. Yin, and S. McCamant, “DECAF: A Platform-Neutral Whole-System Dynamic Binary Analysis Platform,” IEEE Trans. Softw. Eng., vol. PP, no. 99, pp. 1–1, 2016. [26] P. Koopman, J. Sung, C. Dingman, D. Siewiorek, and T. Marz, “Comparing operating systems using robustness benchmarks,” in Proc. of SRDS, 1997, pp. 72–79. [27] C. Fetzer and Z. Xiao, “An automated approach to increasing the robustness of C libraries,” in Proc. of DSN, 2002, pp. 155–164. [28] I. Irrera, M. Vieira, and J. Duraes, “Adaptive Failure Prediction for Computer Systems: A Framework and a Case Study,” in Proc. of HASE, 2015, pp. 142–149. [29] X. Ju and H. Zou, “Operating System Robustness Forecast and Selection,” in Proc. of ISSRE, 2008, pp. 107–116. [30] N. P. Kropp, P. J. Koopman, and D. P. Siewiorek, “Automated robustness testing of off-the-shelf software components,” in Proc. of FTCS, 1998, pp. 230–239. [31] J. Regehr, “Random Testing of Interrupt-driven Software,” in Proc. of EMSOFT, 2005, pp. 290–298. [32] D. Cotroneo, L. D. Simone, F. Fucci, and R. Natella, “MoIO: Run-time monitoring for I/O protocol violations in storage device drivers,” in Proc. of ISSRE, 2015, pp. 472–483. [33] D. Lo, H. Cheng, J. Han, S.-C. Khoo, and C. Sun, “Classification of Software Behaviors for Failure Detection: A Discriminative Pattern Mining Approach,” in Proc. of KDD, 2009, pp. 557–566. [34] L. Lu, A. C. Arpaci-Dusseau, R. H. Arpaci-Dusseau, and S. Lu, “A Study of Linux File System Evolution,” ACM Trans. Storage, vol. 10, no. 1, pp. 3:1–3:32, Jan. 2014. [35] S. Zhang and M. D. Ernst, “Automated Diagnosis of Software Configuration Errors,” in Proc. of ICSE, 2013, pp. 312–321. [36] W. I. Kao, R. K. Iyer, and D. Tang, “FINE: A fault injection and monitoring environment for tracing the UNIX system behavior under faults,” IEEE Trans. Softw. Eng., vol. 19, no. 11, pp. 1105–1118, 11 1993. [37] D. Cotroneo, D. D. Leo, F. Fucci, and R. Natella, “SABRINE: Statebased robustness testing of operating systems,” in Proc. of ASE, 2013, pp. 125–135. [38] W. E. Wong, R. Gao, Y. Li, R. Abreu, and F. Wotawa, “A survey on software fault localization,” IEEE Trans. Softw. Eng., vol. 42, no. 8, pp. 707–740, 8 2016. [39] C. Lattner and V. Adve, “LLVM: A Compilation Framework for Lifelong Program Analysis & Transformation,” in Proc. of International Symposium on Code Generation and Optimization (CGO), 2004. [40] S. Winter, O. Schwahn, R. Natella, N. Suri, and D. Cotroneo, “No PAIN, No Gain? The Utility of PArallel Fault INjections,” in Proc. of ICSE, 2015, pp. 494–505.