water Article
Tracing Nitrate-Nitrogen Sources and Modifications in a Stream Impacted by Various Land Uses, South Portugal Mariela A. Yevenes 1,2, *, Karline Soetaert 3 and Chris M. Mannaerts 1 1 2 3
*
Faculty of Geo-Information and Observation Science, University of Twente, P.O. Box 217, 7500 AE Enschede, The Netherlands;
[email protected] Department of Oceanography and Center for Climate and Resilience Research, Universidad de Concepción, Casilla 160-C Concepción, Chile Department of Ecosystem Studies, Netherlands Institute of Sea Research, Postbus 140, 4400 AC Yerseke, The Netherlands;
[email protected] Correspondence:
[email protected]; Tel.: +56-41-2203-585
Academic Editors: David K. Kreamer and Y. Jun Xu Received: 18 January 2016; Accepted: 29 August 2016; Published: 6 September 2016
Abstract: The identification of nitrate-nitrogen (NO3 –N) origin is important in the control of surface and ground water quality. These are the main sources of available drinking water. Stable isotopes (15 N and 18 O) for NO3 –N and along with a 1-D reactive transport model were used to study the origin and processes that lead to nitrogen transformation and loss in a major stream that flows into a reservoir within an intensively cultivated catchment area (352 km2 ) in Alentejo-Portugal. Seasonal water samples (October–November 2008, March 2009 and September 2009) of stream surface water, wells and sediment pore water were collected. The results showed consistently increasing isotope values and decreasing NO3 –N concentrations downstream. During winter (wet period, November 2008 and March 2009) slightly higher NO3 –N concentrations were found in comparison to early fall (dry period: October 2008) and summer (dry period: September 2009). Isotopic composition of 15 N and 18 O values in surface water samples from the stream and wells indicated that the dominant NO3 –N sources were derived mainly from the soil and fertilizers. There was also significant nitrification in surface water at the head of the stream. Sediment pore waters showed high NO3 –N values near the sediment-water interface (reaching 25 mg·N·L−1 ) and NO3 –N concentrations sharply decreasing with sediment depth, suggesting significant NO3 –N consumption. Denitrification was also detected using the 15 N signature in upstream waters, but not downstream where very low NO3 –N levels were measured. In the stream, the calculated isotopic enrichment factor for NO3 –N was −2.9‰ for 15 N and −1.78 for 18 O, this indicates that denitrification accounts for 7.8% to 48% of nitrate removal. Keywords: nitrate-nitrogen; stable isotopes; streams; reactive transport model
1. Introduction Recent studies suggest that the nitrogen (N) cycle is the most rapidly changing biogeochemical element and that the excessive use of reactive N in the environment is the third most important problem globally, after biodiversity loss and climate change [1,2]. One of the challenges concerning excess reactive N in the environment is a lack of understanding regarding the catchment scale of N removal, including the nutrient dynamics and their implications within different terrestrial and aquatic ecosystems [3–6]. An excess of reactive N in different environments can negatively impact water quality and cause an increase in the transfer of greenhouse gases to the atmosphere [7]. Streams impacted by agriculture may receive high levels of reactive N (i.e., nitrate, ammonium, organic nitrogen) from the land. Fundamentally, when moist agricultural soils are fertilized, rapid increases in N cycling may Water 2016, 8, 385; doi:10.3390/w8090385
www.mdpi.com/journal/water
Water 2016, 8, 385
2 of 18
occur, creating excessive N availability and enhancing the potential for nitrogen loss to streams [8]. NO3 –N is the predominant form of reactive nitrogen, highly soluble and readily leached from soils. Ammonium (NH4 –N) is also important, but less prevalent in the water as it is adsorbed predominantly by charged clay particles. Several studies suggest that shallow streams and the associated pore water (water from underlying sediments) within intense agricultural areas may act as “hotspots”—i.e., areas that present disproportionately high reaction rates relative to the surrounding area [9]. Taking this into consideration, any biogeochemical process occurring in a stream may be highly efficient over relatively short distances. This emphasize that shallow streams are considered to be important biogeochemical transformations zones [10]. Denitrifying bacteria reduce nitrate (NO3 –N) via nitrite NO2 –N nitric oxide NO and nitrous oxide (N2 O) to the non-reactive dinitrogen gas (N2 ), with organic carbon frequently acting as an electron donor [11]. Denitrification is considered to be a particularly challenging process to measure and model [4]. Predominantly due to the fact that small sites (hotspots) frequently account for a high percentage of the denitrification activity, which depend on environmental factors such as substrate availability, temperature, and oxygen concentration in aquatic ecosystems. Although some of the removal and storage of reactive N occurs within the landscape, a significant proportion is thought to occur within surface water from streams and groundwater [12]. Dual stable isotope signatures of dissolved NO3 –N together with reactive transport modelling are both powerful tools to study the sources and processing of nitrate in streams, due to the fact that various origins and processes tend to have distinct isotopic signatures [13–15]. For instance, during denitrification as NO3 –N levels decrease, as a result of natural isotopic fractionation residual NO3 –N becomes enriched in heavy isotopes 15 N and 18 O [16,17]. This is because bacteria preferentially reduce 14 NO3 rather than 15 NO3 , therefore leaving an enriched pool of 15 NO3 [18,19]. Despite the recently identified challenges and drawbacks regarding the isotopic identification technique, such as assumptions on oxygen sources in microbial nitrate [20], it continues to prove itself as a successful technique in identifying mixing sources [8,16]. The NO3 –N concentrations in European watersheds have been well documented [21–23], mainly due to concerns generated from the European Water Framework Directive [17,19,24]. However, in Southern Portugal, there is a lack of understanding about how the spatial and temporal patterns along a stream and in the underlying sediments relate to the intense land uses in the catchment area. To address this knowledge gap, stream water, well samples and underlying sediments were analysed for chemical and physical parameters, and NO3 –N isotopic ratios in the Roxo catchment, Southern Portugal. This information was used to identify the processes that lead to nitrogen transformation and loss along the length of a shallow stream, and to identify the sources of NO3 –N in the watershed, in surface waters of shallow streams, and in the sediment pore waters. 2. Methodology 2.1. Study Area A mesoscale catchment area, the Roxo, in Southern Portugal (37◦ 460 4400 N to 38◦ 020 3900 N latitude and 7◦ 50 4700 E to 8◦ 120 2400 E longitude, Figure 1) was selected due to the intensive agricultural cultivation practices in the area. The Roxo catchment area is 352 km2 and located in the Beja Province of the Alentejo region. A network of shallow streams that cross most of the agricultural area characterizes it. The Chaminé stream as a main stream was selected. It has a generally low flow volume (average 0.3 m3 ·s−1 ± 0.02) and with seasonally intermittent high flows occurring during autumn or winter. Annual rainfall during the study period from 2008 to 2009 was 547 mm, with the majority of the rainfall occurring between November and March. Mean annual temperatures were around 22 ◦ C. Soil categories, according to the FAO-UNESCO system, are characterized as Luvisols, Litosols, Planosols and Vertisols, with Luvisols being the main soil class present in the area [25,26]. Hydro-geological studies in the northern part of the catchment boundaries indicated that a productive aquifer of the
Water 2016, 8, 385
3 of 18
upper Roxo catchment is located in the Beja-Acebuches and Beja Gabbro geotectonic complexes. These geological formations represent mainly gabbro-dioritic rocks. This characteristic bedrock varies locally and can reach 30 m in thickness. This creates an unconfined aquifer with a shallow water table of 2 m approximately in the north with NO3 –N concentrations reaching 6.5 mg·N/L [27]. Near to the reservoir the water table is close to 6 m. The topography varies from nearly flat to a gently sloping terrain with elevations ranging from 123 m at the catchment reservoir outlet, to 280 m.a.s.l. near Beja city, over approximately 15 km distance. Water in the catchment area drains into the Roxo reservoir (max. volume approx. 108 m3 ), an artificial impoundment built in the early 1960s and used for municipal water supply to Beja city (approx. 161,000 inhabitants), and also to the local mining industry and irrigation water supply to several irrigation perimeters [28]. The residual municipal waters from Beja city are channelled into a wastewater treatment plant (WWTP), before the residual effluent waters are released into the Chaminé-Pisoes streams in the upper part of the catchment. This yields an additional and relatively constant nitrogen input and loading on the upper catchment streams. Water quality in the catchment is affected by agriculture (80% of the catchment), with major crops such as winter wheat, maize, sunflower, cork and olives (Table 1, extracted from [29]). Table 1. Land use, cover, and crop management information in the upper Roxo catchment area [29].
Land Use
Agricultural-arable land winter annual in rotation
Crop Information
Maize
Total Area (%)
Fertilizer Use
Fertilizer Type or NPK
Amount
Timing Dates
7.7
Planting Boost Mid/maturing
15-35-00 6-20-18 Nitro 32N
100 300 400
June–August
5.4
Planting Development
20-20-00 Nitro 27
200 200
June–August
19.5
Planting Development3 leaves stage
10-30-00 Nitro 27
300 250
Begin November January–February
Agricultural mixed crops
Summer annuals pasture, long fallow
36.8
–
–
–
–
Agricultural permanent crops
Olives Vineyards Cork oak
7.2 1.8 6.6
–
–
–
–
Water bodies
Ponds, reservoir (dam)
3.0
–
–
–
–
Seminatural vegetation forest land
Rangeland Shrubs eucalyptus, Pinus
4.1 8.0
–
–
–
–
Urban
Urban low density Urban high density
0.10 0.15
–
–
–
–
Fertilization in the catchment is mainly maize from June to August, September, reaching 400 kg·ha−1 winter wheat reaching 300 kg·ha−1 at the beginning of the plantation every October, and alfalfa planted in June reaching 200 kg·ha−1 . Winter wheat is an intensive agricultural crop, generally requiring around 200 kg·N·ha−1 of Nitro 27% fertilizer, whereas the recommended Nitrogen fertilization for maize is 300 kg N·ha−1 of NPK [27,30]. The major fertilizer application in the catchment area occurs in June. In the South of the catchment area 28% of the land is made up of Eucalyptus and Pine forest plantations, and some other areas have natural vegetation (Figure 1). High NO3 –N levels are observed in the drainage system, especially in the shallow aquifer of the Roxo catchment [31]. Further activities, such as pig, cattle and sheep farming also take place within the catchment area.
Water 2016, 8, 385 Water 2016, 8, 385
4 of 18 4 of 18
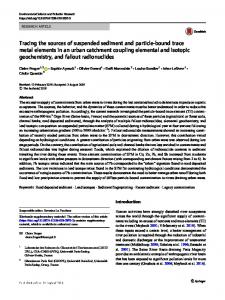
Figure 1. Location of the Roxo catchment study area, Southern Portugal, with the principal pollution sources. Circles are the sampling sites, including stream Figure 1. Location of the Roxo catchment study area, Southern Portugal, with the principal pollution sources. Circles are the sampling sites, including stream water water (A), shallow groundwater (W), and pore water samples (P). A1–A9 are the stream sampling sites. (A), shallow groundwater (W), and pore water samples (P). A1–A9 are the stream sampling sites.
Water 2016, 8, 385
5 of 18
2.2. Water Sampling Figure 1 shows a map of the major and perennial stream, indicating sampling point positions. Samples were collected midstream from 8 stream sites (A1 to A8 from upstream to downstream in the main Chaminé stream, along 15 km), and from 10 shallow wells with water table levels between 2 and 5 m. The discrete water sampling campaigns were conducted during dry and wet periods referred to summer (from 19th to 29th October 2008 and from 3th to 15th September 2009) and winter (from 1st to 7th November 2008, 15th to 26th March 2009), respectively. Three replicate 15 mL water samples were collected from each monitoring sampling point for nutrients (NO3 –N, NH4 –N) and 100 mL water samples for stable isotopes (15 N and 18 O), using a peristaltic water pump, connected to a water collector and filtered in the field with 0.45 µm filters. Water samples for nutrients and stable isotopes were collected in non-reactive plastic bottles with double seal caps and stored on dry ice to keep frozen for transport back to the laboratory. Analysis took place immediately after every sampling trip. O2 , Temperature (◦ C) and Electrical conductivity (EC) were measured in the field with a hand-held Hanna multi-parameter instrument. Sediment pore water was sampled at three sites of the Chaminé stream (Figure 1). Sediment porewater profiles were sampled with minimum disturbance by inserting a rhizon sampler syringe [32] into drill holes in a 52 cm long core located at the bottom of the stream pools (P1, P2 and P3), near to sites A3, A4 and A6. The holes were slightly bigger than 4 mm diameter size to allow fixing the Rhizon samplers through the drill holes. The holes were sealed with duct tape prior and during the sediment collection. After the collection, a needle was used to pierce the tape and introduce each Rhizon sampler. Subsequently, ten Rhizon samplers were inserted horizontally into the core at depths of 0, 0.5, 1, 2, 3, 5, 7, 10, 25 and 30 cm below the sediment-water interface. Samples were stored directly in 10 mL glass vials without contact with the atmosphere. Cations and anions concentrations were analysed by inductively coupled plasma-optical emission spectrometry (Varian Liberty AX sequential ICP-AES and a Varian SpectrAA Atomic Absorption Spectrometer (AAS) (Varian Inc., Palo Alto, CA, USA), at Faculty of Geo-information Science and Earth Observation, ITC/University of Twente, Enschede, The Netherlands. Water samples collected for isotopic composition (15 N and 18 O) were analysed using the bacterial denitrification method [33] and determined by isotope ratio mass spectrometry on a Sercon 20-20 IRMS with Syscon Electronics (Sercon Ltda, Cheshire, UK) in the certified ISOFYS Environmental Isotope laboratory of Ghent University (Belgium). 2.3. Stable Isotope Calculations The isotopic results are expressed using the delta notation (i.e., the difference in parts per thousand between the less abundant isotopic ratio and the most abundant isotopic ratio, relative to the same ratio in a reference standard (Vienna Standard Mean Ocean Water for 18 O and an open atmosphere air standard for 15 N), and defined by: 15
N = 1000[(Rsample − Rair )/Rair ];
18
O = 1000[(Rsample − Rsmow )/Rair ]
(1)
where Rsample and Rair and Rsmow are the isotopic ratios (15 N/14 N or 18 O/16 O) for the sample and for the reference standard of 15 N and 18 O, respectively. Partitioning of isotopes between two compounds containing the same element with different isotopic ratio is called isotope fractionation [18] and can be defined through the kinetic fractionation factor as follow: α ( p − s) = R p /Rr (2) where α represent the kinetic fractionation factor between the product (p) and the substract (s), Rp and Rr are heavy to light isotope ratios (15 N/14 N) in the product (residual nitrate) and reactant (or substrate), respectively [16]. Biologically mediated denitrification enriches the residual in both
Water 2016, 8, 385
6 of 18
and 18 O; whereas other sinks result in little or no enrichment. Therefore, the magnitude of 15 N enrichment associated with nitrate removal is quantified through an enrichment factor. The kinetic fractionation factor is typically described in terms of an enrichment factor (ε) as follows:
15 N
ε = (α − 1) × 1000 = ((δp − δr )δr + 1000) × 1000
(3)
where δp and δr are delta values of the product and reactant, respectively. The enrichment factor is negative for most of the nitrogen transformation processes, and in the case of denitrification it has been defined with a range from −40‰ to −3.5‰, which reveals a variety of environmental and experimental conditions [34–36]. The enrichment factor can be estimated from the evolution of the isotopic composition of the residual reactant [18] defined as: ∂r = ∂r0 + εln(NO3 − N) (4) where ∂r is the 15 N or 18 O value of the reactant nitrate at time t, ∂r0 is the initial 15 N or 18 O value of the nitrate, (NO3 ) is the remaining fraction of nitrate, and is the fractionation or enrichment factor [16]. Enrichment factors for 15 N and 18 O in surface waters were determined by regression of 15 N or 18 O on ln(NO3 –N). Finally, the ∂r values are transformed to percentages (%) to obtain the degree of denitrification for each sampling point [37]. To calculate the degree of denitrification from our data, the initial isotopic composition (∂r0 ) was chosen to be the lowest 15 N value during the samplings. 2.4. Reactive Transport Model A simple reactive transport model was developed to reproduce the sampling data from 2008 to 2009. We assess the dynamics of dissolved inorganic nitrogen (i.e., NO3 –N and NH4 –N) in the surface water, through a 1-D reactive transport model for the main stream (Chaminé) of the Roxo catchment area (approx. length 15 km). The one dimensional reactive transport model was developed in the open source software R [38]. The R package ReacTran [39] allows the use of the volumetric advective-diffusive transport function and the reaction-advection equation for a substance given as [40]: (∂Ci )/t = −(1∂QCi)/(Ax ∂x ) + REACi (5) where t is time, and x is the distance along the stream axis, the first term represents transport by the stream flow (advection) and the second term represents (turbulent) dispersion. An assumption is made that the cross-sectional area (Ax ) is constant in time [41], but it varies along the stream axis (x). The chemical state variables in the reactive advection dispersion model C were described in terms of concentration (mg·N·L−1 ). REACi are the main reactions, comprising nitrification and denitrification modeled where: REACNO3 = Nitrification − Denitrification, and REACNH3 = −Nitrification
(6)
boundary conditions for nitrate and ammonium were derived from stream campaigns; upstream and downstream [42]. Nitrification and denitrification rates were taken from the literature. The upstream boundary conditions were specified as follows: the upstream ammonium concentration was taken as 1.1 times the maximal measured nitrate concentration along the stream, while the upstream nitrate concentration was set to be 0. Stream flow was measured in the sampling sites when the water level was sufficient for measurements to be taken. Furthermore, data on the daily streamflow were obtained using precipitation, evapotranspiration, and reservoir storage volume and water use databases, using an inverted reservoir water balance approach. This procedure is based on the estimation of the reservoir inflow, taken from the variation over time of the storage volume of the reservoir and the total outflow from the reservoir [43]. The required rainfall data from 2008 to 2009 was obtained from automatic weather stations located close to the Beja and Aljustrel (Figure 2). Water depth was generally very low (0.1 to 0.5 m) in the streams, and was measured during the fieldwork campaigns. The model was
Water 2016, 8, 385
7 of 18
implemented in the open source software R using R-package ReacTran [39]. It was solved assuming that the concentrations had reached steady-state [39]. Water 2016, 8, 385
7 of 18
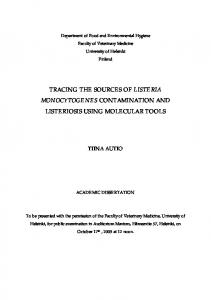
Figure 2. Rainfall (mm) and streamflow (m3∙s−1) data in the Chaminé stream in the Roxo catchment.
Figure 2. Rainfall (mm) and streamflow (m3 ·s−1 ) data in the Chaminé stream in the Roxo catchment.
3. Results
3. Results 3.1. Solutes and Reactive Transport Modelling
3.1. Solutes and Reactive Transport Modelling
Table 2 summarizes the values from physical and chemical parameters taken over three field
campaigns to the streams, pore water and wells (shallow groundwater). The streamflow regime is Table 2 summarizes the values from physical and chemical parameters taken over three field characterized by slow flow velocities (average 0.1 to 0.2 m/s) and shallow flow depths ranging from campaigns to the streams, pore water and wells (shallow groundwater). The streamflow regime 0.05 to 0.5 m, depending on the shape of the local stream cross section. Average annual flow (2003– is characterized by slow flow velocities (average 0.1 to 0.2 m/s) and shallow flow depths ranging 3∙s−1, with seasonal low values at the end of summer of 0.04 m3∙s−1. High daily flow from2009) was 0.10 m 0.05 to 0.5 m, depending on the shape of the local stream cross section. Average annual flow peaks are typically recorded at the end of winter and reached values of up to 1.89 m3∙s−1 in the 3 − 1 (2003–2009) was 0.10 m ·s , with seasonal low values at the end of summer of 0.04 m3 ·s−1 . High February 2009 field campaigns. Stream water temperature averaged 23 ± 8 °C during the entire 3 −1 dailyperiod and electrical conductivity (EC) varied seasonally with values ranging from 789 μS∙cm flow peaks are typically recorded at the end of winter and reached values of up to 1.89 m ·s −1 in ◦ C during the in theMarch 2009 to 3110 μS∙cm February 2009 field campaigns. Stream water temperature averaged 23 ± 8 −1 in September 2009. Stream water showed slightly basic pH values, with entirean period and electrical conductivity (EC) oxygen varied seasonally with values ranging from 789 µS ·cm−1 average value of 8.24 ± 0.88. Dissolved levels in October and November 2008 were on − 1 −1, with water in March 2009 to± 3110 µS·cm in September 2009.2∙LStream showed slightly basic pH average 6.0 1.7 mg∙O 2∙L−1 and 7.7 ± 1.4 mg∙O oxygen significantly increasing in values, a with downstream direction towards the reservoir. an average value of 8.24 ± 0.88. Dissolved oxygen levels in October and November 2008 were on average 6.0 ± 1.7 mg·O2 ·L−1 and 7.7 ± 1.4 mg·O2 ·L−1 , with oxygen significantly increasing in a downstream direction towards the reservoir.
Water 2016, 8, 385
8 of 18
Table 2. Measured values (mg·L−1 ) for nutrients (nitrate-nitrogen, ammonium-nitrogen) and dissolved oxygen, (‰) for stable isotopes, (µS·cm−1 ) for electrical conductivity and (◦ C) for temperature. Descriptive statistics of chemical variables in the stream water, shallow groundwater, and pore water samples during the study period (October–November 2008, March 2009 and September 2009). October 2008
Element Max
Min
Average
November 2008 SD
Max
Min
Average
March 2009 SD
September 2009
Max
Min
Average
SD
Max
Min
Average
SD
15.2 45 15.1 9.8 15.2 20 1854
0.44 0.05 3.2 4.3 0.04 13 685
5.7 3.9 7.0 6.4 5.7 15.8 1190
5.48 11 3.9 1.9 5.5 2.0 291
10 0.45 13.7 13.1 9.8 30.4 3110
0.30 < 4.4 9.1 2.1 19.1 543
3.32 0.2 7.8 11.2 6.7 25.9 1390
3.53 0.15 4 1.8 1.9 3.9 676
25.5 0.5 20.5 15.1 25.5 18.5 996
2.2 0.04 3.29 4.33 2.21 14 664
9.8 0.2 8.9 7.5 9.8 16 848
8.6 0.2 5.7 3.5 8.6 1.5 108
18.2 0.45 10.5 7.4 8.3 24.4 996
0.03 0 3.3 4.3 4.5 20.8 664
6.8 0.18 6.9 6.2 6.2 21.9 832
8.4 0.2 2.6 1.2 1.5 1.7 110
Streams NO3 NH4 15 N 18 O DO T EC
16.5 10.7 11.3 31.1 9.3 25.8 2100
1.27 < 3 4.9 2.2 15.8 789
7.34 1.2 7.5 15 6.0 20.8 1432
5.23 3.6 2.9 7.8 1.7 3.4 483
16.7 10.9 9.8 19.8 1890
1.68 < 3.7 14.7 760
8.32 2.3 7.7 18.3 1340
5.18 2.9 1.4 2.9 384 Wells
NO3 NH4 15 N 18 O DO T EC
20.2 4.5 9.3 23.5 1626
1.7 0 3.4 19.7 507
10.3 0.8 5.9 21.4 873
8.2 1.8 2.2 1.6 389
-
-
-
-
Note: < means below limit of detection in the sample.
Water 2016, 8, 385 Water 2016, 8, 385
9 of 18 9 of 18
Concentrations of NH4–N decreased significantly in the upper reaches of the stream, while nitrate increased (Figure 3a). NO3–N concentrations ranged from 0.3 to 16.5 mg∙N∙L−1, with mean Concentrations of NH4 –N decreased significantly in the upper reaches of the stream, while nitrate values of 7.34 ± 5.23 in October 2008, 8.32 ± 5.18 during November 2008, 5.70 ± 5.48 during March increased (Figure 3a). NO3 –N−1concentrations ranged from 0.3 to 16.5 mg·N·L−1 , with mean values 2009, and 3.32 ± 3.53 mg∙N∙L during September 2009 (Table 2). The highest NO3–N concentrations of 7.34 ± 5.23 in October 2008, 8.32 ± 5.18 during November 2008, 5.70 ± 5.48 during March 2009, were registered in the second (A2) and third (A3) stations after which they decreased through the and 3.32 ± 3.53 mg·N·L−1 during September 2009 (Table 2). The highest NO3 –N concentrations Chaminé stream towards the downstream (Figure 3b), where nitrate values were close the detection were registered in the second (A2) and third (A3) stations after which they decreased through the limit (