Tracing the planning and execution of activities and their attributes - Design and application of a hand-held scheduling process survey Guido Rindsfüser, RWTH Aachen, Germany (corresponding author) Heike Mühlhans, RWTH Aachen, Germany Sean T. Doherty, Wilfrid Laurier University, Waterloo, Ontario, Canada Klaus J. Beckmann, RWTH Aachen, Germany
Conference paper Session XXX Moving through nets: THE PHYSICAL AND SOCIAL DIMENSIONS OF TRAVEL 10th International Conference on Travel Behaviour Research LUCERNE, 10-15. AUGUST 2003
10th International Conference on Travel Behaviour Research ______________________________________________________________________________ August 10-15, 2003
Tracing the planning and execution of activities and their attributes - Design and application of a hand-held scheduling process survey Guido Rindsfüser1 Heike Mühlhans2 Sean T. Doherty3 Klaus J. Beckmann4 1,2,4
RWTH Aachen Institut für Stadtbauwesen und Stadtverkehr Mies-van-der-Rohe-Str. 1 D-52074 Aachen
3
Wilfrid Laurier University Department of Geography & Environmental Studies Waterloo, Ontario, Canada, N2L 3C5 1
Phone: Phone: 4 Phone: Fax: 1 eMail: 2 eMail: 4 eMail: 2
1,2,4
+49 (0)241 80 26204 +49 (0)241 80 25203 +49 (0)241 80 25200 +49 (0)241 80 22247
[email protected] [email protected] [email protected]
3
Phone: +1 (519) 884-1970 Fax: +1 (519) 725-1342 3 eMail:
[email protected] 3
Preferred citation Rindsfüser, G., H. Mühlhans, S.T. Doherty, K.J. Beckmann (2003), Tracing the planning and execution of activities and their attributes - Design and application of a hand-held scheduling process survey, Paper presented at the 10th International Conference on Travel Behaviour Research, August 10-14, Lucerne, Switzerland.
10th International Conference on Travel Behaviour Research ______________________________________________________________________________ August 10-15, 2003
Abstract The development of traffic simulation models has matured considerably in the last few decades to the point where traffic flow simulations in urban areas or on highways have become visually and behaviorally rich. Using such models to accurately forecast the impacts of emerging travel demand management policies and intelligent transportation systems has met with considerable challenge. This is because such policies do not have a consistent or simple impact on a particular groups or particular type of trips generated from a zone in a single time period. Rather, such policies effect people at a very individual level - invoking changes in the nature of the activities that they and the way they are subsequently planned and executed over multiple time periods and space. This process of change - or activity scheduling decision process underlies the generation of trips over time and space. The ability to develop new models of trip generation that replicate and/forecast time dependent O-D matrixes would appear to benefit from a closer examination of underlying decision processes. In particular, the sequence of decision making involved in the scheduling process (included decisions concerning what activities to perform, when, where, and by what mode), and that attributes of activities that effect these decisions (their spatial, temporal and interpersonal fixity/flexibility), need to be investigated. This paper describes a new approach to tracing these underlying activity scheduling decision processes. The goal was to utilize a computerized hand-held survey instrument that allows the gathering of information from subjects as close in time to real decision points. The computerized platform also enables the instrument to automatically trace and/or prompt for certain attributes of the decisions process, such as the sequence of decision inputs, thereby reducing respondent burden. The complete survey includes a pre-interview, exploration of an individual’s activity-repertoire, an initial data-entry, a multi-day main scheduling exercise, and a post-interview, all implemented on a computerized handheld personal digital assistant (PDA). During the scheduling exercise, subjects are instructed to continue adding activities they have planned for future days, but also to make modifications/deletions to activities as they change, and update undecided or partially planned activity attributes. They are instructed to do so whenever a decision about one or more activity-attributes or activities as a whole occurs. All the while, the program automatically tracks the sequence of decisions made, and prompts the user for supplemental information on certain decisions, such as the reasons for the modifications, or when exactly that particular decisions may have been made (this is especially important for tracking impulsive decisions that are entered into the program “after-the-fact”). A pretest conducted in September 2002 and the main survey of 400 individuals in November 2002 to February 2003 demonstrated very good results in terms of user handling and understanding, software functionality and data quality.
Keywords Scheduling, Activity Planning, Decision Process, PDA Survey, EX-ACT, International Conference on Travel Behaviour Research, IATBR
10th International Conference on Travel Behaviour Research ______________________________________________________________________________ August 10-15, 2003
1. Introduction The development of traffic simulation models has matured considerably in the last few decades to the point where traffic flow simulations in urban areas or on highways have become visually and behaviourally rich. Such models depend on input of Origin-Destination (O-D) matrixes that represent travel demands - typically at an aggregated zonal level consisting of homogenous groups of individuals/households. Using such models to accurately forecast the impacts of emerging travel demand management policies and intelligent transportation systems has met with considerable challenge. This is because such policies do not have a consistent or simple impact on a particular groups or particular type of trips generated from a zone in a single time period. Rather, such policies effect people at a very individual level - invoking changes in the nature of the activities that they and the way they are subsequently planned and executed over multiple time periods and space. This process of change - or activity scheduling decision process - underlies the generation of trips over time and space. Recent multi-day/week activity diary surveys, as well as limited activity scheduling and decisions tracing surveys have shown that individuals in homogeneous groups exhibit a combination of routine (or habitual) and variable activity-travel patterns depending the nature of the activities they are performing and the situation - especially in terms of how flexible the activities are in space, time, inter- and interpersonally. The ability to develop new models of trip generation that replicate and/forecast time dependent O-D matrixes would appear to benefit from a closer examination of this underlying decision process. In particular, the sequence of decision making involved in the scheduling process (included decisions concerning what activities to perform, when, where, and by what mode), and that attributes of activities that effect these decisions (their spatial, temporal and interpersonal fixity/flexibility), need to be investigated. This paper describes a new approach to tracing these underlying activity scheduling decision processes. The goal was to utilize a computerized hand-held survey instrument that allows the gathering of information from subjects at regular intervals as close in time to real decision points. The computerized platform also enabled the instrument to automatically trace and/or prompt for certain attributes of the decisions process, such as the sequence of decision inputs, thereby reducing respondent burden.
10th International Conference on Travel Behaviour Research ______________________________________________________________________________ August 10-15, 2003
2. The prior approach: CHASE CHASE (Computerized Household Activity Scheduling Elicitor) was the first computer aided self interview of activity scheduling behaviour as it occurred in reality in the household (Doherty and Miller 2000). The goal was to develop a survey that could track the scheduling process leading up to the execution of a person’s schedule, along with the resulting observed activity-travel patterns. Traditional diary techniques are limited almost exclusively to observed patterns, providing little insights into decision processes. This goal was accomplished through development of a multi-day computerized scheduling interface. The users task over a multi-day period was to keep an on-going record of their scheduling decisions by adding, modifying and deleting activities to their on-screen schedule as they occurred. The program then tracked when each of these decisions was entered, along with prompting for additional information on the reasons for decisions, the exact timing of decisions etc. The computer was particularly important to this task, in terms of organizing prompts and passively tracking information that would be much more complex using paperand-pencil techniques. Initial testing results indicated that this approach revealed a considerable amount of information on the scheduling process and observed patterns, whilst minimizing respondent burden (Doherty and Miller 2000). Many refinements and applications of this approach have followed the original development, including application on the internet (Lee et al. 2000), development of a GIS interface for location and route tracking (Kreitz, Doherty and Rindsfüser 2002), and incorporation of Global Positioning Systems (GPS) (Doherty et al. 2001). Several key development issues that remain include (see also, Doherty 2002 or Mühlhans and Rindsfüser 2000 for more detailed discussion): • desire to track how individual attributes of activities (time, location, involved persons, etc.) are differentially planned • desire to provide an interface that users can access more regularly to improve recall and accuracy • to reduce survey costs and respondent burden
The EX-ACT survey, described in this paper, was developed with these concerns in mind, and represented a unique solution to the problem.
10th International Conference on Travel Behaviour Research ______________________________________________________________________________ August 10-15, 2003
3. EX-ACT Survey Design The Survey EX-ACT is part of the project ILUMASS - Integrated Land Use Modelling and Transportation System Simulation (funded by the German ministry of education and research (Bundesministerium für Bildung und Forschung – BMBF). The main objective therefore is to improve the empirical basis of a scheduling approach integrated in a microsimulation framework of individual behavior. The survey was designed and undertaken by the Institut für Stadtbauwesen und Stadtverkehr, RWTH Aachen (Institute for Urban and Transport Planning – RWTH Aachen University). The software was coded by Interactive Instruments (Bonn, Germany) and the survey data collection was conducted by SOKO-Institut (Bielefeld, Germany).
3.1
Main Components
The project´s main interest focussed on the scheduling behaviour of individuals related to out of home activities (and derived travel), especially the sequences of the planning of distinct activity and travel attributes. The latter implying a desire to trace how the timing, location, involved persons, mode and other attributes of activities are differentially planned. Given this focus, a self-administered and computer-based instrument was considered to have the best chance of capturing the various variables of interest. The successful applications of CHASE and the experiences with a CHASE survey done in Aachen, Germany in 1999 (Mühlhans and Rindsfüser 2000) support that view. The EX-ACT survey builds upon these experiences in several key ways: • Usage of hand-held computers or PDA´s (Personal Digital Assistants) instead of laptop computers as in CHASE. This is a major improvement in terms of the flexibility of the interviewees and a situational data entry. • More in-depth tracking of activity scheduling decisions, including the tracking of entering, modifying or deletion of activities and travel (as with CHASE), but also tracking of how distinct attributes of activities (timing, location, involved persons, mode, etc.) are differentially planned. This represents a significant increase in detail, and conceptually is more behaviourally realistic as people often plan different attributes of activities on different time/space horizons. • Other general improvements in instrument design, concerning forms layout, instrument structure, user friendliness, and preliminary database setup. The EX-ACT survey was completely administered on the PDA, and included the following main components:
10th International Conference on Travel Behaviour Research ______________________________________________________________________________ August 10-15, 2003
1. pre-interview 2. exploration of an individuals activity-repertoire 3. an initial data-entry (already planned activities for the following survey period) 4. a multi-day main scheduling exercise 5. a post-interview In combination, these various instrument components captured the following information (which will be described in more detail below): • Socio-demographic characteristics of the household and the household members. • Details of available and used transport modes (e.g. car fleet, season tickets owned). • Interviewees activity-repertoire, assessed through a series of questions concerning the types of activities they typically perform along with their attributes (such as normal frequency, durations). • One-week continuous activity planning decisions • Two days worth of in-depth planning characteristics. • Resulting/realized activity-travel patterns (as in a traditional diary) Figure1 shows the survey cycle and different survey parts. The goal was to gather information about a variety of activities, including typical (routine or habitual), planned and spontaneous activities. Following this, an initial data-entry period is spent describing activities already planned for the week to follow. At this stage, one or more of the attributes of a planned activity can be left undecided (e.g. “haven’t thought about the location yet”), or only partially planned (e.g. the planned day might be Monday or Tuesday). The pre-interview, the activityrepertoire and the initial data-entry are all completed with the assistance of an interviewer (see also more detailed sections below). During the week to follow, subjects are instructed to continue adding activities (one-week diary) they have planned for future days (using same format as initial data-entry), but also to make modifications/deletions to activities as they change, and update undecided or partially planned activity attributes. They are instructed to do so whenever a decision about one or more activity-attributes or activities as a whole occurs. All the while, the program automatically tracks the sequence of decisions made, and prompts the user for supplemental information on certain decisions, such as the reasons for the modifications, or when exactly that a particular decision may have been made (this is especially important for tracking impulsive decisions that are entered into the program afterthe-realisation). To reduce respondent burden, these supplemental prompts are asked only for a sample of decisions, weighted more heavily towards the end of the survey (since this allows several days in advance to capture scheduling decisions as they evolve). The final component
10th International Conference on Travel Behaviour Research ______________________________________________________________________________ August 10-15, 2003
of the survey is an interviewer assisted post-interview, in which additional information on activities may be asked along with an assessment questionnaire concerning the software and hardware usability.
Figure 1
Cycle and parts of the EX-ACT survey
pre interview,
interviewer contact
instrument setup
activityrepertoire
post interview
activity diary
planning questionnaire
planned behavior including in depth planning questions for day 6+7
realized behavior
day 10
day 1
day 2
day 3
day 4
day 5
day 6
day 7
day 8
day 9
day 10
day 1
Although the initial application will result in the equivalent of a week long activity planning diary plus the tracing of the scheduling decisions, the software has been developed with special settings that allow the researcher to pare down the software so that it may serve as an activity or trip diary alone, or be used for a varying number of days. In addition there are many other settings (including a switch between German and English text version), controlled via a database, which allow specific adjustments in the frequency of supplemental prompts and language settings. Application of the survey on 402 individuals took place from November 2002 to February 2003 in the German city of Dortmund (Westfalia) in the north-east of the “Ruhr-Gebiet”. Dortmund currently has approximately 590.000 inhabitants including about 34.000 university and college-level students. The city was chosen because of the interests in the ILUMASS project and the available detailed supporting data. The instrument was implemented on a COMPAQ iPaq 3850 (PDA) with Windows CE 3.0 operating system and programmed using Microsoft Visual Embedded Tools in Visual Basic. The software automatically starts upon turning on the PDA. Because of the long initialization
10th International Conference on Travel Behaviour Research ______________________________________________________________________________ August 10-15, 2003
procedure when starting the application EX-ACT on the PDA, the interviewees were told to keep the application alive (only turn off the PDA), so that EX-ACT must not be started each time the PDA was turned on and a continuous and fast access was possible during the diary.
3.1.1
Pre Interview
The decision to design a PDA-based instrument makes an initial personal interview essential. Because of the complexity and the specific research interests it would not be possible to guide the interviewees through usage of the hard- and software without personal assistance. During the “Pre Interview”, household, person and vehicle forms are completed interactively. Figure 2 shows two examples of the types of forms used in the Pre Interview to capture public transit information, and household member information.
Figure 2
Two screenshots from the Pre Interview
Additional forms in the Pre Interview were directed to prior decision of the household and their members with major influence on behaviour. This included information on household members, related persons, the available resources in terms of composition of the vehicle fleet,
10th International Conference on Travel Behaviour Research ______________________________________________________________________________ August 10-15, 2003
the membership of organized car-sharing scheme and the availability of telecommunication devices. While some information pertained to the household as a whole, other information was assigned to single household members.
3.1.2
Activity Repertoire
The “Activity Repertoire” is essentially a listing of typical activities along with their salient attributes - including usual start and end times, usual locations for this activity, usual means of transportation. The repertoire fulfils several major tasks. Firstly, it gives respondents an essential idea of the types and details of behaviour of concern in the survey. Secondly, it serves as basis for the diary in terms of providing typical activities and locations that can be chosen from pull down menus for simplified data entry. The repertoire can also be analyzed itself to explore the nature of habitual and routine behaviour. To capture the repertoire, a treestyle view is presented to respondents showing nine main activity categories with multiple sub categories of possible activity type choices, as shown in Figure 3. Respondents choose activities that apply to them, which are subsequently displayed on screen along with their major attributes, so that a clear structure and view to already entered data is provided.
Figure 3
Two screenshots from the Activity Repertoire
10th International Conference on Travel Behaviour Research ______________________________________________________________________________ August 10-15, 2003
3.1.3
Initial Data Entry
The objective of the “Initial Data Entry” is to gather information about activities which are already planned for the upcoming 7 day period of the survey. It is assumed that most everyone will have at least some plans for future activities, with some people having quite elaborate plans. This data is important to the overall approach, since it allows a context during the following days for new data entries, modifications and deletions to occur. Upon entry, respondents are confronted with a set of questions concerning the planning horizon (e.g. “when have you decided to…”) and for the 5th and 6th day of the survey additionally concerning the reasons for decision, as shown in Figure 4. During the seven day main scheduling exercise a period of two days (5th and 6th day) was chosen to gather more detailed information about the planning process and the underlying reasons. This was done to decrease respondent burden, to provide a sometimes changing procedure, and to allow for a type of training period with the instrument before additional questions appear that may have initially over-burdened subjects. Any entry of an activity decisions for the 5th or 6th day or at the 5th or 6th day included additional prompts concerning the trigger for the decision, and the reasons for decisions about planning, modification or deletion of activities, activity attributes, trips, means of transport times and involved persons.
Figure 4
Two screenshots from the Initial Data Entry
10th International Conference on Travel Behaviour Research ______________________________________________________________________________ August 10-15, 2003
Of some debate was the possibility to simply automatically transfer activities from the activity repertoire into the initialisation of the Diary. The problem with this approach is the fact that not all “typical” activities in the repertoire will be planned in any given specific week. In addition, not all attributes of these activities will necessarily be planned. Thus, to realistically capture their planning, no assumptions about the placement of typical activities from the agenda on the initial diary were made, although this was somewhat confusing to respondents.
3.1.4
Main Scheduling Exercise – Activity Planning Diary
Following the pre interview the goals underlying the remainder of the survey were explained to the respondents. These goals included continuous use of the PDA and EX-ACT in order to enter subsequent new activities and their attributes, and any modifications or updates to existing activities and their attributes. These entries were to be made as near to the situation as possible. The possibility to enter attributes with various states of exactness was also possible. For example different levels of exactness for the starttime of an activity can be entered, from “i don´t know” to “in the morning”, “+ - 3h”, “roughly 7:30pm” to “exact 7:32”. Similar degrees of exactness were possible for all other attributes. During the main scheduling exercise a history of device usage and all entries are traced by the device in a database. This enables later analysis of the histories of the planning of single activity attributes and their modification. Once a new activity was entered, the further data added to this activity (e.g. involved persons, times, location) is linked to this activity and only the deletion of this activity or a activity type changing stops the history tracing. For this it is possible to get information concerning the planning status at every time of the observed period. Any new information concerning new activity types, locations, involved persons, etc. not captured in the pre interview are automatically added to the database to further improve and simplify handling. Two screenshots from the scheduling diary are displayed in Figure 5. The screenshot at left depicts the main view of the diary wherein data entry begins. Activities for a single day are listed in sequence according to start times, with all activities having the same height (as apposed to height corresponding to the duration of the activity as in a typical dayplanner). This allowed for a much more compact display required of the PDA. Activity attributes (time, mode, location, involve persons) are displayed in columns. Colour-coding is used to indicate several key attributes of the schedule, including the degree of exactness to which each attribute has been specified. “Green” indicates that entries have been specified very specially or exactly (e.g. start time is 7:32 a.m.). “Yellow” marked entries indicate that the attribute is only partially specified (e.g. start time is “in the morning”). “Red” marked fields indicate that there is a time overlap in adjacent activities that will eventually need to be rectified or
10th International Conference on Travel Behaviour Research ______________________________________________________________________________ August 10-15, 2003
explained. ”Grey” lines additionally indicate where gaps in the diary exist. Based on this information, at carefully selected time periods, the respondents may be reminded to complete various components of their schedule. On the right hand side of Figure 5 is a prompt appearing every time an entry is made “after the fact” (the activity is already undertaken) concerning when the activity attribute decision was actually made. A range of choices is offered, including “Just before execution”, “today”, “yesterday”, etc. (progressively getting longer ago), along with ability to specify that it was a “routine” decision.
Figure 5
3.1.5
Two screenshots from the Activity Planning Diary
Post Interview
The purpose of the Post Interview is to have a chance to review the data with the respondents in person, and to gather some additional information concerning some household and personal characteristics not asked for during the Pre Interview in order to save time. This was because the pre interview was focussed mostly on getting respondents trained to use the survey and capture essential information needed for the scheduler to run effectively. After the interviewer has checked the survey data and if necessary added/corrected data, further characteristics of the person and household were collected, including the availability of telecommunication
10th International Conference on Travel Behaviour Research ______________________________________________________________________________ August 10-15, 2003
devices, residential location, changes in residence, employment, education and monthly income. Figure 6 gives an example of the forms used to collect this information.
Figure 6
3.2
Two screenshots from the Post Interview
Survey Sampling and Application
It is well known, that complex and long duration surveys can only succeed if the survey team is able to notify the interviewee and can build up a personal relationship with them (for example see Axhausen 2002 or different authors in TRB 2000). To support this, incentives, larger than symbolic, but smaller then a true payment for the time the interviewee spent with the survey, are an appropriate tool. Recent practice in Germany and elsewhere support this view (for example see Axhausen 2002). To use this concept of incentive it was decided to pay a small amount (40€) to each interviewee who successfully takes part in the survey and to randomly choose one of the interviewee to be awarded one of the used PDA´s. With respect to sampling, a representative sample of subjects in Dortmund was sought according to household size, age, employment status, and gender, according to the breakdown displayed in Table 1.
10th International Conference on Travel Behaviour Research ______________________________________________________________________________ August 10-15, 2003
Table 1
Sampling quota
Household size
1 person 2 persons 3 persons (min. 1 household member < 18 years old
33 % 33 % 33 %
Age
15 – 18 19 – 40 41 – 65 > 65
15 % 35 % 35 % 15%
Employment status
school/study/other education employed not employed
Gender
female male
25 % 37,5 % 37,5 % 50 % 50 %
In order to be representative spatially, a division of the sample into four location categories with different spatial characteristics was chosen. These four areas can be described as: 1. Area close to the city-centre, with high utilization frequency and a mixture of trade, industry, service and habitation. 2. Area of concentrated housing development, especially flat building, as well as a district centre in pedestrian distance. 3. Residential area with high-order housing situation, especially single occupancy houses, duplex houses and terraced houses, respectively freehold flats in the outskirts of Dortmund. 4. Rural area in the urban sprawl community (Selm).
Recruitment started with a telephone screening. After a brief explanation of the survey general participation willingness was assessed. Those households interested in participation were again contacted by phone through an interviewer to schedule a Pre Interview. The process was supported by an official letter from the city administration. During the whole survey week, the interviewer served as the contact person for the households. Furthermore, a phone hotline was established. Two days after the survey start, subjects were contacted once more by the interviewer in order to find out whether the participant got along with the survey instrument. If needed (some cases), the interviewer made an additional support contact. In all, three waves of telephone calling were initiated. In the first wave, 7137 telephone calls were made, of which 58% (4149) of the persons could not be contacted (answering machine, busy, dial tone, wrong number, etc.). 34 % (2440) of the called persons refused to participate (general refusal, no interest, not part of the interest group of the survey). 463 households were
10th International Conference on Travel Behaviour Research ______________________________________________________________________________ August 10-15, 2003
ready to participate and were passed along to the interviewers. Table 2 gives the results for the second and third waves. Altogether, 574 of the 5115 (11.2%) contacted persons agreed to participate.
Table 2 screening
1st wave
Screening process calls
not reached
refused on contact
not suitable in terms of quota
recruited for personal contact
7137
4149
2440
85
463
nd
1155
329
720
53
53
rd
2158
637
1344
119
58
10.450
5115
4504
257
574
2 wave 3 wave sum
In addition, press releases and advertisements placed in public buildings were used to recruit, especially in the last phase of the recruiting process in order to fill the quotas. This led to recruitment of 621 additional subjects. The survey started with 402 persons (recruited from the 574+621 persons). During the survey, only two participants dropped out. Both were older than 65 years and weren’t able to handle the instrument because of it’s complexity. One interview could not be used for further analyses because of technical problems during the survey week and resulting loss of data. The sample therefore represents 399 persons from 399 households. The composition of the sample with regard to age and survey areas is shown in Figure 7. As a comparison, the corresponding population data from the statistics departments in Dortmund and Selm are shown. As the figure shows, the sample is over-represented by younger people aged 15-19 and the group of 20-39 year old persons living in the city. This was expected given the chosen technical devices and the effort needed to learn and handle the program. The survey started in October 2002 and ended in February 2003. Fifty iPaq 3850 PDA devices were supplied by COMPAQ Germany. The long duration is due to the fact that each cycle of the survey took about 10 days after the Pre Interview, including time to download data and reset the PDA for the next person. Rotation of the devices was established to vary the start day and therefore also the day 5 and 6.
10th International Conference on Travel Behaviour Research ______________________________________________________________________________ August 10-15, 2003
Figure 7
EX-ACT sample in comparison to statistical data from Dortmund (age)
statistics
EX-ACT share [%]
70
60
age
share [%]
7,2
15,5
> 65
32,0
33,7
40-64
39,2
26,8
20-39
21,6
6,0
15-19
17,8
20,7
> 65
33,7
35,1
40-64
20,8
26,7
20-39
27,7
4,4
15-19
11,0
19,8
> 65
32,0
34,2
40-64
41,0
28,6
20-39
16,0
4,4
15-19
8,9
18,7
> 65
20,8
28,4
40-64
66,3
34,1
20-39
4,0
1,8
15-19
12,6
18,6
> 65
28,8
33,5
40-64
42,7
28,6
20-39
15,9
4,9
15-19
50
40
30
20
10
0
10
20
30
40
50
60
part of the city
} } } } }
Selm
Kirchhörde
Hörde/Hombruch
city core
city of Dortmund
70
share [%]
4. Results The following descriptive results are meant to document the experience of respondents with the survey instrument, demonstrate the types and extent of data collected, and also demonstrate the complexity and uniqueness of the gathered data.
4.1
Instrument and Handling
The problems and comments of respondents gathered by interviewers revealed some of the strengths and weaknesses in the survey design. Overall, the scheduling survey and the hardware were not as problematic as expected. The following general impression could be deduced from the statements: Positive items: • The handling of the PDA is simple and intuitive. • EX-ACT is also intuitive and overall simple to understand.
10th International Conference on Travel Behaviour Research ______________________________________________________________________________ August 10-15, 2003
• The survey was fun. • The constant availability of the hotline and the personal support was helpful. Negative items: • Trip and means of transport forms are complicated. • Difference between Activity Repertoire, Initial Data Entry and Diary is not clear. Seems to be unnecessary to enter data twice. • The effort to enter the data was (only by some respondent) remarked as higher than expected. • Some technical shortcoming (power, display light)
To get an impression of the usage of the instrument by subjects throughout the day Figure 8 shows the total number (upper diagram) of entries per hour of the day. It is clear that the subjects used the instrument during the whole course of the day, with a relatively consistent entry between late morning and midnight. This is important, since it suggests that subjects can indeed use the instrument at any time close to when decisions are made, and subjects do not necessarily wait until days end to do such (as was common with CHASE). It also indicates that subjects carry the device with them and enter data as they appear. This is a major advantage compared to existing surveys.
Figure 8
Distribution of Instrument usage over the day
4000 3500
data entries
3000 2500 2000 1500 1000 500 0 1
2
3
4
5
6
7
8
9
10
11
12
13
14
hour of the day
15
16
17
18
19
20
21
22
23
24
10th International Conference on Travel Behaviour Research ______________________________________________________________________________ August 10-15, 2003
4.2
Data Entries
Figure 9 displays the amount of undertaken data entries for the respective survey days and per age category. A data entry is counted for every addition, modification, deletion or update of an activity. Each section of the diagram stands for a specific age category. The box plots show 50% of all persons (respective N) within the box (from 25% to 75%), whereas the lower and the upper line represent 90% of the persons. The dots show some outliners. The line near the middle of the boxes is the respective median. The groups 19-40 and 41-65 exhibited more variability in entries, with some persons entering more than 80 entries per day. At the beginning and the end of the survey the number of entries is high, whereas during the middle days the number decreases with a minimum at the 5th day, presumably because of the upcoming in depth planning questionnaire. But also the burden increases as seen and reported in several other studies (for example see Axhausen 2002 or Doherty and Miller 2000).
Figure 9
Amount of data entries per day and age category
120
80 60 40
80 60 40 20
20 0
0 N = 29 1
29 2
25 26 22 27 3 4 5 6 day of survey period
29 7
120
5
60 40 20
181 2
166 163 162 173 3 4 5 6 day of survey period
179 7
120
age > 65
100 data entries
data entries
N = 189 1
age 41-65
100 80
age 19-40
100 data entries
100 data entries
120
age 15-18
80 60 40 20
0
0 N = 106 1
91 2
89 90 77 82 3 4 5 6 day of survey period
104 7
N = 39 1
32 2
33 38 26 35 3 4 5 6 day of survey period
35 7
10th International Conference on Travel Behaviour Research ______________________________________________________________________________ August 10-15, 2003
Noticeable is the small variability in the 15-18 age group with a broader 50% box on the 5th day, and the highest variety of data entries in the >65 age group. This could be taken as an indication that younger people are more consistently interest in this type of survey, whereas older persons showing varying interest. Alternatively, it may be that young people are more alike in the type of scheduling decisions (entries) they make, whereas the oldest age group contains people of varying degrees of activity, with some very active schedulers and others very passive older people. The 19-20 and 41-65 age groups fall in-between this spectrum. Concerning the question of whether the concept of the selective in depth questions for 2 of the 7 days (i.e. days 5 and 6) was successful in terms of decreasing respondent burden is difficult to determine. Given that the entries on the 5th day are the lowest is counter to what was expected. However, increasing numbers of entries on day 6 and 7 are likely the result of additional prompts to close gaps on the 5th and 6th day along with the additional prompts on these days. Otherwise the number of entries per day appears similar to other surveys, although the drop off mid-week is a bit lower than reported with CHASE (Doherty and Miller 2000). This is most likely due to the greater availability of the PDA on the person, rather than having to wait to start a laptop computer stationed at home which may be more difficult to access. Figure 10 shows that there is a noticeably amount of burden but that it changes depending upon the survey day. The high amount of data entry on the first day could be the result of interest in the new device and willingness to follow the instructions. The high amount on the last day is because of the prompts to fill gaps and give complete and exact information also for previous days (this is further supported by analysis of the entries divided in “after the fact” and “planning” as shown in Figure 15).
data entries per day (means)
Figure 10
30
Data entries (means) for each day (all 399 persons)
30,43
25
24,99 22,78
20
21,65
21,07 18,15
19,78
15
1
2
3
4
day of survey period
5
6
7
10th International Conference on Travel Behaviour Research ______________________________________________________________________________ August 10-15, 2003
Another point is that the interviewees were asked to enter as detailed information as possible. They were instructed to add all activities, even activities with short duration like reading a book or doing the dishes. During the survey these activities are likely to be reported less then in the beginning. At this point a more detailed analysis is needed.
4.3
Trips
The comparison of the daily trips reported in EX-ACT with other (standard) surveys is interesting, because trip rates are more widely available for other sources compared to activity and scheduling pattern data.. Figure 11 shows the comparison of the trip rates of the mobile persons reported in EX-ACT with the two other established German databases (KONTIV and MOP). KONTIV (see www.kontiv2002.de or Kloas and Kunert 1994a, b) is a nationwide travel diary undertaken in 1976, 1982, 1989 and 2002 with ~60.000 interviewed persons and ~180.000 trips (2002). MOP (see Zumkeller, Chlond and Lipps 1999, Chlond 1998 and http://mobilitaetspanel.ifv.uni-karlsruhe.de/index.htm) is a nationwide yearly 1 week panel travel diary with 2.009 interviewed persons and 7.700 trips (2001).
Figure 11
Trips per day (mobile persons)
4,5 4,0 3,5
3,63 3,75 3,71
3,63
3,80 3,71
3,79 3,64 3,77
3,61
3,84 3,82
3,81
3,94 4,04 3,66
trips per day
3,0
3,20
3,24
KONTIV `89
3,31 2,93
2,73
2,5
2,40
2,0
EX-ACT 2003 MOP 2001 KONTIV 2002
1,5 1,0 0,5 0 mon
tue
wed
thu
fri
sat
sun
day of the week
mobile
381
373
361
367
376
369
316
immobile [%]
4,5
6,5
9,5
8,0
5,8
7,5
20,8
} EX-ACT
2003
10th International Conference on Travel Behaviour Research ______________________________________________________________________________ August 10-15, 2003
Interestingly, the latest KONTIV (2002) survey resulted in the highest reported trip rates, although traditionally, previous KONTIV surveys have always resulted in significantly lower trip rates then any other singular survey. The now higher values are likely the result of improved forms and survey processes (DIW and infas 2003 and Engelhardt et al. 2002). The trip rates from EX-ACT are a bit lower then those from KONTIV and MOP, although the difference was not significant. Although activity diaries are often expected to reveal high trip rates than traditional trip diaries, it was not the case here. It is most likely that the additional effort of in-depth surveys such as this one produce lower trip rates because of the fact that more engaged persons would be less willing to participate in such surveys and that these persons undertake more trips. The low rates of immobile persons per day from the EX-ACT survey ~4-5% lower then the KONTIV rates of immobile persons support that interpretation. But nevertheless, the EX-ACT data is not significantly different to well established databases, although the quota isn’t taken in account and there was no weighting of the data with respect to real world statistical data. For that, a comparison may be risky, but shows, that the produced data is not unnormal.
4.4
Activity Repertoire
Taking a deeper look into the activity data, the first step was to get examine the activities in the activity repertoire. As explained above, subjects were asked to specify information about “typical” activities for the upcoming week, along with their typical attributes. Typical activities are those that are usual, routine or habitual undertaken at regular intervals or from time to time on a normal day under normal circumstances, excepting yearly holiday or conference trips or similar activities. The average number of activities in subject’s repertoires was 23.4, with a minimum of 7 and a maximum of 67. The repertoires also contained attributes of each activity, with respect to regularities, usual start/end times, different alternatives of location, and mode alternatives. Analysis of such is left for future research, but shall serve to shed light on flexibility and variability of activities. Figure 12 shows the percentage of activities appearing in each subject’s activity repertoire. As expected basic needs are nearly in every subject’s repertoire. Normally the value should be 100%, which suggests that some of the data may require further assessment and possible rejection from future analysis. Whereas all other activities (categories) are at least in 75% of the repertoires, personal business and pick up / drop off are in only ~35% of the repertoires. This may be because there is a special task allocation between the household members.
10th International Conference on Travel Behaviour Research ______________________________________________________________________________ August 10-15, 2003
As can be seen in the data (not displayed here) the repertoire was sufficiently detailed such that most categories included only 1 specific activity. Overall, the diagram suggests that the 38 predefined activity subcategories were reasonably sufficient. The largest exception was for “studying” (mean of 6.4 activities per repertoire) – a category that came to include a large number of specific activity types such as courses, homework, learning at home, etc.
Figure 12
Percentage of Activities Reported in Each Subjects Activity Repertoire (399 repertoires, 9578 activities)
100 90 80
share [%]
70 60 50 40 30 20 10
personal home shopping business related
leisure
social activities
else
pick up / drop off kids
get visited
pick up / drop off else
talk / phone
visits
restaurant
time for family
honorary post (function)
computer
honorary post (social)
go out
cultural consumption
leisure else
playing
occupation
sports (unbounded to place)
leisure trip
sports (bounded to place)
take courses (private)
ggoing to the authorities
shopping else
personal business
shopping (major items)
shopping (for personal use)
manual works
daily shopping
dmestic matters
business related
study
work school study
take courses (business)
school
side job
job seek
relax
basic needs
main employment
meals
sleep (night)
0
pick-up drop-off
Note: The lighter block in the background is the equivalent value for the respective activity category as a whole
4.5
Reported Activities during the Diary
As shown in Figure 13, the average number of reported activities per day was 9.8, varying somewhat by day of the week. The day with the highest reported activities is the Monday; the one with the lowest reported activities is the Friday. The difference is nearly 1 activity. Although a slight decline is evident, it does not continue throughout the week, suggesting that
10th International Conference on Travel Behaviour Research ______________________________________________________________________________ August 10-15, 2003
the decline in reported activities is not likely due to respondent fatigue effects, but rather differences in activity participation rates by day. As displayed in Figure 14, the total number of reported activities for the week per person ranges widely, from 11 to 168. Most of the persons reported conducting between 40 and 80 activities during the 7 days. The high number is reflective of how the instructions given to subjects to record nearly every detailed activity including the same activity on multiple days (which are counted separately even though it is the same activity, such as breakfast every morning). A comparison with other surveys is difficult because of the different activity different categories, different definitions and the different consideration of in home activities. Although travel definitions have been standardized, the same is not true for the definition of activities (e.g. Axhausen 2001).
Figure 13
Average Number of Reported Activities per day per person (399 persons, 27420 activities)
11 10
10,6
9
10,1
10,0
10,1
9,8
9,6
9,5
9,7
thu
fri
sat
sun
all
activities per day
8 7 6 0 m on
tue
wed
day of the week
Min
1
1
1
1
1
1
1
1
Max
34
34
32
37
28
33
32
37
As displayed in Figure 14, the total number of reported activities for the week per person ranges widely, from 11 to 168. Most of the persons reported conducting between 40 and 80 activities during the 7 days. The high number is reflective of how the instructions given to subjects to record nearly every detailed activity including the same activity on multiple days (which are counted separately even though it is the same activity, such as breakfast every morning). A comparison with other surveys is difficult because of the different activity categories, definitions and the consideration of in home activities. Although travel definitions
10th International Conference on Travel Behaviour Research ______________________________________________________________________________ August 10-15, 2003
have been standardized, the same is not true for the definition of activities (e.g. Axhausen 2001).
Figure 14
Frequency/cumulative Distribution of the Total Number of Reported Activities per Week per Person,
100
90
90
80
80
70
70
60
60
50
50
40
40
30
30
20
20
10
10
0
Cumulative frequency
activities per 7 days
100
0 150 150
a m o u n t o f o b s e rv ed d iffe ren t a c tiv itie s
4.6
Planning steps
A first impression of the underlying planning steps and decision points was given through the diagram about data entries. In Figure 15 the skipped days, or days without any data entry, are displayed. 183 persons of the 399 sample used the instrument every day, another 80 persons skipped only 1 day. 136 persons skipped more than 1 day. In terms of the goals of the survey (i.e. to provide for frequent data entry close to actual making of decisions) this is somewhat disappointing. On the other hand, a high proportion of people hardly skipped days at all – including 263 who skipped at most one day. In the least, these latter databases would be highly suitable for analyses of planning behaviour. Those subjects who skipped 3 or more days should be examined more closely and possibly reject for certain types of analysis, especially planning behaviour.
10th International Conference on Travel Behaviour Research ______________________________________________________________________________ August 10-15, 2003
Figure 15
Skipped days
50%
180
45%
160
40%
140
35%
120
30%
100
25%
80
20%
60
15%
40
10%
20
5%
0
Figure 16
0
1
5
0%
6
Scheduling decision by when they were entered into the program: same day as the activity occurred (0), after the activity (“after-the-fact”, negative values) and before the activity occurred (“planned”)
„after the fact“
20%
share of data entries
2 3 4 survey days without data entry
share
200
„planning“
100%
16%
80%
12%
60%
8%
40%
4%
20%
0%
0% -6
-5
-4
-3
-2
-1
0
1
2
planning horizon data entry for survey day X
3
4
5
6
cumulative share of data entries
persons
suitable for analyses of planning behaviour
10th International Conference on Travel Behaviour Research ______________________________________________________________________________ August 10-15, 2003
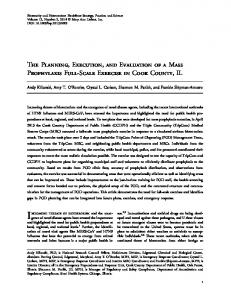
Another good indicator of the nature of the planning behaviour data is the proportion of data entries recorded “after-the-fact” (i.e. scheduling decisions entered into the EX-ACT program after the activity occurred) versus those entered or “planned” before-the-fact (i.e. scheduling decisions entered concerning future activities that have not occurred yet). This is a good indication of the level of “tracing” of scheduling decisions that is occurring as a result of deploying a multi-day survey versus “reporting” after-the-fact. As can be seen in Figure 16 ~ 11% of the total data entries are made for decisions that occurred on the same day (day 0). Nearly 50% of all data entries are made before-the-fact for future days. The remainder (39%) are entries for previous days made “after the fact”, which are often made to complete previous entries or record impulsive decisions that, by their nature, could not have been captured before-the-fact. The high number of planned and same day entries is considerably good sign that the multi-day entry survey design was successful in tracing a large portion of scheduling decisions. To get a better idea of how the various scheduling decisions are sequenced and recorded leading to a final observed activity, consider example displayed in Figure 17. The scheduling decisions for each activity/trip attribute are reconstructed as they were made over time, leading to the final realization of the activity
Figure 17
A single planning/decision sequence
initialisation
day 1
day 2
day 3
day 4
day 5
day 6
day 7
time monday 4:00pm
activity type
activity / attributes
day start-/end time
going out
wednesday 3:37pm
wednesday 3:50pm
sunday 10:31am
saturday evening
8:10-..pm
8 -11:30pm
exactly
+ - 2h
..-0:10am exactly
„Bella Italia“
location
car
mode trip starttime
kind of decision
sunday 10:30am
start of realisation
restaurant
exactness time
exactness trip starttime
friday 2:24pm
planned after a call
planned
planned
7:40pm
7:45pm
roughly
exactly just before realisation
planned
spontaneous during realisation
10th International Conference on Travel Behaviour Research ______________________________________________________________________________ August 10-15, 2003
Entries made after the activity was conducted/realized, are subject to a query for the when they were actually planned. For entries made before-the-fact, it is assumed that the decision was made near to the data entry. As can be seen, the amount of planning and modification differs for each attribute. Future analysis should explore in more detail the measure of time distance between first entry and realisation, as well as tabulate to what extent attributes are planned differently.
5. Conclusions This initial analysis of the EX-ACT data is meant to describe and assess the quantity and quality of the resulting data, rather than explore theoretical or conceptual ideas. Several overall conclusions are possible. In general, the use of the hardware device (PDA) and design of the custom designed software (EX-ACT) could be deemed a relative success, given the high number of observed activities that were recorded, the similar numbers of trips recorded per day compared to standard surveys, the high number of subjects who did not skip many scheduling days, the high proportion of scheduling decisions entered before-the-fact, and the reasonably sustained amount of data entry over the multi-day period of the survey. Additional anecdotal evidence suggests that not only younger people but also the older ones enjoyed the technique and had fewer problems with the device than expected. It should be pointed out that the intensive and personalized support offered by the marketing firm that conducted the survey, and the contributions of well structured survey design and programming team, were additional keys to this success. Like any analyses, many additional questions arise that may serve as a basis for deeper probes into to the data. The analysis of activity repertoires is relative new and complex. The number of activities and how to classify them could benefit from further analysis, characterization and possible standardization. On the other had, further probing of the attributes of activities (such as usual start and end times, usual locations) may result in new, more flexible categorizations of activities that do not rely as heavily on the generic activity labels assigned to them. Attempting to assess interviewee bias in the collection of such data should also be assessed – since individual knowledge concerning the goals of the research differs and the interviewees do their own interpretations of what “typical” activities are. The analyses concerning the repertoire therefore have to be careful and with respect to the complexity and the respondent differences. The analyses of the planning behavior presented in this paper are of a general over-view nature, and is meant to assess whether further analysis is possible. The high proportion of scheduling decisions made before the fact suggests that the instrument was particularly
10th International Conference on Travel Behaviour Research ______________________________________________________________________________ August 10-15, 2003
successful in allowing for the capture of scheduling decisions close in time to when they were made. Examining this data in more detail would appear to be justified in the search for deeper insights into the nature of the scheduling process. As a start, this should include analysis of the sequencing of planning decisions, how different activity attribute are planned, the nature of the modification process over time, and differences between the first entry and realisation of an activity. Longer term efforts should focus on development of rules and models that could be used in simulation models of the activity scheduling process. A major question before this occurs is how to evaluate the quality of single subject datasets for the analyses – i.e. what constitutes good versus poor quality scheduling decision data? New procedures for data testing are certainly required given the lack of experience with this type of data. Of particular concern is whether the limiting of detailed scheduling prompts to 2 highlighted days (5 and 6) will increase the quality of the data. The interviewees were surprised and a bit confused about this irregularity in the survey. A deeper look in the structure of the skipped days could be useful to see whether the “normal” survey days or the “highlighted” survey days the most skipped days. Assessing the potential instrument bias should also be attempted. During the conception of the instrument, several alternative design were considered that departed from past scheduling surveys that resembled standard “calendar” type displays. EX-ACT adopted a “list” style display (activities of equal length presented in a list), showing only one day at a time, This was expected to reduce the fill-in bias – the tendency for people to want to fill-in gaps visible on screen. Showing fewer days was also meant to reduce showing too much information back to users in a way that does not match what they have in memory. Assessing whether these biases were reduced will require comparison to other surveys results, or controlled experiments in the future. In terms of future survey design, there are several key opportunities. Most important is a desire to further reduce the respondent burden in the survey. Acquiring such in-depth data requires a considerable commitment on the behalf of subjects, despite advances in the convenience of the instrument (i.e. making it hand-held) and other attempt to reduce burden (e.g. selected days for in-depth prompts). Acquiring some portions of the data by automated or less intrusive means is a priority. To this extent, the future integration of person-based tracking devices would appear particularly amendable, such as GPS (Global Positioning System). This could provide the opportunity to passively track an individuals observed/realized travel movements (and mode) and activity stops, leaving more time to concentrate on recording scheduling decisions. Whilst the hardware platform is clearly amendable to this (off-the-shelf GPS technologies currently exist that link to PDA to trace a person’s location second-by-second), considerable software changes would be needed to read, display and match the GPS data to relevant scheduling decisions.
10th International Conference on Travel Behaviour Research ______________________________________________________________________________ August 10-15, 2003
Acknowledgements This research EX-ACT and the project ILUMASS are supported by a grant from the German Ministry of Education and Research. Special thanks to Interactive Instruments in Bonn, and especially Thomas Pohlmann for his programming and ample support. Thanks also to COMPAQ for agreeing to provide hardware for the project.
References Axhausen, K.W. (2001) Activity-based modelling: Research directions and possibilities. Arbeitsbericht Verkehrs- und Raumplanung, 48, Institut für Verkehrsplanung, Transporttechnik, Straßen- und Eisenbahnbau, ETH Zürich, Zürich, Schweiz. Axhausen, Kay W., A. Zimmermann, S. Schönfelder, G. Rindsfüser and T. Haupt (2002) Observing the rhythms of daily life: A six-week travel diary. Transportation, Kluwer Academic Publishers, 29, (2), 95-124. Chlond, Bastian, Oliver Lipps and Dirk Zumkeller (1998) Begleitung und Auswertung der laufenden Erhebungen zum Mobilitätsverhalten sowie zu Fahrleistungen und Benzinverbrauch. Internationales Verkehrswesen, Vol. 50, (1+2/98), 36-37. DIW and infas (2003) Mobilität in Deutschland - Projektpräsentation Juni 2003. Im Auftrag des Bundesministeriums für Verkehr, Bau- und Wohnungswesen. http://mobilitaetspanel.ifv.uni-karlsruhe.de/index.htm. Doherty, S.T. (2002) Interactive Methods for Activity Scheduling Processes. In: Goulias, K. (Ed.), Transportation systems planning: methods and applications. CRC Press, New York. Doherty, S.T. and E.J. Miller (2000) A computerized household activity sheduling survey. Transportation, 27, (1), 75-97. Doherty, S.T. et al. (2001) Moving beyond Observed Outcomes: Integrating Global Positioning Systems and Interactive Computer-Based Travel Behavior Surveys. Transportation Research Circular, Transportation Research Board, National Research Council, Washington D.C., No. E-C026, 449-466. Engelhardt, K. et al. (2002) Mobilität in Deutschland - Kontiv2002: Repräsentative Daten zum Personsnverkehr / Design und Erhebung. Internationales Verkehrswesen, 54, (5/2002), 206-209. Kloas, J. and U. Kunert (1994a) Über die Schwierirgkeit, Verkehrsverhalten zu messen. Die drei KONTIV-Erhebungen im Vergleich - Teil I. Verkehr und Technik, 3, 91-100. Kloas, J. and U. Kunert (1994b) Über die Schwierirgkeit, Verkehrsverhalten zu messen. Die drei KONTIV-Erhebungen im Vergleich - Teil II. Verkehr und Technik, 5, 187-197. Kreitz, Marion, Sean T. Doherty and Guido Rindsfüser (2002) Collection of Spatial Behavioral Data and their Use in Activity Scheduling Models. Paper, 81st Annual Meeting of the Tranportation Research Board, January 13-17, Washington D.C.
10th International Conference on Travel Behaviour Research ______________________________________________________________________________ August 10-15, 2003
Lee, M.S. et al. (2000) Conducting an Interactive Survey of Household Weekly Activities via Internet: Preliminary Results from a Pilot Study. In Hensher, D. (Ed.), Proceedings of the 9th International Association for Travel Behaviour Research Conference, Gold Coast, Queensland, Australia July 2-7, Mühlhans, H. and G. Rindsfüser (2000) Computergestützte Erhebung und Analyse des Aktivitätenplanungsverhaltens. SRL, 68, Institut für Stadtbauwesen und Stadtverkehr, Aachen, S. 69-78. TRB (2000) Transport Surveys: Raising the Standard. Number E-C008, Transportation Research Board, Washington. Zumkeller, D., B. Chlond and O. Lipps (1999) Das Mobilitäts-Panel (MOP) - Konzept und Realisierung einer bundesweiten Längsschnittbetrachtung.


![[PDF] Strategic Healthcare Management: Planning and Execution ...](https://m.moam.info/img/260x300/pdf-strategic-healthcare-management-planning-and-e_64780257097c474e708c5656.jpg)