Tracking the Random Surfer: Empirically Measured Teleportation Parameters in PageRank David F. Gleich∗
Paul G. Constantine
Dept. of Computer Science University of British Columbia Vancouver, BC
[email protected]
Optimization and Uncertainty Quantification Sandia National Labs Albuquerque, NM
Abraham D. Flaxman
[email protected] Asela Gunawardana
Institute for Health Metrics and Evaluation University of Washington Seattle, WA
Microsoft Research Redmond, WA
[email protected]
[email protected]
ABSTRACT PageRank computes the importance of each node in a directed graph under a random surfer model governed by a teleportation parameter. Commonly denoted alpha, this parameter models the probability of following an edge inside the graph or, when the graph comes from a network of web pages and links, clicking a link on a web page. We empirically measure the teleportation parameter based on browser toolbar logs and a click trail analysis. For a particular user or machine, such analysis produces a value of alpha. We find that these values nicely fit a Beta distribution with mean edge-following probability between 0.3 and 0.7, depending on the site. Using these distributions, we compute PageRank scores where PageRank is computed with respect to a distribution as the teleportation parameter, rather than a constant teleportation parameter. These new metrics are evaluated on the graph of pages in Wikipedia.
Categories and Subject Descriptors H.3.3 [Information Storage and Retrieval]: Information Search and Retrieval—Search process
General Terms Algorithms, Measurement, Human Factors
Keywords PageRank, teleportation parameter, toolbar data, click trail analysis, empirical click probability, Wikipedia
1.
INTRODUCTION
PageRank is a technique to estimate the importance of a node in a directed graph based on the stationary distribution ∗
Corresponding author.
Copyright is held by the International World Wide Web Conference Committee (IW3C2). Distribution of these papers is limited to classroom use, and personal use by others. WWW 2010, April 26–30, 2010, Raleigh, North Carolina, USA. ACM 978-1-60558-799-8/10/04.
of a particular random walk in the graph [21]. This random walk models a memoryless random surfer browsing around the web. (Other interpretations of this walk or the PageRank vector exist too, see [11] and [1] for two possibilities.) Once at a node in the directed graph, the random surfer has two choices: 1. move to a new node from the set of out-edges, or 2. do something else (for example: close the browser, enter a search query, navigate to a bookmark, and so on). The probability of the first action is commonly known as the damping parameter in PageRank. The second action is called teleporting. Usually, this choice is modeled by the surfer picking a node at random according to a chosen distribution. Mathematically, the PageRank model describes a Markov chain and the stationary distribution is the PageRank vector. Let the row-stochastic matrix P describe a random walk on a directed graph G. (We note that most implementations of PageRank always use a uniform random walk where the probability of picking any out-edge adjacent node is uniform. We use such a walk in our experiments, but the model is more general. Also, we’ve assumed that dangling nodes have been patched in some fashion. Our experiments use the standard patch of linking these nodes uniformly to all other nodes in the graph [15].) The PageRank Markov chain is then described by the following row-stochastic matrix M = αP + (1 − α)E where E is a stochastic matrix describing what happens when the surfer does something else and α is the damping parameter. Under the model where the surfer picks pages according to a distribution, E = evT – where e is a vector of ones and v is the teleportation distribution vector with positive entries and unit 1-norm. A common choice for v is just a uniform distribution: v = (1/n)e where n is the total number of nodes in the graph G. Using this definition of E, the PageRank vector is the unique solution of M T x = x with eT x = 1: M T x = αP T x + (1 − α)veT x = x.
2.
This system is equivalent to solving the linear system (I − αP T )x = (1 − α)v.
(1)
which we take as our definition of the PageRank vector. There are many choices and small modeling decisions in PageRank. In this paper, we focus on α. In particular, we ask the question: what should α be? In a broad sense, there is no single answer to this question; the choice of α is dependent on the application. For example, the PageRank vector may be integrated with a machine learning framework for web search [19], it may be used as a fix for fitting graph functions on any directed graph [31], or it may be used to predict missing gene or protein functions [18, 9]. In these cases, a good choice of α is the one that produces the web search results, fitted functions, or predictions under a natural metric from these applications. In ref. [22], the authors suggest choosing α = 0.15 for correlated item discovery in a multimedia database. PageRank is also often used as a centrality measure for a graph [14]. For these uses, we conjecture that good choices of α may depend on a topological property of the graph such as number of strongly connected components, number of self loops, and so on. For the particular application of web link analysis [29], the random surfer model has a natural interpretation. That is, the importance of an item depends on the probability that someone will follow a link to it. This model suggests a choice for α: measure the probability that people follow links on the web, and set α to that probability. In this paper, we follow this approach and explore its ramifications. That is, we investigate ways of measuring how often people click on links when browsing the web and use these measurements to drive a PageRank process. The remainder of the paper proceeds as follows. Section 2 We discuss related work, including other approaches for incorporating user behavior into link analysis metrics and analysis of web browsing behavior. Section 4 We explore two techniques for measuring the value of α empirically. One is based on browser toolbar logs, the other is based on analytics logs from a website. Each technique produces a distribution of values of α. Section 5 We review computing PageRank where α has a continuous distribution and compare a faster approximation for a discrete distribution. Section 6 We show the top pages from our methods on a link graph from Wikipedia, and a comparison of the ranking vectors produced. In summary, our major contributions are • We propose using a PageRank damping coefficient α based on user behavior on the web. • We measure user behavior on the web and find that these coefficients fit a Beta distribution with a mean that varies between 0.3 to 0.7 depending on the website. • We report results of an empirically defined α on a web graph from Wikipedia. This approach appears to reduce the number of category pages at the top of a PageRank ordering.
RELATED WORK
There are three broad classes of related work. The first set of related work regards PageRank as a function of α and proposes a choice based on the theoretical properties of this function (section 2.1). We will use some of the results about PageRank as a function of α, although our choice of α is different. The second set investigates incorporating user behavior metrics into link analysis techniques (section 2.2). These ideas mirror our idea of using user derived data to pick α – we think our final approach is simpler, however. The third and final set of related literature discusses overall user behavior on the web (section 2.3).
2.1
PageRank as a function of α By analyzing the PageRank function on graphs with a bow-tie structure, Boldi et al. [5] show that α should not be too close to 1. A graph with bow-tie structure has (among other properties) a large, strongly connected component and a number of rank buckets – non-trivial terminal strongly connected components. These rank buckets have all the PageRank mass in the limit as α → 1, rather than in the large strong component. Later, Avrachenkov et al. [2] extended this analysis to the total PageRank mass in the largest strong component and suggested that α = 0.5 is a good choice for α if the goal is preserving mass in the strong component. 2.2
User behavior in link analysis algorithms
The first study marrying link analysis with user behavior was by Huberman et al. in 1998 [12]. They proposed a Markov model for web surfing based on measuring the probability that surfers follow paths of length `. More precisely, they model the number of surfers after ` clicks as n` = f (`)(P T )` n0 where n` is a vector of the number of people on a given node in a graph after ` clicks, P is the row-stochastic matrix from the introduction, and f (`) is the probability distribution function of path lengths among web browsers. Empirically, they saw that f (`) follows an inverse Gaussian distribution. Later studies proposed other methods to integrate user records. These are all based on the idea of using a weighted graph structure, where the weights come from user defined behavior. Miller et al. [17] build a weighted adjacency matrix for the HITS algorithm by counting link transitions. Wang [26] modifies the HITS algorithm to incorporate user defined link transition probabilities into a sub-stochastic transition matrix. Likewise, ref. [30] suggests adding implicitly generated links from web site usage logs to a web graph before running an algorithm like PageRank. Finally, there are two recent extensions of these ideas: BrowseRank algorithm [16] and user-sensitive PageRank [3]. For BrowseRank, the authors propose a continuous time Markov chain for link analysis. The transition rates and holding times for various websites are derived from browser toolbar logs. For user-sensitive PageRank, they incorporate observed page transitions and user segment modeling to derive an extension of the PageRank system. This includes models for page dependent teleportation parameters. In contrast, our proposal is just a simple modification of the PageRank process that does not require a tremendous amount of other data.
Table 1: A summary of the notation used in this paper, along with the section that describes it. n the number of nodes in a graph §1 P row stochastic matrix for a random walk §1 α the damping parameter in PageRank §1 v the teleportation distribution vector §1 x the solution of a PageRank problem §1 a b µ ν τ Beta ZIBeta InfBeta
xh xq
2.3
a parameter of the Beta distribution a parameter of the Beta distribution the mean of the Beta distribution the probability of 0 in the zero-inflated or zero-and-one-inflated Beta distribution the probability of 1 in the zero-and-oneinflated Beta distribution a Beta distribution with parameters a and b written Beta(a, b) a zero-inflated Beta distribution with parameters a, b, ν written ZIBeta(a, b, ν) a zero-and-one-inflated Beta distribution with parameters a, b, ν, τ written InfBeta(a, b, ν, τ )
§4.1 §4.1 §4.1 §4.1
a histogram approximation to PageRank with a distribution a Gaussian quadrature approximation to PageRank with a distribution
§5.1
§4.1 §4.1 §4.1 §4.1
§5.2
User behavior on the web
We highlight two studies of user behavior on the web and summarize the findings. An early study of user behavior on the web is Catledge and Pitkow, 1995 [6]. They found that the length of paths users browse in the web quickly decays with path length, but did not match this decay to a distribution as Huberman et al. did later [12]. Recently, White and Drucker conducted a study of user behavior based on browser toolbar logs [27]. They concluded that there are two types of web surfers: navigators and explorers. Navigators follow roughly linear paths when browsing the web, and explorers frequently backtrack.
2.4
Summary
The studies mentioned above mainly focus on the links clicked or the length of a click path; none attempt to measure the frequency of clicked links as modeled by the parameter α. In what follows, we describe one method for measuring α using a few easily obtained user statistics. In contrast to other methods integrating usage patterns with web search, we avoid bulky search logs and excessive preprocessing.
3.
NOTATION
Before describing the methodology of the paper, let us briefly summarize the notation we adopt. Table 1 presents the notation in three groups: PageRank, Beta distributions, and quadrature rules. We further mention that bold, uppercase roman letters are matrices and bold, lowercase roman letters are vectors. Everything else is a scalar. Fitted values are denoted with “hats”, for example a ˆ and ˆb are fitted coefficients for the Beta distribution. Likewise, “barred” variables, µ ¯, are sample estimates.
4.
MEASURING THE DISTRIBUTION
As mentioned in the introduction, this paper addresses the question: what should α be? Let us propose an answer to this question for a random surfer model on a graph of links between web pages. In such a model, the value of α for a single person is clear. It is the probability that this person clicks a link on the web and can be measured by the ratio α≈
number of pages viewed after clicking a link . total number of pages viewed
(2)
For a group of users, picking α is more complicated. In a previous publication, two of the authors identified an issue with the above approximation applied to computing PageRank for a group of users [7]. This issue arises because PageRank is a non-linear function of α. We adopt an alternative approach that measures α for each user and approximates the measurements by a continuous distribution. That is, for each user in a group, we compute a value of α using the formula above (and some details addressed below), and fit a probability distribution to these empirically measured values of α. Loosely speaking, browser toolbars collect precisely this type of information. That is, the Microsoft, Yahoo!, and Google browser toolbars – which users download and install into their browsers for a few improvements – collect this data and send it back to Microsoft, Yahoo!, and Google. (Each company ensures that users provide at least opt-out consent.) Toolbar logs, then, have the information to measure values of α for individual users. Another approach is to measure α based on application usage logs from a single website. From these logs, we have fine control over what constitutes a page and a page view. This is important in light of the divorce between a web page (as defined by a browser) and an updated web page (as defined by a user). That is, for many sites, clicking a link may call a JavaScript function that causes a piece of the current page to change. Parsing an application’s logs to recreate a click trail allows us to incorporate these behaviors into a value of α. We investigate computing values of α using browser toolbars in section 4.2 and application logs in section 4.3. In both of these cases, we find the data fit a Beta probability distribution – although with different shape parameters. At the end of this section, we review the data analyzed along with the Beta fits. We begin our discussion with a review of the Beta probability distribution.
4.1
The Beta distribution
The Beta distribution is a continuous distribution with finite support – usually taken to be the interval [0, 1] – and governed by two shape parameters, a > 0, b > 0. It has the density function f (x; a, b) =
1 xa−1 (1 − x)b−1 , B(a, b)
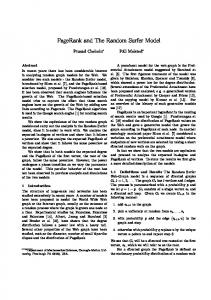
where B(a, b) is a normalization constant to make this a probabilityR distribution. It is defined via Euler’s Γ function, 1 B(a, b) = 0 xa−1 (1 − y)b−1 dx = Γ(a + b)/(Γ(a)Γ(b)). The a mean of the Beta distribution is µ = a+b and the variance is ab σ = (a+b)2 (a+b+1) . For the remainder of the document, when we write Beta(a, b)
InfBeta( 3.2 , 2.0 , 1.9e−05 , 0.0019 )
3.0 2.5
density
2.0 Beta(17,3) Beta(5,3) Beta(2,2)
1.5 1.0 0.5
Beta(1,1)
0.0 0.0 0.0
0.2
0.4
0.6
0.8
Figure 1: The Beta probability distribution function has two shape parameters a and b. Varying these parameters produces a wide range of shapes. we mean the density f (x; a, b). The two shape parameters a and b lend this distribution a huge degree of modeling flexibility. Picking a = 1 and b = 1 converts the distribution to a uniform choice. Figure 1 shows how the shape of the density varies with the parameter. As defined above, the Beta distribution cannot model nonuniform densities with any probability mass at 0 or 1. An extension of the Beta distribution – dubbed the inflated Beta distribution – incorporates the possibility of 0 or 1 [20]. It does this by mixing the continuous Beta density with a discrete distribution. In this paper, we use the zeroinflated Beta distribution and zero-and-one-inflated Beta. The zero-inflated Beta distribution is 0 with probability ν or a Beta with shape parameters a and b with probability 1 − ν. Formally, this density is f (x; a, b, ν) = νI[x = 0] + (1 − ν)f (x; a, b). For the remainder of the paper, we refer to the zero-inflated Beta density as ZIBeta(a, b, ν) and the zero-and-one-inflated Beta (with probability τ at 1 and density similarly defined) as InfBeta(a, b, ν, τ ).
4.2
Browser toolbar logs
We conducted two studies using toolbar logs from Microsoft. In the first, we investigate values of α from users browsing anywhere on the web. In the second, we investigate values of α while users browse Wikipedia. The second study serves dual purposes: (i) investigating whether or not the denser link structure of Wikipedia [13] changes browsing behavior; and (ii) checking if PageRank with an appropriate distribution of α produces better results (see section 6).
Experiment 1: Browsing on the web. For the first experiment, we sampled users from the Microsoft toolbar logs for a period of one week. In this case, a user is a unique computer. This may include computers with multiple users, such as shared home computers or public computers. Although we have no information about the frequency of such machines, we expect them to be relatively infrequent. Thus, we do not expect any significant skew in the results by treating a unique machine as a single user. In the data we collected, many of the users or machines never clicked a link. Thus we look at the data conditional on clicking a link. (The no-click results are most likely the
0.2
0.4
0.6
0.8
1.0
Raw α
1.0
x
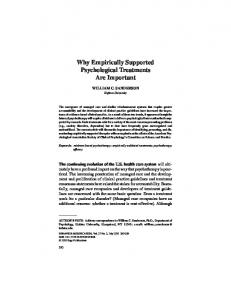
Figure 2: This histogram of raw values of α (see equation (2)) from 257, 664 users shows that users follow links frequently. It also approximates a Beta(3.2, 2.0) as shown by the dashed red curve. The dark line is a kernel density estimate.
result of automated botnet infections hijacking browsers.) For each user, we estimated α using the raw estimate (2). For data collection reasons, it was simplest to analyze data collected as a histogram with 250 bins uniformly placed between 0 and 1. This histogram, a kernel density estimate, and a Beta fit are shown in figure 2. The Beta density fit is computed using the gamlss function and package [24] within the R software [23]. The gamlss codes use a maximum likelihood fit for the parameters. The fitted Beta parameters are a ˆ = 3.227 and ˆb = 1.957. The 0 and 1 probability entries are νˆ = 2 · 10−5 and τˆ = 0.002. Each parameter was significant and had a small error. Because these probabilities at 0 and 1 are sufficiently small, we treat this as a noninflated Beta distribution in the remainder of the paper. The fitted mean is µ ˆ = 0.628. The mean value of µ ¯ in the sample is 0.631.
Experiment 2: Browsing on Wikipedia. Our second experiment explores values of α on Wikipedia. In this experiment, we collected two types of toolbar data from users visiting Wikipedia. The first type matches the data in the previous experiment. That is, we collected the total number of links clicked in Wikipedia, and the total number of pages visited in Wikipedia. We also collected a second set of measurements where we only counted clicks between pages in Wikipedia. For a site specific ranking, leaving the site is equivalent to teleporting, and this collection models that behavior. In many cases these counts were sufficiently small and produced data where there was no page reached via a click or all pages were reached via a click. Both of these cases are unrealistic. We assume that no user always visits pages via bookmarks or entering URLs and also that no user always clicks links. Consequently, we applied pseudo-count smoothing to the data. Instead of using equation 2, we used α≈
number of pages viewed after clicking a link + 1 (3) total number of pages viewed + 2
to approximate the value of α for a user. Figure 3 summarizes our measurements in each of these cases. We fit distributions under a variety of smoothing functions and inflated/non-inflated Beta densities. These fits
show what changes when we exclude or smooth out surfers with full link following or no link following. Starting from the upper left and proceeding to the right, the first two subfigures summarize data when we consider any click from a Wikipedia page (denoted all in the subplot title). In this case, we fit both a Beta distribution to smoothed estimates of α and a zero-inflated Beta to an adjusted estimate of α. The adjusted estimate just adds 1 to the denominator of (2) to allow 0 probabilities (no clicks within Wikipedia). One interpretation of this smoothing is that users always visit at least one page without a click. The next two plots show the same data, except we only consider clicks between pages in Wikipedia as described above (denoted within in the titles). In this case, we show the results of both smoothed estimates (3) and raw estimates (2). Finally, we show a subset of the within data where there was at least one click within Wikipedia. Again, we plot this data for smoothed and raw estimates as in the previous set of subfigures. For all the fits, we show the parameters of the zero-inflated Beta distribution at the top of the plot. When ν = 0, then these parameters correspond with a regular Beta distribution. All the parameters have small fit errors and are significant. See Table 2 for a discussion about the number of users involved in each fit. Although we include a brief discussion of these results here, we delay comparison of the distributions between our approaches until section 4.4. As evidenced by the top right figures (all, adjusted and within, raw) there is a considerable probability of not clicking any link in Wikipedia. We discuss this further below and conjecture that Wikipedia may be a single information destination for many users. As expected, there is no difference in the shape parameters after removing all the zero probability entries (within, raw vs. used within, raw). Smoothed estimates of α produce different shape parameters, but the overall shape does not change too much. We make this argument more precisely in the subsequent discussion.
4.3
Site application logs
In the previous studies using toolbar logs, we were able to collect data on many browsing sessions. That data, however, was macroscopic. We used details of the referrer field in a browser to infer links. Making this assumption slightly over estimates the values of α for each user because back buttons are not explicitly handled. To handle these issues, we analyzed application logs from the website hellomovies.com, a movie-browsing website. Please see the acknowledgments section for a disclosure statement about this data and website. These application logs contain information about page requests and user actions communicated via a JavaScript call-back library. Using them, we can reconstruct a browsing session on the website and explicitly track clicks. They also have enough information to infer back button clicks as well. Yet another feature of these logs is that they contain seven months of data for some users. Within these application logs, we reconstruct a session and identify five types of information: page views on our site, inferred page views off our site, known clicks, non-clicks, and logout actions. Let us briefly sketch some details of the reconstruction. First, we only consider users that registered for the website. This limits the population of users, but allows us to confidently identify the same user or group of users. We infer other page views in the following cases:
15
all, smoothed
all, adjusted
ZIBeta( 3.0 , 5.4 , 0.000 )
ZIBeta( 3.1 , 4.9 , 0.553 ) Z
10
5
0 within, smoothed
ZIBeta( 3.3 , 6.7 , 0.000 )
15
10
5
0 used within, smoothed
ZIBeta( 4.4 , 6.0 , 0.000 )
15
10
5
0 0.0
0.2
0.4
0.6
0.8
1.0
Adjusted α
F gure 3 A summary of mu t p e ways of nterpretng too bar ogs for c ck nformat on on W k ped a See the text for more nformat on and Tab e 2 they arr ve at our s te w th a re errer set e sewhere they depart the s te v a one o our nks and they ogout and then return We n er non-c cks when a user v s ts a page that oads n ormat on rom a JavaScr pt ca and they were not known to be on that page a user v s ts a page w th a re errer that does not match the prev ous page and a user returns to the s te a ter eav ng v a an off-s te nk Note that the act on o press ng the back button mu t p e t mes s treated as a s ng e non-c ck event Among these data we ma nta n the nvar ant that known c cks + ogouts + non-c cks = s te pages + n erred other pages W th th s n ormat on a smoothed est mate o α s α≈
known c cks + ogouts s te pages + n erred other pages + 1
At the end o our data co ect on we n er a ogout act on and another page v s t Thus the above ormu a corresponds to the same smooth ng est mate n (3) Over seven months o og data rom March 2009 unt September 2009 we observed 3 786 un que users F gure 4 shows h stograms o the smoothed est mates o α or each month kerne dens ty est mates and fits to a Beta d str but on It nc udes a fina figure w th the data rom a seven months The parameters o each fit are s gn ficant a though the fitted data has a standard error o ±0 03 n a d fferent parameter zat on o the Beta d str but on We observe a user ndependent α va ue o 0 660 and a mean smoothed user dependent est mate o 0 676 A o the Beta fits are c ose to the kerne dens ty est mates
44
Summary and Discussion
We now compare the two methods o est mat ng d str but ons o α and the three d str but ons we ound F rst we summar ze the data about the fitted Beta d str but ons n Tab e 2 Th s tab e shows the number o users n each fit the samp e est mate o α (α) ˆ the samp e mean o the d str but on
4
March
April
May
June
Beta( 7.3 , 2.6 )
Beta( 5.7 , 2.1 )
Beta( 6.1 , 2.9 )
Beta( 6.4 , 3.3 )
3 2 1 0 4
July
August
September
All
Beta( 5.4 , 2.7 )
Beta( 5.0 , 2.7 )
Beta( 5.4 , 2.9 )
Beta( 5.9 , 2.8 )
3 2 1 0 0.0 0.2 0.4 0.6 0.8 1.0 0.0 0.2 0.4 0.6 0.8 1.0 0.0 0.2 0.4 0.6 0.8 1.0 0.0 0.2 0.4 0.6 0.8 1.0
Smoothed α Figure 4: Values from hellomovies analytics logs (¯ µ), the fitted mean of the distribution (ˆ µ), and the fitted parameters (ˆ a, ˆb). We omit details of the inflated Beta distributions from these tables. Figure 5 shows representative distributions from each source. The similarity between the HelloMovies fit and the global fit shows that both methods agree on broad characteristics of link-following behavior. Users browse the web and follow links with probability around 0.625 – 0.7. Registered users on HelloMovies ought to reflect a slightly different demographic and the site encourages users to click links frequently. We conjecture that this explains the increase in the link-following behavior between the distributions. While the HelloMovies and global distributions are close, the Wikipedia distribution suggests considerably less linkfollowing behavior. We find this surprising and offer the following hypothetical explanation. Most visits to Wikipedia are from search results and these individuals are accurately directed right to their information. Thus, they have no need to browse. We conjecture that Wikipedia browsing should show behavior closer to the global link following distribution when users arrive at the site without following a link. Each of the fitted distributions has a fairly large variance. This indicates there is considerable variation amongst the link-following behavior in people. Most likely, this reflects the difference in how individuals navigate the web, see ref. [27]. Finally, we’d like to observe that the fitted distributions are fairly stable. The monthly data for HelloMovies shows only minor variations in the fitted Beta. Likewise, we observed remarkable stability in the parameters of the global Beta fit.
Wikipedia shows the same phenomena. Distributions fitted on smoothed data or with an inflated Beta distributions kept µ ˆ between 0.325 and 0.425.
5.
COMPUTING PAGERANK WITH EMPIRICAL ALPHAS
In this section we discuss how to compute PageRank with respect to a distribution. Two existing techniques are an approach based on polynomial chaos [7] and an approach based on a Taylor expansion [4]. In ref. [8], we showed that the proposed polynomial chaos scheme is equivalent to a Gaussian quadrature approximation. In this paper, we only consider the quadrature approximation. This section is largely review and we encourage readers to examine refs. [8, 10] for details about a general form of this problem in approximation theory and the specifics of many algorithms applied to the PageRank problem with a distribution. The general framework of the problem is computing an estimate of Z 1 x(α)f (α; a, b) dα 0
where f (α; a, b) is the density of a Beta distribution (see section 4.1) and the integral acts on each component independently. If A is a random variable corresponding to that distribution, then this integral is E [x(A)]. We consider two approaches. The first is using an empirically measured histogram and a weighted sum of PageRank vectors. This method does not require fitting a Beta distri-
Table 2: Summary statistics of fitting Beta distributions Data
Type
n
α ¯
µ ¯
µ ˆ
a ˆ
ˆb
Global
smoothed
257664
—
0.631
0.628
3.227
1.957
Wikipedia
all,smoothed all,adjusted within,smoothed within,raw used within,smoothed used within,raw
999716 999716 998883 998883 382748 382748
0.378 0.378 0.341 0.341 0.450 0.450
0.358 0.171 0.327 0.155 0.424 0.403
0.358 0.384 0.327 0.404 0.425 0.404
3.025 3.058 3.263 2.689 4.403 2.689
5.423 4.900 6.708 3.962 5.967 3.962
HelloMovies
March April May June July August September
216 199 432 538 1395 850 677
0.715 0.740 0.682 0.649 0.639 0.647 0.616
0.736 0.731 0.682 0.662 0.669 0.648 0.648
0.735 0.728 0.680 0.659 0.667 0.646 0.647
7.316 5.743 6.060 6.442 5.355 4.987 5.369
2.631 2.149 2.851 3.329 2.670 2.732 2.935
All
3786
0.659
0.676
0.675
5.852
2.821
Wikipedia Beta(3,4.9)
Hellomovies Beta(5.8,2.8)
solves. Largely, we use this scheme to validate our quadrature approximation below. We expect the results of the two to be close when using a fairly large bin size.
5.2
Gaussian Quadrature
When we do have a fitted distribution, then we can approximate Z 1 N X x(α)f (α; a, b) dα = x(zj )wj ≡ xq
Global Beta(3.2,2)
0
0.0
0.2
0.4
0.6
0.8
1.0
x
Figure 5: Three fitted distributions that largely characterize empirical teleportation parameters on the entire web (Global), Wikipedia, and HelloMovies. bution, but may be sensitive to sampling irregularities. The second method is using a Gaussian quadrature approximation, which does require fitting a Beta density. Quadrature ought to be less sensitive to any sampling irregularities.
5.1
Empirical histogram
Given a set of sample values αi corresponding to empirically measured αs, we need not fit a distribution. Instead, we can use a histogram of these values to approximate some underlying distribution. Let hj be the number of αi in a set of uniformly spaced bins and let bj be the center of the corresponding bins. Consider the approximation 1 x h ≡ PN
j=1
N X
hj
x(bj )hj .
j=1
However, the choice of bin size is not obvious, and the results will be sensitive to this choice. Additionally, the number of necessary PageRank solves will be large for a small bin size. Therefore we prefer the quadrature approach, which implicitly smooths the data and requires fewer PageRank
j=1
where zj and wj are the nodes and weights of an N -point quadrature rule corresponding to f (α; a, b). In a Gaussian quadrature rule, zj and wj are chosen such that the approximation is exact for all polynomials of degree up to 2N − 1. While x(α) is not a polynomial in α, it is an analytic (rational) function of α in a region containing the interval of integration. Therefore, we expect an accurate quadrature approximation of the integral with relatively few PageRank computations. See ref. [10] for an analysis of the error in a Gaussian quadrature approximation of these integrals.
5.3
PageRank details
Both of the above ideas involve computing PageRank vectors at multiple values of α. To compute these vectors, we use a Matlab mex implementation of the Gauss-Seidel algorithm on (1) (our implementation matches that in the law toolkit [25]) with compensated summation [28]. All PageRank problems are solved to a tolerance of 10−8 .
6.
RESULTS
To evaluate the distributions, we show some results on the link graph underlying Wikipedia. In particular, we focus on comparing the PageRank vector based on the link following distribution of Wikipedia with other choices for this distribution. See ref. [7] for details of the graph construction. The graph used in these experiments is from a Wikipedia dump on March 6, 2009. First, we note that both the histogram approach (section 5.1) and Gaussian quadrature approach (section 5.2) produced similar results. (More precisely, we studied the average
behavior is expected because the densities for these fits are fairly close. We leave evaluating these vectors in a ranking context to future work.
0.5
Intersection Similarity
0.4
7.
Distribution
0.3
alpha=0.85 All − Beta(3.2,2) 0.2
HM − Beta(5.8,2.8)
0.1
Identical 100
101
102
103
104
105
106
k
Figure 6: A comparison between the PageRank vectors of a distribution using the intersection similarity metric (see equation (4)), where values close to 0 indicate identical rankings. This metric shows that the top-k lists produced by the methods are moderately different unless k is small.
set-difference of top-k results and found the difference was slight over the entire vector.) Thus we only show results for the quadrature. With the same number of approximation points, Gaussian quadrature is more computationally demanding because the evaluation nodes tend to cluster at the end points of the region of integration. For PageRank, this means we evaluate many PageRank functions with α close to 1 where iterative methods take considerably more iterations. That said, the difference is less than twice the cost. We feel that the mathematical framework and parameter estimation involved in the quadrature rules is going to make our results more reproducible using these rules. We evaluate all the estimates with a 25-point quadrature rule. In Table 3, we show the pages with highest PageRank for the common choice α = 0.85 and for the three fitted distributions from each website. These pages show that PageRank with α = 0.85 heavily promotes category pages into the top list. Using any of the fitted distributions weakens this effect, and using the distribution fitted to Wikipedia produces a rather informative set of pages about countries and years. Given two numerical vectors x and y, the intersection similarity metric at k [4] is the average symmetric difference over the top-j sets for each j ≤ k. If Xk (Yk ) is the top-k set for x (y), then isimk (x, y) =
k 1 X |Xj ∆Yj | , k j=1 2j
(4)
where ∆ is the symmetric set-difference operation. Two identical vectors, or vectors with identical orderings, produce an intersection similarity of 0. Figure 6 displays this value for the vector xq on the Wikipedia distribution compared with the three other PageRank vectors. In the figure, we fix x as the results of the Wikipedia distribution and vary y over the other three PageRank vectors. From the figure, we conclude that the ranking vectors produced by the Wikipedia fit are different than the vectors produced using α = 0.85. It also appears as if the difference between the HelloMovies distribution and the global distribution will be slight. This
CONCLUSIONS
In short, our answer to the question what should α be? is let the users decide! We have presented a simple technique for incorporating measured browsing behavior into the PageRank model, which is summarized as follows: First, obtain measurements of the teleportation parameter α for a sample of individuals using either data from browser toolbars or website application logs. Next, estimate a density function for α using either a histogram or a parametric Beta density estimator. Finally, compute the PageRank vector as the expectation of PageRank with respect to the estimated density function for α. We ran experiments on (i) data from a Microsoft toolbar collected during web browsing sessions and Wikipedia browsing sessions, and (ii) usage logs from the website hellomovies. com. The results suggest that such a method could easily be incorporated into existing ranking methods for web search. The same ideas may apply for other PageRank applications as well. For instance, suppose a personalized PageRank heuristic is used to predict missing friends in a social network. Then a potential choice for α is the square root of the probability that friends of friends are themselves friends, which is the standard clustering coefficient. This probability could be measured from data, and our method would apply in a straightforward manner. In general, the impact of such a modification to a ranking system will be application dependent. We have, therefore, avoided proposing and analyzing a specific metric for improvement. However, since such metrics are often an amalgamation of simpler metrics, we believe that our data-driven choice for α is an appropriate modification for many different PageRank applications. Furthermore, this study sheds new light on user behavior on the web. We measured the link-following probability of users on the entire web, Wikipedia, and HelloMovies. While the estimates from the entire web and HelloMovies show that users follow links with mean probability between 0.6 to 0.725, estimates on Wikipedia show that users follow links with mean probability around 0.325 to 0.425. This discrepancy is surprising and we hope to investigate causes for it in the future. Our conjecture is that many visits to Wikipedia are for particular pieces of information. Thus, site visitors have little reason to click elsewhere if the first page visited produces the information. Based on this rationale, we conjecture that Wikipedia’s results should mirror those of other sites conditional on arriving via a non-search channel. There are a few natural extensions of these ideas we also leave to future work. First, interactive websites where a click begins an action, instead of bringing the user to a new page, break the link-following/click tracking paradigm. Using similar techniques, we could estimate the prevalence of these behaviors and derive new web models. Second, another possible explanation of the difference between our Wikipedia distributions and global distributions is that clicks “within” a domain follow considerably different patterns than clicks “between” domains. The HelloMovies data did try to track clicks off the site, and thus these results were not purely within a domain. Regardless, using click behavior between
Table 3: The top 15 pages from our methods on a graph from Wikipedia. The distributions correspond with figure 5, with a slight change in the global fit. Standard Wikipedia Hellomovies Global x(0.85) xq - Beta(3, 4.9) xq - Beta(5.8, 2.8) xq - Beta(3.2, 2) United States C:Main topic classif. C:Contents C:Living people C:Categories by country United Kingdom C:Fundamental C:Categories by topic C:Wikipedia admin. France England Category:Society Germany C:Ctgs. by geography. Canada
United States C:Living people France Germany England United Kingdom Canada Gene Poland 2008 Japan 2007 Australia India World War II
domains may be helpful in building more accurate HostRank or DomainRank vectors. Finally, to firmly establish our results about the tendency of individuals to click links on the web, we would need to engage a well controlled user study. We are hopeful that such a study would validate our broad scale analysis.
United States C:Living people United Kingdom France England C:Main topic classif. Germany C:Categories by country Canada Race [. . . ] U.S. Census Category:Contents World War II Australia Japan India
[5]
[6]
Acknowledgments Paul Constantine was supported by the Department of Energy PSAAP program and the Franklin P. and Caroline M. Johnson Fellowship through his graduate work. He is currently the John von Neumann Research Fellow at Sandia National Labs. David Gleich was supported by a Microsoft Live Labs fellowship throughout most of this research. The work of this author was also supported in part by the Natural Sciences and Engineering Research Council of Canada. Pieces of these ideas appeared in his thesis [10, section 4.5], but this text is significantly different and includes new experiments. David is also a part-time employee and shareholder of Flixbee Inc., the owner of the HelloMovies website. We are grateful they permitted us to use their data in this study.
8.
REFERENCES
[1] S. Abiteboul, M. Preda, and G. Cobena. Adaptive on-line page importance computation. In Proceedings of the 12th international conference on the World Wide Web, pages 280–290, New York, NY, USA, 2003. ACM Press. [2] K. Avrachenkov, N. Litvak, and K. S. Pham. Distribution of PageRank mass among principle components of the web. In A. Bonato and F. C. Graham, editors, Proceedings of the 5th Workshop on Algorithms and Models for the Web Graph (WAW2007), volume 4863 of Lecture Notes in Computer Science, pages 16–28. Springer, 2007. [3] P. Berkhin, U. M. Fayyad, P. Raghavan, and A. Tomkins. User-sensitive PageRank. United States Patent Application 20080010281, January 2008. [4] P. Boldi. TotalRank: Ranking without damping. In Poster Proceedings of the 14th international conference
[7]
[8]
[9]
[10]
[11]
[12]
[13]
[14]
United States C:Living people France United Kingdom England Germany C:Main topic classif. C:Categories by country Canada C:Contents Race [. . . ] U.S. Census World War II Australia Japan India
on the World Wide Web (WWW2005), pages 898–899, 2005. P. Boldi, M. Santini, and S. Vigna. PageRank as a function of the damping factor. In Proceedings of the 14th international conference on the World Wide Web (WWW2005), Chiba, Japan, 2005. ACM Press. L. D. Catledge and J. E. Pitkow. Characterizing browsing strategies in the world-wide web. Computer Networks and ISDN Systems, 27(6):1065–1073, 1995. P. G. Constantine and D. F. Gleich. Using polynomial chaos to compute the influence of multiple random surfers in the PageRank model. In A. Bonato and F. C. Graham, editors, Proceedings of the 5th Workshop on Algorithms and Models for the Web Graph (WAW2007), volume 4863 of Lecture Notes in Computer Science, pages 82–95. Springer, 2007. P. G. Constantine, D. F. Gleich, and G. Iaccarino. Spectral methods for parameterized matrix equations. arXiv, April 2009. V. Freschi. Protein function prediction from interaction networks using a random walk ranking algorithm. In Proceedings of the 7th IEEE International Conference on Bioinformatics and Bioengineering (BIBE 2007), pages 42–48. IEEE, October 2007. D. F. Gleich. Models and Algorithms for PageRank Sensitivity. PhD thesis, Stanford University, September 2009. D. J. Higham. Google PageRank as mean playing time for pinball on the reverse web. Applied Mathematics Letters, 18(12):1359 – 1362, December 2005. B. A. Huberman, P. L. T. Pirolli, J. E. Pitkow, and R. M. Lukose. Strong regularities in World Wide Web surfing. Science, 280(5360):95–97, 1998. J. Kamps and M. Koolen. Is Wikipedia link structure different? In WSDM ’09: Proceedings of the Second ACM International Conference on Web Search and Data Mining, pages 232–241, New York, NY, USA, 2009. ACM. D. Kosch¨ utzki, K. A. Lehmann, L. Peeters, S. Richter, D. Tenfelde-Podehl, , and O. Zlotowski. Centrality Indicies, volume 3418 of Lecture Notes in Computer Science, chapter 3, pages 16–61. Springer, 2005.
[15] A. N. Langville and C. D. Meyer. Google’s PageRank and Beyond: The Science of Search Engine Rankings. Princeton University Press, 2006. [16] Y. Liu, B. Gao, T.-Y. Liu, Y. Zhang, Z. Ma, S. He, and H. Li. BrowseRank: letting web users vote for page importance. In SIGIR ’08: Proceedings of the 31st annual international ACM SIGIR conference on Research and development in information retrieval, pages 451–458, New York, NY, USA, 2008. ACM. [17] J. C. Miller, G. Rae, F. Schaefer, L. A. Ward, T. LoFaro, and A. Farahat. Modifications of Kleinberg’s HITS algorithm using matrix exponentiation and web log records. In SIGIR ’01: Proceedings of the 24th annual international ACM SIGIR conference on Research and development in information retrieval, pages 444–445, New York, NY, USA, 2001. ACM. [18] J. L. Morrison, R. Breitling, D. J. Higham, and D. R. Gilbert. GeneRank: using search engine technology for the analysis of microarray experiments. BMC Bioinformatics, 6(1):233, 2005. [19] M. A. Najork, H. Zaragoza, and M. J. Taylor. HITS on the web: how does it compare? In Proceedings of the 30th annual international ACM SIGIR conference on Research and Development in information retrieval (SIGIR2007), pages 471–478, New York, NY, USA, 2007. ACM. [20] R. Ospina and S. L. P. Ferrari. Inflated beta distributions. Statistical Papers, 51(1):111–126, January 2010. [21] L. Page, S. Brin, R. Motwani, and T. Winograd. The PageRank citation ranking: Bringing order to the web. Technical Report 1999-66, Stanford University, November 1999. [22] J.-Y. Pan, H.-J. Yang, C. Faloutsos, and P. Duygulu. Automatic multimedia cross-modal correlation discovery. In KDD ’04: Proceedings of the tenth ACM SIGKDD international conference on Knowledge discovery and data mining, pages 653–658, New York, NY, USA, 2004. ACM.
[23] R Development Core Team. R: A Language and Environment for Statistical Computing. R Foundation for Statistical Computing, Vienna, Austria, 2009. ISBN 3-900051-07-0. [24] D. M. Stasinopoulos and R. A. Rigby. Generalized additive models for location scale and shape (GAMLSS) in R. Journal of Statistical Software, 23(7):1–46, December 2007. [25] S. Vigna, R. Posenato, M. Santini, and S. Vigna. LAW 1.3.1: Library of algorithms for the webgraph. http://law.dsi.unimi.it/software/docs/, 2008. [26] M. Wang. A significant improvement to clever algorithm in hyperlinked environment. In Proceedings of the 11th international conference on the World Wide Web (WWW2002), 2002. [27] R. W. White and S. M. Drucker. Investigating behavioral variability in web search. In Proceedings of the 16th international conference on the World Wide Web (WWW2007), pages 21–30, New York, NY, USA, 2007. ACM Press. [28] R. S. Wills and I. C. F. Ipsen. Ordinal ranking for Google’s PageRank. SIAM Journal on Matrix Analysis and Applications, 30:1677–1696, January 2009. [29] A. D. Wissner-Gross. Preparation of topical reading lists from the link structure of Wikipedia. In ICALT ’06: Proceedings of the Sixth IEEE International Conference on Advanced Learning Technologies, pages 825–829, Washington, DC, USA, 2006. IEEE Computer Society. [30] G.-R. Xue, H.-J. Zeng, Z. Chen, W.-Y. Ma, H. Zhang, and C.-J. Lu. User access pattern enhanced small web search. In Poster Proceedings of the 12th international conference on the World Wide Web (WWW2003), 2003. [31] D. Zhou, J. Huang, and B. Sch¨ olkopf. Learning from labeled and unlabeled data on a directed graph. In ICML ’05: Proceedings of the 22nd International Conference on Machine Learning, pages 1036–1043, New York, NY, USA, 2005. ACM Press.