Dec 3, 2018 - Early studies investigated how well tractography followed large white matter ... 101 reliably detected than long-range, (3) connectivity predictions do ..... All the sessions were registered using flirt to the first session of scanner.
bioRxiv preprint first posted online Dec. 3, 2018; doi: http://dx.doi.org/10.1101/484543. The copyright holder for this preprint (which was not peer-reviewed) is the author/funder, who has granted bioRxiv a license to display the preprint in perpetuity. It is made available under a CC-BY 4.0 International license.
1 2 3 4 5 6 7 8 9 10 11 12 13 14 15 16 17 18 19 20 21 22 23 24 25 26 27 28 29 30 31 32 33 34 35 36 37 38 39 40 41 42 43
1
Tractography Reproducibility Challenge with Empirical Data (TraCED): The 2017 ISMRM Diffusion Study Group Challenge Vishwesh Nath 1, Kurt G. Schilling 2, Prasanna Parvathaneni 3, Allison E. Hainline 4, Yuankai Huo, Justin A. Blaber 3, Matt Rowe 10, Paulo Rodrigues 10, Vesna Prchkovska10, Dogu Baran Aydogan 23, Wei Sun 23, Yonggang Shi 23, William A. Parker21, Abdol Aziz Ould Ismail21, Ragini Verma21, Ryan P. Cabeen 11, Arthur W. Toga 11, Allen T. Newton12,13, Jakob Wasserthal14, Peter Neher14, Klaus Maier-Hein14, Giovanni Savini15,16, Fulvia Palesi16,17, Enrico Kaden18, Ye Wu22, Jianzhong He22, Yuanjing Feng22, Muhamed Barakovic 6, David Romascano 6 ,Jonathan Rafael-Patino 6, Matteo Frigo 6, Gabriel Girard 6, Alessandro Daducci 7,8,6, JeanPhilippe Thiran 6,8, Michael Paquette19, Francois Rheault19, Jasmeen Sidhu19 Catherine Lebel 9, Alexander Leemans 5, Maxime Descoteaux19, Tim B. Dyrby20, Hakmook Kang4, Bennett A. Landman 1,2,3,12,13 1
Computer Science, Vanderbilt University, Nashville, TN, USA Biomedical Engineering, Vanderbilt University, Nashville, TN, USA 3 Electrical Engineering, Vanderbilt University, Nashville, TN, USA 4 Biostatistics, Vanderbilt University, Nashville, TN, USA 5 Image Sciences Institute, University Medical Center Utrecht, Utrecht, the Netherlands 6 Signal Processing Lab (LTS5), EPFL, Switzerland 7 Computer Science Department, University of Verona, Italy 8 Radiology Department, CHUV and University of Lausanne, Switzerland 9 Department of Radiology, University of Calgary, Canada 10 Mint Labs Inc., Boston, USA 11 Laboratory of Neuro Imaging (LONI), USC Stevens Neuroimaging and Informatics Institute 12 Radiology and Radiological Sciences, Vanderbilt University Medical Center, Nashville, TN, USA 13 Vanderbilt University Institute of Imaging Science, Vanderbilt University Medical Center, Nashville, TN 14 Medical Image Computing Group, German Cancer Research Center (DKFZ), Heidelberg, Germany 15 Department of Physics, University of Milan, Milan, Italy 16 Brain Connectivity Center, C. Mondino National Neurological Institute (EFG), Pavia, Italy 17 Department of Physics, University of Pavia Pavia, Italy 18 Centre for Medical Image Computing, Department of Computer Science, University College London, London, United Kingdom 19 Sherbrooke Connectivity Imaging Lab (SCIL), Computer Science Department, Université de Sherbrooke, 2500 Boul. Université, J1K 2R1, Sherbrooke, Canada 20 Danish Research Centre for Magnetic Resonance, Copenhagen University Hospital, Hvidovre, Denmark 24 Department of Applied Mathematics and Computer Science, Technical University of Denmark, Kongens Lyngby, Denmark 21 Center for Biomedical Image Computing and Analytics, Dept of Radiology, Perelman School of Medicine, University of Pennsylvania (UPENN) 1 2
bioRxiv preprint first posted online Dec. 3, 2018; doi: http://dx.doi.org/10.1101/484543. The copyright holder for this preprint (which was not peer-reviewed) is the author/funder, who has granted bioRxiv a license to display the preprint in perpetuity. It is made available under a CC-BY 4.0 International license.
2
22
44 45 46
Institution of Information Processing and Automation, Zhejiang University of Technology (ZUT), Hangzhou, China 23 Keck School of Medicine, University of Southern California (NICR), Los Angeles CA, USA
47
ABSTRACT
48 49 50 51 52
Purpose: Fiber tracking with diffusion weighted magnetic resonance imaging has become an essential tool for estimating in vivo brain white matter architecture. Fiber tracking results are sensitive to the choice of processing method and tracking criteria. Phantom studies provide concrete quantitative comparisons of methods relative to absolute ground truths, yet do not capture variabilities because of in vivo physiological factors.
53 54 55 56 57 58 59 60
Methods: To date, a large-scale reproducibility analysis has not been performed for the assessment of the newest generation of tractography algorithms with in vivo data. Reproducibility does not assess the validity of a brain connection however it is still of critical importance because it describes the variability for an algorithm in group studies. The ISMRM 2017 TraCED challenge was created to fulfill the gap. The TraCED dataset consists of a single healthy volunteer scanned on two different scanners of the same manufacturer. The multi-shell acquisition included b-values of 1000, 2000 and 3000 s/mm2 with 20, 45 and 64 diffusion gradient directions per shell, respectively.
61 62 63 64 65 66
Results: Nine international groups submitted 46 tractography algorithm entries. The top five submissions had high ICC > 0.88. Reproducibility is high within these top 5 submissions when assessed across sessions or across scanners. However, it can be directly attributed to containment of smaller volume tracts in larger volume tracts. This holds true for the top five submissions where they are contained in a specific order. While most algorithms are contained in an ordering there are some outliers.
67 68 69 70
Conclusion: The different methods clearly result in fundamentally different tract structures at the more conservative specificity choices (i.e., volumetrically smaller tractograms). The data and challenge infrastructure remain available for continued analysis and provide a platform for comparison.
71
Keywords: Tractography, Reproducibility, in vivo, Challenge, DW-MRI, HARDI
72 73 74 75 2
bioRxiv preprint first posted online Dec. 3, 2018; doi: http://dx.doi.org/10.1101/484543. The copyright holder for this preprint (which was not peer-reviewed) is the author/funder, who has granted bioRxiv a license to display the preprint in perpetuity. It is made available under a CC-BY 4.0 International license.
3
76
1. INTRODUCTION
77 78 79 80 81 82 83 84 85 86 87 88 89 90 91 92
Diffusion weighted magnetic resonance imaging (DW-MRI) is a technique which allows for noninvasive mapping of the human brain’s micro-architecture at milli-metric resolution. Using voxelwise fiber orientation reconstruction methods, tractography can provide quantitative and qualitative information for studying structural brain connectivity and continuity of neural pathways of the nervous system in vivo. There have been many algorithms, global, iterative, deterministic and probabilistic, that reconstruct streamlines using fiber reconstruction methods. Tractography was conceived [2] using one of the first fiber reconstruction method, diffusion tensor imaging (DTI) [1]. However, DTI has a well-known limitation: it cannot resolve complex fiber configurations [3]. With the advancement in acquisitions protocols allowing for better resolution and higher number of gradient values new methods for reconstruction of local fiber have been developed. These methods are commonly referred to as high angular resolution diffusion imaging (HARDI), e.g., q-ball, constrained spherical deconvolution (CSD), persistent angular structure (PAS) [4-6]. HARDI methods enable characterization of more than a single fiber direction per voxel, but have been often shown to be limited when more than two fiber populations exist per voxel [7, 8]. While there is definite gain in sensitivity when using HARDI methods, there remain critical questions of their reproducibility [9].
93 94 95 96 97 98 99 100 101 102 103 104
There have been many validation efforts that aim to assess the anatomical accuracy of tractography. Early studies investigated how well tractography followed large white matter trajectories through qualitative comparisons with dissected human samples [10], or previous primate histological tracings [11]. Later works on the macaque [12] or porcine [13] brains highlighted limitations and common errors in tractography. Recently, the sensitivity and specificity of tractography in detecting connections has been systematically explored against tracers in the monkey [14-16], porcine [17], or mouse [18] brains. The main conclusions drawn from these are (1) that algorithms always show a tradeoff in sensitivity and specificity (i.e. those that find the most true connections have the most false connections) (2) short-range connections are more reliably detected than long-range, (3) connectivity predictions do better than chance and thus have useful predictive power, and (4) tractography performs better when assessing connectivity between relatively large-scale regions rather than identifying fine details or connectivity.
105 106 107 108 109 110 111
Despite the wide range of validation studies, there have been few reproducibility studies of tractography [19-21]. Rather than ask how right (or wrong) tractography is, we ask how stable are the outputs of these techniques? Because tractography is an essential part of track segmentation, network analysis, and microstructural imaging, it is important that reproducibility is high, otherwise power is lost in group analyses or in longitudinal comparisons. In this study, given a standard, clinically realistic, diffusion protocol, we aim to assess how reproducible tractography results are between repeats, between scanners, and between algorithms.
112 113 114 115 116
Publicly organized challenges provide unique opportunities for research communities to fairly compare algorithms in an unbiased format, resulting in quantitative measures of the reliability and limitation of competing approaches, as well as potential strategies for improving consistency. In the diffusion MRI community, challenges have focused on recovering intra-voxel fiber geometries using synthetic data [22] and physical phantoms [19, 23]. Similarly, diffusion tractography 3
bioRxiv preprint first posted online Dec. 3, 2018; doi: http://dx.doi.org/10.1101/484543. The copyright holder for this preprint (which was not peer-reviewed) is the author/funder, who has granted bioRxiv a license to display the preprint in perpetuity. It is made available under a CC-BY 4.0 International license.
4
117 118 119 120 121 122 123 124 125
challenges [20] have provided insights into the effects of different acquisition settings, voxel-wise reconstruction techniques, and tracking parameters on tract validity by comparing results to ground truth physical phantom fiber configurations [19, 21]. Recently, more clinically relevant evaluations have been put forth. For example, a recent MICCAI challenge benchmarked DTI tractography of the pyramidal tract in neurosurgical cases presenting with tumors in the motor cortex [24]. Towards this direction, the current challenge utilized a large-scale single subject reproducibility dataset, acquired in clinically feasible scan times. This challenge was intended to study reproducibility to describe the limitations for capturing physiological and imaging considerations prevalent in human data and evaluate the newest generation of tractography algorithms.
126 127 128 129
This paper is organized as follows. First, we present the analysis structure of this challenge to characterize which tracts are the most reproducible. Second, we characterize the variance across the tractography methods by design features and compare the potential containment of tracts on a per algorithm basis.
130
2. METHODS
131
2.1 DW-MRI Data Acquisition
132 133 134 135 136 137 138 139 140 141 142 143
The data were acquired with a multi-shell HARDI sequence on single healthy human subject. The two scanners were both Phillips, Achieva, 3T, Best, Netherlands. These are referred to as scanner ‘A’ and ‘B’. The three shells that were acquired: b=1000 s/mm2, 2000s/mm2 and 3000s/mm2 with 20, 48 and 64 gradient directions respectively (uniformly distributed over a hemi-sphere and independently per shell, this was done in consideration of scanner hardware.). The other parameters were kept consistent for all shells. They are as follows: Delta=~48ms, delta=~37ms, partial fourier=0.77, TE = 99 ms, TR ~= 2920 ms and voxel resolution=2.5mm isotropic. A total of 15 non-weighted diffusion volumes ‘b0’ images interspersed as 5 per shell were acquired. Additionally, for scanner A & B, 5 reverse phase-encoded b0 images and 3 diffusion weighted directions were acquired to aid in distortion correction. The additional 3 diffusion-weighted direction volumes were acquired for ease of acquisition from the scanner. They do not contribute to the pre-processing of the data in any way.
144 145 146 147
Additionally, a T1-weighted reference image (MPRAGE) was acquired for each session per scanner (4 volumes total). A single volume of T1 was used which was registered to the first session of scanner A where the session had already been registered to the MNI template. This was done using a 6 degree of freedom rigid body registration.
148 149 150 151 152 153 154 155
For the initial data release, a technical issue resulted in 5 non-reverse phase-encoded b0 images for scanner A. Note that at the end of the challenge, the scanner ‘A’ data were completely reacquired for both sessions with 5 reverse phase-encoded b0 images and 3 diffusion weighted directions. These data were released as supplementary material, but not included in the presented challenge data. Following the protocol for tractography in [25], we delineated six tracts cingulum (CNG) Left/Right (L/R), inferior longitudinal fasciculus (ILF) (L/R), inferior fronto-occipital (IFO) (L/R). The mean intra-class correlation (ICC) inter-scanner values for the original challenge data and the updated challenge data were 0.86 and 0.89, respectively. The mean difference 4
bioRxiv preprint first posted online Dec. 3, 2018; doi: http://dx.doi.org/10.1101/484543. The copyright holder for this preprint (which was not peer-reviewed) is the author/funder, who has granted bioRxiv a license to display the preprint in perpetuity. It is made available under a CC-BY 4.0 International license.
5
156 157 158
between methods was 0.15 in terms of ICC. As expected, the inclusion of full reverse phase encoding for Scanner ‘A’ introduced a small increased in consistency relative to much larger differences between methods.
159 160 161 162 163 164 165 166 167 168
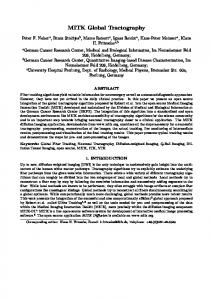
DW-MRI Data Pre-processing as illustrated in Fig 1, the 5 repeated acquisitions from each of the four sessions (two repeated on scanner A and B) were concatenated and corrected with FSL’s eddy and topup [25-27]. Intensity normalization was performed by dividing each diffusion weighted scan by the mean of all non-weighted diffusion volume (B0) per session. The average B0 from scanner A of the first sessions was rigidly (six degrees of freedom) registered [28] to a 2.5 mm T2 MNI template (this was done to ensure resampling from registration was done on both datasets). Next, the average B0 from the scanner A second session was rigidly registered to the average B0 of the registered scanner A first session B0 which had already been registered to the MNI space. Successively, the sessions from scanner B were registered to the sessions of scanner A. The bvectors were rotated to account for the registration of the DW-MRI data [29].
169 170 171 172 173 174 175
The T1 weighted MPRAGE was rigidly registered to the average registered b0 from the first session of scanner A. This transformation was applied to the T1 maintaining 1 mm isotropic resolution, thus providing a high-resolution segmentation that may be converted into diffusion space by performing a simple down-sampling. Multi-atlas segmentation with non-local spatial STAPLE fusion was used for the segmentation of the T1 volume to 133 different ROI’s [30, 31]. Finally, Multi-atlas CRUISE (MaCRUISE) was used to identify cortical surfaces [32]. These were provided for ease of algorithm implementations.
176 177
An informed consent under the Vanderbilt University (VU) Institutional Review Board (IRB) was obtained to conduct this study.
178
2.2 Challenge Rules and Metrics
179 180 181 182 183 184 185 186 187 188 189 190 191
For each of the 20 HARDI datasets (5 repetitions x 2 sessions x 2 scanners), participants were asked to submit a tractogram (i.e., “fiber probability membership function”) for each well-modeled fiber structures (uncinate (UNC) [L/R], fornix (FNX) [L/R], genu of the corpus callosum, cingulum (CNG) [L/R], corticospinal tract (CST) [L/R], splenium of the corpus callosum, inferior longitudinal fasciculus (ILF) [L/R], superior longitudinal fasciculus (SLF) [L/R], and inferior fronto-occipital (IFO) [L/R](1)). Each tractogram is a NIFTI volume at the field of view and resolution of the T1-weighted reference space where the floating-point value (32-bit single precision) of each voxel is in [0, 1] and indicates the probability of the voxel belonging to the specified fiber tract. Thus, participants submitted a total of 320 (5 x 2 x 2 x 16) NIFTI volumes using the acquisition of both the scanners. Assessment of fiber fractions was supported (i.e., the sum across all tracts is 0.7 by teams Team 1 and Team 4. A notable observation here is that a general assumption was made by Team 6 to reject voxels which were less than 0.15 FA. Team 2, Team 6 and Team 8 post-processed the tractography results for removal of spurious fibers by defining different and specific constraints. Of note, Team 2 treated the tractography problem as a segmentation problem and developed a U-net which was trained on the HCP data. While Team 9 used a multiatlas approach to tractography. The other teams used the general approach of probabilistic or deterministic tractography.
247 248 249 250 251 252 253 254 255
An overlay of all 46 submissions, for all estimated fiber pathways can be observed (Fig 2 Column 1 & 3). Only the left side has been shown as the right side is a similar observation. There are vast differences that can be noticed in the estimated pathways. The volume of the brain occupied by each tract from different submissions varied dramatically. When all 46 submissions are overlaid, tracts occupy 14-53% of the brain volumetrically (average – 34%). Specifically, the union of all entries for FNX (L/R), CNG (L/R), IFO (L/R) and SLF (L/R) cover (30.7, 25.8), (40.9, 37.2), (42.4, 46.1), (50.6, 53.3) respectively, while CST (L/R), ILF (L/R), UNC (L/R) and Fminor and Fmajor cover (23.6, 25.4), (33.4, 33.6), (14.3, 17.4), 44.3 and 34.1. Note that individual submissions appear qualitatively reasonable (Fig 2 Column 2 & 4).
256 257 258 259 260 261 262
The number of algorithmic submission’s team wise are Team 1: 14, Team 2: 1, Team 3: 2, Team 4: 12, Team 5: 1, Team 6: 6, Team 7: 1, Team 8: 6 and Team 9: 3. It can be observed that the ICC range for the set of algorithms on a per team basis does not show a lot of variance. The ICC range of algorithms per team are Team 1 (0.61 – 0.77), Team 4 (0.52 – 0.58), Team 6 (0.77 – 0.85), Team 8 (0.81 – 0.89), Team 9 (0.27 – 0.69), Team 3 (0.64, 0.73), Team 2 (0.85), Team 7 (0.88) and Team 5 (0.97). The teams that submitted more than 3 algorithms show an average difference of 0.1 in terms of ICC.
263 264 265 266
Violin plots (depict the probability density of the data) of ICC and Dice for intra-session reproducibility, inter-session, and inter-scanner measures of reproducibility are presented in Figures 4, 5 and 6, respectively. Since the observations are highly similar in the afore-mentioned figures we only present a detailed comment on Figure 4 which holds true for Figure 5 and 6 as 7
bioRxiv preprint first posted online Dec. 3, 2018; doi: http://dx.doi.org/10.1101/484543. The copyright holder for this preprint (which was not peer-reviewed) is the author/funder, who has granted bioRxiv a license to display the preprint in perpetuity. It is made available under a CC-BY 4.0 International license.
8
267 268 269 270 271 272 273
well. This figure helps in identifying the low, moderate and high reproducibility tracts. The intrasession distributions (Figure 4B) across entries for UNC (L/R) and FNX (L/R) are bi-modal with a median of the lower mode less than 0.4 ICC. The CST (L) has a smaller fraction of the entries with ICC less than 0.4, while the remainder of the entries have only a few outlier entries less than 0.4 The inter-session (Fig. 5) and inter-scanner (Fig. 6) distributions were similar, with a slight increase in outlier entries for IFO (L/R). The patterns in the dice were similar when using a quality threshold of less than 0.4 dice.
274 275 276 277 278 279 280 281 282
We define cutoffs for high, moderate, and low reproducibility on the inter-scanner reproducibility. High reproducibility was defined as a median ICC greater than 0.6 and less than 5% of entries less than 0.4 ICC. Moderate reproducibility was defined as median ICC greater than 0.4 and less than 25% of entries less than 0.4 ICC. Low reproducibility was defined as a median ICC less than 0.4 or more than 25% of entries less than 0.4 ICC. Hence, the high reproducibility tracts were Fminor, CST (/R), ILF (L/R), SLF (L/R) and IFO (L/R). The moderate reproducibility tracts were CST (L), Fmajor, CNG (L/R). The low reproducibility tracts were UNC (L/R) and FNX (L/R). This above is observed when looking at all submissions however when observing the top 5 submissions we see higher reproducibility.
283 284 285
When the analysis is restricted to only the top five submissions, we see a different picture that suggests substantively reproducible methods. The inter-scanner reproducibility among the top 5 entries in ICC (min-max, average) are shown in Fig 6.
286 287 288 289 290
Figure 7 illustrates the top five entries for the tracts with the lowest inter-scanner reproducibility alongside the volumetric median (median per voxel from five submissions) of the top five entries. Qualitatively, the volumetric profiles of the UNC (L/R) and FNX (L/R) are very different across the top five entries. The first submission has small “core” tracts labeled, while the second, third and fifth found much larger spatial extents and the fourth was mid-way between.
291
4. DISCUSSION
292 293 294 295 296 297 298 299
The most reproducible tracts were Fminor, CST (\R), ILF (L\R), SLF (L\R), IFO (L\R), while the moderately reproducible tracts were Fmajor, CNG (L\R) and CST (\L). Lowest reproducibility tracts are UNC (L\R), FNX (L\R). These tracts have a well-spread/broad probability distribution. Note that the reproducibility of these tracts was maintained across imaging sessions and change of scanner. It is evident that all the algorithms entered are not consistently identifying the same fiber structures given the extreme variance observed in Figure 2. While most of the individual submissions show a reasonable detection of the tracts if observed from a ROI point of view (Fig 2), the difference between tract volumes between methods is quite high.
300 301 302 303 304
The reproducibility (ICC) of the entered algorithms varied from 0.27 to 0.97 (Fig 8A), but most of the algorithms performed with a reproducibility of 0.6 or higher. Similar levels of reproducibility were observed for methods that used selective shells or additional data from the Human Connectome Project. Note it would be inappropriate to assume independence and there are a few methods per categorical assignment, so statistical analysis across method types was not performed. 8
bioRxiv preprint first posted online Dec. 3, 2018; doi: http://dx.doi.org/10.1101/484543. The copyright holder for this preprint (which was not peer-reviewed) is the author/funder, who has granted bioRxiv a license to display the preprint in perpetuity. It is made available under a CC-BY 4.0 International license.
9
305 306 307 308
Qualitatively, CSD was the most popular approach as the pre-processing fiber reconstruction method (Fig 8B). Tensor and compartment models perform well, but trailed slightly behind CSD when comparing maximum values that have been achieved using these methods. The modified version of CSD with the addition of Deep Learning U-net also performed well.
309 310 311 312 313 314 315 316 317 318 319 320 321 322 323 324
The choices of analysis parameters appears to have affected method performance. A comparison of different step sizes that have been used shows that the most heavily used category was 0.2mm (Fig 8C). However, methods using all other step size choices (e.g., 0.005, 1 and 1.25mm) performed better in terms of ICC. A variety of threshold angles have been used lying in the range of 20 – 60 degrees (Fig 8D). The variation is hard to comment upon as this suggests that a threshold angle is specific to the type of tractography algorithm. High reproducibility has been achieved at lower threshold angles such as 20 degrees and at higher angles as well such as 45 or 60 degrees. Additional pre-processing before implementing fiber reconstruction methods shows improvement for ICC only when additional segmentation was performed (Fig 8E). A comparison of de-noising coupled with up-sampling and no additional pre-processing shows higher reproducibility when no additional steps are performed. While most of the algorithms did not use additional post-processing steps (Fig 8F), the few algorithms that used the methods of outlier rejection, spurious fiber removal and SIFT2 show improvement in reproducibility. In brief, it might be inferred that additional preprocessing and post-processing techniques are helpful in increasing the reproducibility of tractography algorithms, though a systematic test of this would be necessary to draw accurate conclusions.
325 326 327 328 329 330 331
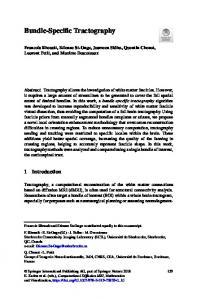
While it would be expected that an algorithm with empty or inaccurate bundles could achieve an extremely high ICC which would be representative of ‘null’ learning. Hence, we conducted consistency analysis using the containment index as to which bundles are contained inside which ones. The inaccurate ones will lie on the outside or show up as outliers which can be observed in Fig 9.
332 333 334 335 336 337 338 339 340 341 342
As seen in Fig 9, is moderate and variable (~0.4-0.6) for the first approximately 20 entries (after ordering) and then steadily increases for the CST, Cingulum, Forceps, ILF, IFO, and SLF. Hence, for smaller tractograms, approximately 50% of the variance is explained by nesting, but there are substantial contributions from other factors. For the larger tractograms (~20-46 ordered entries), the differences appear largely driven by increasing volume of the tracts. UNC and Fornix are a bit more variable between ordered methods, which indicates associations within methods and suggests disagreements across major categories of entries. Finally, the Fornix is highly variables across methods (~0.7) for the Fornix, IFO, ILF, but the remaining tracts were showed low CI for at least one method. Therefore, while at least one of the top methods differed from the others in a substantial manner, this could not be explained by volumetric differences of the tracts.
352
5. CONCLUSION
353 354 355 356 357 358
The most reproducible tracts considering all submitted algorithm outcomes are Fminor, CST (\R), ILF (L\R), SLF (L\R), IFO (L\R). The moderately reproducible ones are Fmajor, CNG (L\R) and CST (\L). Tracts with low reproducibility are UNC (L\R) and FNX (L\R). The most reproducible algorithms are 5A, 8D, 7A, 6E and 6F (Table 1) as per criteria of ICC. The mentioned algorithms are not an example of a consistent null learning as they all lie with in a nested containment with the largest covered volume.
359 360 361 362 363 364 365 366 367 368 369 370 371 372 373
In conclusion, the 2017 ISMRM TraCED Challenge created a publicly available multi-scanner, multi-scan in vivo reproducibility dataset and engaged nine groups with 46 algorithm entries. The TraCED Challenge dataset is freely available at www.synapse.org. Consistent with previous studies, reproducibility of tractograms was found to vary by anatomical tract. When viewed across all entries, reproducibility was concerning (ICC 0.85). Variation in performance were seen across processing parameters, but the challenge design did not provide sufficient number of samples to identify uniformly preferred design choices. The key novel finding of this challenge is that variations in tractography methods can be largely attributed to larger/smaller volumetric difference tradeoffs for the larger tracts, especially among methods that are tuned towards volumetrically larger tractograms. Yet, the different methods clearly result in fundamentally different tract structures at the more conservative specificity choices (i.e., volumetrically smaller tractograms). The containment index, containment energy, and containment index framework provides a consistent approach to evaluate the nesting structure tractograms, and the freely available data and results from this challenge can be used to quantify new tractography approaches.
374 375 376
10
bioRxiv preprint first posted online Dec. 3, 2018; doi: http://dx.doi.org/10.1101/484543. The copyright holder for this preprint (which was not peer-reviewed) is the author/funder, who has granted bioRxiv a license to display the preprint in perpetuity. It is made available under a CC-BY 4.0 International license.
11
Figure 1: The acquisition per session included five repeats of a single b0 and successively at b-values of 3000, 2000 and 1000 s/mm2 using 64, 48 and 20 gradient directions respectively. Each session was individually corrected using topup, eddy and then normalized. All the sessions were registered using flirt to the first session of scanner A.
377
11
bioRxiv preprint first posted online Dec. 3, 2018; doi: http://dx.doi.org/10.1101/484543. The copyright holder for this preprint (which was not peer-reviewed) is the author/funder, who has granted bioRxiv a license to display the preprint in perpetuity. It is made available under a CC-BY 4.0 International license.
12
Figure 2: Left: An overlay of all the 46 submissions from all sessions that were acquired using both scanners per tract Right: An overlay of a single submission using all sessions that were acquired using both scanners per tract A) Uncinate left B) Fornix left C) Cingulum eft D) Corticospinal tract left E) Inferior Longitudinal Fasciculus left F) Inferior Fronto-Occipital Fasciculus left G) Superior Longitudinal Fasciculus left H) Fminor.
378 379
12
bioRxiv preprint first posted online Dec. 3, 2018; doi: http://dx.doi.org/10.1101/484543. The copyright holder for this preprint (which was not peer-reviewed) is the author/funder, who has granted bioRxiv a license to display the preprint in perpetuity. It is made available under a CC-BY 4.0 International license.
13
Fig 3: A) Where the shape X is impeccably contained in Y and Y is contained in Z. The resulting containment CI(Y, X) = 1, CI(Z, X) = 1 and CI(Z, Y) = 1. B) Shape Y is a noisy representation of shape Z where CI(Y, Z) = 0.84. C) Shape Z is different from shape Y in a different orientation and the CI(Z,Y) = 0.17 380 381
13
bioRxiv preprint first posted online Dec. 3, 2018; doi: http://dx.doi.org/10.1101/484543. The copyright holder for this preprint (which was not peer-reviewed) is the author/funder, who has granted bioRxiv a license to display the preprint in perpetuity. It is made available under a CC-BY 4.0 International license.
14
Figure 4: Violin plots of intra-session submissions across both the scanners per tract. A) Dice similarity coefficients B) Intra-class correlation coefficients. The top row depicts the median of the top five intra session submissions. The tracts are in the following order (L/R): a) Uncinate b) Fornix c) Fminor & Fmajor d) Cingulum e) Corticospinal tract f) Inferior longitudinal fasciculus g) Superior longitudinal fasciculus h) Inferior frontooccipital tract
382 383 384 385 386
14
bioRxiv preprint first posted online Dec. 3, 2018; doi: http://dx.doi.org/10.1101/484543. The copyright holder for this preprint (which was not peer-reviewed) is the author/funder, who has granted bioRxiv a license to display the preprint in perpetuity. It is made available under a CC-BY 4.0 International license.
15
Figure 5: Violin plots of inter-session submissions across both the scanners per tract. A) Dice similarity coefficients B) Intra-class correlation coefficients. The top row depicts the median of the top five inter session submissions. The tracts are in the following order (L/R): a) Uncinate b) Fornix c) Fminor & Fmajor d) Cingulum e) Corticospinal tract f) Inferior longitudinal fasciculus g) Superior longitudinal fasciculus h) Inferior frontooccipital tract
387 388 389 390 391
15
bioRxiv preprint first posted online Dec. 3, 2018; doi: http://dx.doi.org/10.1101/484543. The copyright holder for this preprint (which was not peer-reviewed) is the author/funder, who has granted bioRxiv a license to display the preprint in perpetuity. It is made available under a CC-BY 4.0 International license.
16
Figure 6: Violin plots of inter-scanner submissions across both the scanners per tract. A) Dice similarity coefficients B) Intra-class correlation coefficients. The top row depicts the median of the top five inter scanner submissions. The tracts are in the following order (L/R): a) Uncinate b) Fornix c) Fminor & Fmajor d) Cingulum e) Corticospinal tract f) Inferior longitudinal fasciculus g) Superior longitudinal fasciculus h) Inferior frontooccipital tract
392 393 394 395 396
16
bioRxiv preprint first posted online Dec. 3, 2018; doi: http://dx.doi.org/10.1101/484543. The copyright holder for this preprint (which was not peer-reviewed) is the author/funder, who has granted bioRxiv a license to display the preprint in perpetuity. It is made available under a CC-BY 4.0 International license.
17
397
Figure 7: First row shows the median of Uncinate (L/R) and the top five submissions. The second row shows the median and submissions of Fornix (L/R).
398 399
17
bioRxiv preprint first posted online Dec. 3, 2018; doi: http://dx.doi.org/10.1101/484543. The copyright holder for this preprint (which was not peer-reviewed) is the author/funder, who has granted bioRxiv a license to display the preprint in perpetuity. It is made available under a CC-BY 4.0 International license.
18
Figure 8: A) Quantifies the number of algorithms that used a specific part of the dataset or added more from other sources. B) Quantifies the usage of HARDI/Tensor methods by different tractography algorithms as a pre-step. C & D) Quantifies the step size and threshold angle parameter for tractography algorithms. E & F) Quantify the number of additional pre-processing and post-processing techniques applied for the tractography algorithms.
400 401
18
bioRxiv preprint first posted online Dec. 3, 2018; doi: http://dx.doi.org/10.1101/484543. The copyright holder for this preprint (which was not peer-reviewed) is the author/funder, who has granted bioRxiv a license to display the preprint in perpetuity. It is made available under a CC-BY 4.0 International license.
19
Figure 9. Ordering entries to minimize containment energy (CE) shows that containment index is generally lower for the volumetrically smaller tractograms (toward “inside” on each subplot) and increases for the larger tractograms (toward “outside” on each subplot). Variations in containment explained the least amount of entry variability for the UNC and Fornix, while the other tracts were more consistent. The containment between all methods (A) were more variable and lower than the containment for the top five methods (B).
402 403 404 405 406 407 408 409
19
bioRxiv preprint first posted online Dec. 3, 2018; doi: http://dx.doi.org/10.1101/484543. The copyright holder for this preprint (which was not peer-reviewed) is the author/funder, who has granted bioRxiv a license to display the preprint in perpetuity. It is made available under a CC-BY 4.0 International license.
410 411 412 413 414 415 416 417 418 419 420 421 422 423 424 425 426 427 428 429 430 431 432 433 434 435 436 437 438 439 440 441 442 443 444 445 446 447 448 449 450 451 452
20
REFERENCES
1. 2. 3.
4. 5.
6. 7.
8. 9. 10.
11. 12.
13. 14.
15.
16. 17. 18.
Basser, P.J., J. Mattiello, and D. LeBihan, MR diffusion tensor spectroscopy and imaging. Biophysical journal, 1994. 66(1): p. 259-267. Jeurissen, B., et al., Diffusion MRI fiber tractography of the brain. NMR in Biomedicine, 2017. Jeurissen, B., et al., Investigating the prevalence of complex fiber configurations in white matter tissue with diffusion magnetic resonance imaging. Human brain mapping, 2013. 34(11): p. 2747-2766. Tuch, D.S., Q‐ball imaging. Magnetic resonance in medicine, 2004. 52(6): p. 1358-1372. Tournier, J.-D., et al., Direct estimation of the fiber orientation density function from diffusion-weighted MRI data using spherical deconvolution. NeuroImage, 2004. 23(3): p. 1176-1185. Jansons, K.M. and D.C. Alexander, Persistent angular structure: new insights from diffusion magnetic resonance imaging data. Inverse problems, 2003. 19(5): p. 1031. Schilling, K.G., et al., Empirical consideration of the effects of acquisition parameters and analysis model on clinically feasible q-ball imaging. Magnetic Resonance Imaging, 2017. 40: p. 62-74. Nath, V., Empirical Estimation of Intra-Voxel Structure with Persistent Angular Structure and Q-ball Models of Diffusion Weighted MRI. 2017. Smith, S.M., et al., Tract-based spatial statistics: voxelwise analysis of multi-subject diffusion data. Neuroimage, 2006. 31(4): p. 1487-1505. Lawes, I.N.C., et al., Atlas-based segmentation of white matter tracts of the human brain using diffusion tensor tractography and comparison with classical dissection. Neuroimage, 2008. 39(1): p. 62-79. Schmahmann, J.D., et al., Association fibre pathways of the brain: parallel observations from diffusion spectrum imaging and autoradiography. Brain, 2007. 130(3): p. 630-653. Dauguet, J., et al., Comparison of fiber tracts derived from in-vivo DTI tractography with 3D histological neural tract tracer reconstruction on a macaque brain. Neuroimage, 2007. 37(2): p. 530-538. Dyrby, T.B., et al., Validation of in vitro probabilistic tractography. Neuroimage, 2007. 37(4): p. 1267-1277. Donahue, C.J., et al., Using diffusion tractography to predict cortical connection strength and distance: a quantitative comparison with tracers in the monkey. Journal of Neuroscience, 2016. 36(25): p. 6758-6770. Thomas, C., et al., Anatomical accuracy of brain connections derived from diffusion MRI tractography is inherently limited. Proceedings of the National Academy of Sciences, 2014. 111(46): p. 16574-16579. Azadbakht, H., et al., Validation of high-resolution tractography against in vivo tracing in the macaque visual cortex. Cerebral Cortex, 2015. 25(11): p. 4299-4309. Knösche, T.R., et al., Validation of tractography: comparison with manganese tracing. Human brain mapping, 2015. 36(10): p. 4116-4134. Calabrese, E., et al., A diffusion MRI tractography connectome of the mouse brain and comparison with neuronal tracer data. Cerebral Cortex, 2015. 25(11): p. 4628-4637. 20
bioRxiv preprint first posted online Dec. 3, 2018; doi: http://dx.doi.org/10.1101/484543. The copyright holder for this preprint (which was not peer-reviewed) is the author/funder, who has granted bioRxiv a license to display the preprint in perpetuity. It is made available under a CC-BY 4.0 International license.
453 454 455 456 457 458 459 460 461 462 463 464 465 466 467 468 469 470 471 472 473 474 475 476 477 478 479 480 481 482 483 484
19.
485 486
32.
20. 21. 22.
23.
24.
25.
26.
27. 28. 29. 30. 31.
21
Côté, M.-A., et al., Tractometer: towards validation of tractography pipelines. Medical image analysis, 2013. 17(7): p. 844-857. Maier-Hein, K.H., et al., The challenge of mapping the human connectome based on diffusion tractography. Nature communications, 2017. 8(1): p. 1349. Neher, P.F., et al., Fiberfox: facilitating the creation of realistic white matter software phantoms. Magnetic resonance in medicine, 2014. 72(5): p. 1460-1470. Daducci, A., et al., Quantitative comparison of reconstruction methods for intra-voxel fiber recovery from diffusion MRI. IEEE transactions on medical imaging, 2014. 33(2): p. 384399. Ning, L., et al., Sparse Reconstruction Challenge for diffusion MRI: Validation on a physical phantom to determine which acquisition scheme and analysis method to use? Medical image analysis, 2015. 26(1): p. 316-331. Pujol, S., et al., The DTI challenge: toward standardized evaluation of diffusion tensor imaging tractography for neurosurgery. Journal of Neuroimaging, 2015. 25(6): p. 875882. Andersson, J.L. and S.N. Sotiropoulos, An integrated approach to correction for offresonance effects and subject movement in diffusion MR imaging. Neuroimage, 2016. 125: p. 1063-1078. Andersson, J.L., S. Skare, and J. Ashburner, How to correct susceptibility distortions in spin-echo echo-planar images: application to diffusion tensor imaging. Neuroimage, 2003. 20(2): p. 870-888. Smith, S.M., et al., Advances in functional and structural MR image analysis and implementation as FSL. Neuroimage, 2004. 23: p. S208-S219. Jenkinson, M. and S. Smith, A global optimisation method for robust affine registration of brain images. Medical image analysis, 2001. 5(2): p. 143-156. Leemans, A. and D.K. Jones, The B‐matrix must be rotated when correcting for subject motion in DTI data. Magnetic resonance in medicine, 2009. 61(6): p. 1336-1349. Asman, A.J. and B.A. Landman, Non-local statistical label fusion for multi-atlas segmentation. Medical image analysis, 2013. 17(2): p. 194-208. Huo, Y., et al. Combining multi-atlas segmentation with brain surface estimation. in Proceedings of SPIE--the International Society for Optical Engineering. 2016. NIH Public Access. Huo, Y., et al., Consistent cortical reconstruction and multi-atlas brain segmentation. NeuroImage, 2016. 138: p. 197-210.
487 488
21
22
bioRxiv preprint first posted online Dec. 3, 2018; doi: http://dx.doi.org/10.1101/484543. The copyright holder for this preprint (which was not peer-reviewed) is the author/funder, who has granted bioRxiv a license to display the preprint in perpetuity. It is made available under a CC-BY 4.0 International license.
489
Synapse Submission id
Algorithm ID
ICC
DICE
b-value shells
HARDI/Tensor Model
Step size
Threshold angle
Additional Processing
Pre-
syn8533598
1A
0.7753
0.6364
All shells
CSD
0.2mm
30 degrees
NA
Distance transform of bundle volumes
syn8643780
1B
0.6857
0.6596
All shells
CSD
0.2mm
30 degrees
NA
NA
syn8643793
1C
0.6343
0.6346
All shells
CSD
0.2mm
30 degrees
NA
Distance transform of bundle volumes
syn8648608
1D
0.7707
0.5402
All shells
CSD
0.2mm
30 degrees
NA
Distance transform of bundle volumes
syn8649314
1E
0.6498
0.6508
All shells
CSD
0.2mm
30 degrees
NA
NA
syn8649322
1F
0.6192
0.6197
All shells
CSD
0.2mm
30 degrees
NA
Distance transform of bundle volumes
syn8649611
1G
0.6324
0.6332
All shells
CSD
0.2mm
30 degrees
NA
Automatic spurious fiber removal
syn8649618
1H
0.6494
0.6503
All shells
CSD
0.2mm
30 degrees
NA
Automatic spurious fiber removal
syn8649622
1I
0.6517
0.6526
All shells
CSD
0.2mm
30 degrees
NA
Automatic spurious fiber removal
syn8649650
1J
0.6662
0.6671
All shells
CSD
0.2mm
30 degrees
NA
Automatic spurious fiber removal
syn8649652
1K
0.6616
0.6624
All shells
CSD
0.2mm
30 degrees
NA
Automatic spurious fiber removal
syn8649654
1L
0.6362
0.637
All shells
CSD
0.2mm
30 degrees
NA
Automatic spurious fiber removal
syn8649656
1M
0.7093
0.7103
All shells
CSD
0.2mm
30 degrees
NA
Automatic spurious fiber removal
syn8649658
1N
0.6984
0.6994
All shells
CSD
0.2mm
30 degrees
NA
Automatic spurious fiber removal
syn8555229
2A
0.8506
0.7918
All shells + 30 HCP subjects
CSD + U-net
0.2mm
20 degrees
NA
Spurious Removal
syn8656474
3A
0.7379
0.7253
b1000 b2000
Tensor Variant
0.2mm
25 degrees
Data Upsampling
NA
Post-Processing
Fiber
and
22
bioRxiv preprint first posted online Dec. 3, 2018; doi: http://dx.doi.org/10.1101/484543. The copyright holder for this preprint (which was not peer-reviewed) is the author/funder, who has granted bioRxiv a license to display the preprint in perpetuity. It is made available under a CC-BY 4.0 International license.
syn8656475
3B
0.6463
0.6341
b1000 b2000
syn8662707
4A
0.5285
0.5317
syn8662708
4B
0.5822
syn8662709
4C
syn8662710
23
and Tensor Variant
0.2mm
25 degrees
Data Upsampling
NA
b3000
CSD
0.2mm
20 degrees
Data Upsampling
NA
0.3207
b3000
CSD
0.2mm
20 degrees
Data Upsampling
NA
0.5881
NaN
b3000
CSD
0.2mm
20 degrees
Data Upsampling
NA
4D
0.5285
0.5317
b3000
CSD
0.2mm
20 degrees
Data Upsampling
NA
syn8662711
4E
0.5781
0.3182
b3000
CSD
0.2mm
20 degrees
Data Upsampling
NA
syn8662712
4F
0.5835
NaN
b3000
CSD
0.2mm
20 degrees
Data Upsampling
NA
syn8662713
4G
0.5285
0.5317
b3000
CSD
0.2mm
20 degrees
Data Upsampling
NA
syn8662714
4H
0.5291
0.4932
b3000
CSD
0.2mm
20 degrees
Data Upsampling
NA
syn8662715
4I
0.5302
NaN
b3000
CSD
0.2mm
20 degrees
Data Upsampling
NA
syn8662716
4J
0.5285
0.5317
b3000
CSD
0.2mm
20 degrees
Data Upsampling
NA
syn8662717
4K
0.5596
0.5323
b3000
CSD
0.2mm
20 degrees
Data Upsampling
NA
syn8662718
4L
0.5616
NaN
b3000
CSD
0.2mm
20 degrees
Data Upsampling
NA
syn8664905
5A
0.9738
0.8231
All shells
CSD
1.25mm
45 degrees
Additional Segmentation
SIFT2
syn8666133
6A
0.7702
0.7708
All shells
Tensor Variant
1mm
40 degrees
Denoising, Upsampling
Outlier Rejection
syn8666134
6B
0.8358
0.5742
All shells
Tensor Variant
1mm
40 degrees
Denoising, Upsampling
Outlier Rejection
syn8666135
6C
0.8171
0.7595
All shells
Tensor Variant
1mm
40 degrees
Denoising, Upsampling
Outlier Rejection
syn8666136
6D
0.817
0.7704
All shells
Tensor Variant
1mm
40 degrees
Denoising, Upsampling
Outlier Rejection
syn8666137
6E
0.8586
0.571
All shells
Tensor Variant
1mm
40 degrees
Denoising, Upsampling
Outlier Rejection
syn8666138
6F
0.8458
0.7646
All shells
Tensor Variant
1mm
40 degrees
Denoising, Upsampling
Outlier Rejection
syn8667007
7A
0.8868
0.6187
b3000
CSD
1.25mm
40 degrees
NA
NA
23
24
bioRxiv preprint first posted online Dec. 3, 2018; doi: http://dx.doi.org/10.1101/484543. The copyright holder for this preprint (which was not peer-reviewed) is the author/funder, who has granted bioRxiv a license to display the preprint in perpetuity. It is made available under a CC-BY 4.0 International license.
490 491
8A
0.86
0.8672
All shells
Compartment Model
0.005mm
60 degrees
NA
Spurious Removal
Fiber
syn8666587
8B
0.8367
0.5166
All shells
Compartment Model
0.005mm
60 degrees
NA
Spurious Removal
Fiber
syn8666598
8C
0.8349
0.5287
All shells
Compartment Model
0.005mm
60 degrees
NA
Spurious Removal
Fiber
syn8666602
8D
0.8901
0.6409
All shells
Compartment Model
0.005mm
60 degrees
NA
Spurious Removal
Fiber
syn8666936
8E
0.8145
0.4983
All shells
Compartment Model
0.005mm
60 degrees
NA
Spurious Removal
Fiber
syn8667021
8F
0.8103
0.4773
All shells
Compartment Model
0.005mm
60 degrees
NA
Spurious Removal
Fiber
syn8667022
syn8698866
9A
0.6145
0.6015
All shells
CSD
0.2mm
40 degrees
Addtional Segmentation
NA
syn8698867
9B
0.6968
0.6804
All shells
CSD
0.2mm
40 degrees
Addtional Segmentation
NA
syn8698868
9C
0.2703
0.2572
All shells
CSD
0.2mm
40 degrees
Addtional Segmentation
NA
Table 1: The table presents all the hyper-parameters of the different algorithms that were submitted and an overall evaluation of the algorithm in terms of ICC and Dice.
492 493
ACKNOWLEDGEMENTS
494 495 496 497 498 499 500 501
This work was supported by R01EB017230 (Landman). This work was conducted in part using the resources of the Advanced Computing Center for Research and Education at Vanderbilt University, Nashville, TN. This project was supported in part by the National Center for Research Resources, Grant UL1 RR024975-01, and is now at the National Center for Advancing Translational Sciences, Grant 2 UL1 TR000445-06. The content is solely the responsibility of the authors and does not necessarily represent the official views of the NIH. This work is supported in part by China Scholarship Council Scholarship. This work was supported in part by the National Natural Science Foundation of China (Grant No. 61379020).
502 503
24