Traffic-aware Stress Testing of Distributed. Real-Time Systems based on UML Models using Genetic Algorithms. By. Vahid Garousi. A thesis submitted to.
Traffic-aware Stress Testing of Distributed Real-Time Systems based on UML Models using Genetic Algorithms By
Vahid Garousi
A thesis submitted to The Faculty of Graduate Studies and Research In partial fulfillment of the requirements of the degree of Doctor of Philosophy
Ottawa-Carleton Institute of Electrical and Computer Engineering Department of Systems and Computer Engineering Carleton University Ottawa, Ontario, K1S 5B6 Canada August 2006
Copyright © 2006 by Vahid Garousi
The undersigned hereby recommend to The Faculty of Graduate Studies and Research Acceptance of the thesis
Traffic-aware Stress Testing of Distributed Real-Time Systems based on UML Models using Genetic Algorithms Submitted by Vahid Garousi In partial fulfillment of the requirements for the degree of Doctor of Philosophy
_______________________________________________ Professor L. C. Briand (Co-Supervisor)
_______________________________________________ Professor Y. Labiche (Co-Supervisor)
_______________________________________________ Professor V. C. Aitken (Department Chair)
Carleton University August 2006
iii
Abstract A stress test methodology aimed at increasing chances of discovering faults related to distributed traffic in distributed systems is presented. The technique uses as input a specified UML 2.0 model of a system, augmented with timing information, and yields stress test requirements composed of specific Control Flow Paths along with time values to trigger them. We propose different variants of our stress testing methodology to test networks and nodes of a system under test according to various heuristics. Using a real-world system specification, we design and implement a prototype distributed system and describe, for that particular system, how the stress test cases are derived and executed using our methodology. We report the results of applying our stress test methodology on the prototype system and discuss the usefulness of the technique. Results indicate that the technique is significantly more effective at detecting distributed traffic-related faults when compared to standard test cases based on an operational profile. Furthermore, a sophisticated stress test technique based on Genetic Algorithms is proposed to handle specific constraints in the context of Real-Time distributed systems.
iv
Acknowledgments I would like to express my sincere gratitude to all the people who have been an integral part of my graduate experience. First and foremost I would like to thank my thesis advisors: Prof. Lionel C. Briand and Dr. Yvan Labiche for their help and guidance throughout my PhD career. Lionel and Yvan, thanks for supervising my work with continuous encouragement, interest and enthusiasm. Our discussions always gave me thinking material for a few days of mental digestion, resulting in an extremely stimulating guidance. I am greatly indebted for your genuine interest in my work and for the high quality of your advices. Merci beaucoup tous les deux! I would like to thank my thesis committee members: Dr. Jeff Offutt, Dr. Alan Williams, Dr. Nicola Santoro, Dr. Greg Franks, and Dr. Murray Woodside for taking the time to read this thesis and providing me with valuable comments. I would like to thank Siemens Corporate Research in New Jersey and the Canada research chair fund in Software Quality Engineering for supporting my PhD work financially. I would also like to thank everyone at the SQUALL Lab for a great work environment. I had the pleasure to be a colleague of the following individuals (in alphabetical order): Zaheer Bawar, Michael G. Bowman, Hongyan Chen, Jim Cui, Daniel Di Nardo, Bin Dong, Wojciech Dzidek, Maged Elaasar, Wladimir de Lara Araujo Filho, Joanne Leduc, Qing Lin, Xuetao Liu, Yanhua Liu, Reymes M. Rivera, Samar Mouchawrab, Alex Sauve, Mike Sowka, Tao Yue, and Gregory Zoughbi. My thanks also goes to the friendly staff at our department office: Blazenka Power, Jennifer Poll, Darlene Hebert, and Anna Lee for providing support in many occasions.
v On a personal note, even if I was more than 9,084 km away from my homeland (Miyana, Azerbaijan), I had any moment the possibility to find a piece of Azerbaijani culture, humor or spirituality thanks to the community of Azerbaijanis in Ottawa and in Canada (in large): Şovqi Mürsəlov, Fəriba Zəmanı, Şəhruz Torfax, Faxtə Zəmanı, Əli Bəxşı, Əkbər Macidov, Nazila Isgəndərova, Şəhriyar Rəhnəmayan, Fəxrəddin Qurbanov, Ceyhun Şahverdiyev, and Orxan Haciyev; to name among many. Thank you all for the good time I spent in your company. Şovqi, thanks for devoting your time to teach me how to play Tar, and thanks for inviting us all to dinner parties at your place to feel at home in many occasions. Şəhruz, thanks for your real friendship. Hammınız, sağ olun! I would also like to express my appreciation to my master's supervisor, Prof. Amir Keyvan Khandani, and his wife, Dr. Ladan Tahvildari (faculty members of the University of Waterloo), who provided me with academic and personal encouragements in many occasions. Kheili mamnoon! Last but not least, I am indebted to Xiao Han whose love, encouragement and support in the past several years made all this work possible. Furthermore, my family members were always sources of support from a long distance: my parents Sürəyya and Yusif, my sisters Sonya, Röya and Gülara, and my brother Nəvid. I could not have achieved this without their unlimited help and encouragements. Sizə bır ömur can sağlıqı, uğurlar və səlamət arzulayıram! Vahid Garousi August 2006 Ottawa, Canada
vi
vii
To my parents: Surayya Shahbazi and Yusif Garousi and my homeland: Azerbaijan
Ana və atama: Sürəyya Şəhbazlı and Yusif Gəruslı və ana yurduma: Azərbaycan
viii Table of Contents CHAPTER 1 INTRODUCTION ......................................................................................1 1.1 MOTIVATION AND GOAL..............................................................................................1 1.2 APPROACH ...................................................................................................................3 1.3 CONTRIBUTIONS ..........................................................................................................4 1.4 STRUCTURE .................................................................................................................5 CHAPTER 2 BACKGROUND.........................................................................................7 2.1 RELATED WORKS ........................................................................................................7 2.2 PROBLEM STATEMENT (INITIAL)................................................................................12 2.3 TERMINOLOGY ...........................................................................................................12 2.4 UML PROFILE FOR SCHEDULABILITY, PERFORMANCE, AND TIME.............................14 2.5 AN OVERVIEW ON UML 2.0 SEQUENCE DIAGRAMS ..................................................17 CHAPTER 3 AN EXTENDED FAULT TAXONOMY FOR DISTRIBUTED REALTIME SYSTEMS .............................................................................................................20 3.1 AN EXTENDED FAULT CLASSIFICATION FOR DISTRIBUTED REAL-TIME SYSTEMS .....21 3.1.1 Persistency of Faults ..........................................................................................23 3.1.2 Distribution ........................................................................................................25 3.1.3 Time Criticality ..................................................................................................30 3.1.4 Concurrency .......................................................................................................30 3.1.5 Resource-Usage Orientation..............................................................................31 3.1.6 Location of Creation or Occurrence..................................................................32 3.2 CHAIN OF DISTRIBUTION FAULTS ..............................................................................32 3.3 CLASS OF FAULTS CONSIDERED IN THIS WORK .........................................................33 CHAPTER 4 OVERVIEW OF THE STRESS TEST METHODOLOGY ................34 4.1 STRESS TEST METHODOLOGY....................................................................................34 4.2 INPUT AND INTERMEDIATE MODELS IN OUR STRESS TEST METHODOLOGY ...............36 4.2.1 Input System Design Models ..............................................................................36 4.2.2 Test Models ........................................................................................................38 CHAPTER 5 INPUT SYSTEM MODEL ......................................................................41 5.1 SEQUENCE DIAGRAM .................................................................................................42 5.1.1 Timing Information of Messages in SDs ............................................................44 5.2 CLASS DIAGRAM .......................................................................................................48 5.3 MODIFIED INTERACTION OVERVIEW DIAGRAMS .......................................................49 5.3.1 Existing Representations to Model Inter-SD Constraints ..................................51 5.3.2 Modified Interaction Overview Diagrams .........................................................55 5.4 CONTEXT DIAGRAM...................................................................................................56 5.5 NETWORK DEPLOYMENT DIAGRAM...........................................................................58 5.5.1 Extending the Notation of UML 2.0 Deployment Diagrams..............................61 5.5.2 Network Interconnectivity Graph.......................................................................63 5.6 MODELING REAL-TIME CONSTRAINTS ......................................................................64 CHAPTER 6 CONTROL FLOW ANALYSIS OF SEQUENCE DIAGRAMS.........69 6.1 AN OVERVIEW OF OUR CONTROL FLOW ANALYSIS TECHNIQUE................................70 6.1.1 Challenges of SDs’ CFA ....................................................................................70 6.1.2 Towards a CFM for SDs ....................................................................................72 6.1.3 Concurrent Control Flow Graph: a Control Flow Model for SDs ....................74
ix 6.1.4 Consistency Mapping Rules from SDs to CCFGs..............................................77 6.1.5 Concurrent Control Flow Paths.........................................................................83 6.2 INCORPORATING DISTRIBUTION AND TIMING INFORMATION IN CCFPS.....................84 6.3 FORMALIZING MESSAGES ..........................................................................................85 6.4 DISTRIBUTED CCFP ..................................................................................................87 6.5 TIMED INTER-NODE AND INTER-NETWORK REPRESENTATIONS OF DCCFPS ............88 CHAPTER 7 CONSIDERING INTER-SD CONSTRAINTS .....................................91 7.1 INDEPENDENT-SD SETS .............................................................................................93 7.1.1 Definitions ..........................................................................................................94 7.1.2 Derivation of Independent-SD Sets ....................................................................95 7.1.3 Algorithm Complexity ........................................................................................97 7.2 CONCURRENT SD FLOW PATHS, CCFP AND DCCFP SEQUENCES .............................98 7.2.1 Concurrent SD Flow Paths ................................................................................98 7.2.2 Concurrent Control Flow Paths Sequence.......................................................100 7.2.3 Duration of a Concurrent Control Flow Path Sequence .................................102 CHAPTER 8 RESOURCE USAGE ANALYSIS OF DISTRIBUTED TRAFFIC..105 8.1 ESTIMATING THE DATA SIZE OF A DISTRIBUTED MESSAGE .....................................106 8.1.1 Effect of Inheritance .........................................................................................109 8.1.2 Messages with Indeterministic Sizes ................................................................110 8.2 FORMALIZING RELATIONSHIPS BETWEEN NODES AND NETWORKS ..........................111 8.2.1 Node-Network and Network-Network Memberships........................................112 8.2.2 Network Paths Function...................................................................................113 8.3 DISTRIBUTED TRAFFIC USAGE ATTRIBUTES ............................................................113 8.3.1 Location: Nodes vs. Networks..........................................................................114 8.3.2 Direction (for nodes only): In, Out, Bidirectional ...........................................116 8.3.3 Type: Amount of Data vs. Number of Network Messages................................117 8.3.4 Duration: Instant vs. Interval...........................................................................119 8.4 ASPECTS TO CONSIDER WHEN ESTIMATING NETWORK TRAFFIC USAGE..................121 8.4.1 Effects of Multiple Network Paths between Nodes...........................................121 8.4.2 Delay in Network Transmissions......................................................................124 8.4.3 Traffic Distribution of Messages with Durations more than a Time Unit .......126 8.4.4 Effect of Concurrent Processes ........................................................................127 8.5 A CLASS OF TRAFFIC USAGE ANALYSIS FUNCTIONS ...............................................128 8.5.1 Naming Convention..........................................................................................128 8.5.2 Functions..........................................................................................................129 CHAPTER 9 TIME-SHIFTING STRESS TEST TECHNIQUE..............................136 9.1 PROBLEM STATEMENT: REVISITED ..........................................................................137 9.2 STRESS TEST HEURISTIC ..........................................................................................137 9.3 AN EXAMPLE TO ILLUSTRATE THE HEURISTIC .........................................................138 9.4 EXCERPTS ................................................................................................................141 CHAPTER 10 GENETIC ALGORITHM-BASED STRESS TEST TECHNIQUE143 10.1 TYPES OF ARRIVAL PATTERNS ...............................................................................145 10.2 ANALYSIS OF ARRIVAL PATTERNS.........................................................................149 10.3 ACCEPTED TIME SETS ............................................................................................154 10.4 FORMULATING THE PROBLEM AS AN OPTIMIZATION PROBLEM .............................159 10.5 IMPACT OF ARRIVAL PATTERNS ON STRESS TEST STRATEGIES..............................159
x 10.5.1 Impact on Instant Stress Test Strategies ........................................................160 10.5.2 Impact on Interval Stress Test Strategies.......................................................160 10.5.3 How Arrival Patterns are Addressed by Stress Test Strategies .....................164 10.6 CHOICE OF THE OPTIMIZATION METHODOLOGY: GENETIC ALGORITHMS ..............165 10.7 TAILORING GENETIC ALGORITHM TO DERIVE INSTANT STRESS TEST REQUIREMENTS .............................................................................................................167 10.7.1 Chromosome...................................................................................................168 10.7.2 Constraints .....................................................................................................171 10.7.3 Initial Population ...........................................................................................172 10.7.4 Determining a Maximum Search Time...........................................................175 10.7.5 Objective (Fitness) Function..........................................................................182 10.7.6 Operators .......................................................................................................184 10.8 INTERVAL STRESS TEST STRATEGIES ACCOUNTING FOR ARRIVAL PATTERNS .......191 10.9 IMPACTS OF UNCERTAINTY IN TIMING INFORMATION ON OUR STRESS TEST METHODOLOGY .............................................................................................................197 10.10 WAIT-NOTIFY STRESS TEST TECHNIQUE .............................................................199 CHAPTER 11 AUTOMATION AND ITS EMPIRICAL ANALYSIS.....................202 11.1 GALIB ...................................................................................................................202 11.2 GARUS.................................................................................................................204 11.2.1 Class Diagram................................................................................................204 11.2.2 Activity Diagram ............................................................................................206 11.2.3 Input File Format ...........................................................................................207 11.2.4 Output File Format ........................................................................................211 11.3 VALIDATION OF TEST REQUIREMENTS GENERATED BY GARUS...........................212 11.3.1 Satisfaction of ATSs by Start Times of DCCFPs in the Generated Stress Test Requirements.............................................................................................................215 11.3.2 Checking the extent to which ISTOF is maximized ........................................216 11.3.3 Repeatability of GA Results across Multiple Runs.........................................218 11.3.4 Convergence Efficiency across Generations..................................................220 11.3.5 Our Strategy for Investigating Variability/Scalability ...................................224 11.3.6 Impacts of Test Model Size (Scalability of the GA)........................................234 11.3.7 Impacts of Arrival Pattern Types ...................................................................245 11.3.8 Impacts of Arrival Pattern Parameters..........................................................252 11.3.9 Impact of Maximum Search Time...................................................................264 CHAPTER 12 CASE STUDY.......................................................................................268 12.1 AN OVERVIEW OF TARGET SYSTEMS .....................................................................269 12.2 CHOOSING A TARGET SYSTEM AS CASE STUDY .....................................................271 12.2.1 Requirements for a Suitable Case Study ........................................................271 12.2.2 None of the Systems in our survey Meets the Requirements ..........................272 12.3 OUR PROTOTYPE SYSTEM: A SCADA-BASED POWER SYSTEM .............................274 12.3.1 SCAPS Specifications.....................................................................................274 12.3.2 SCAPS Meets the Case-Study Requirements..................................................276 12.3.3 SCAPS UML Design Model ...........................................................................277 12.3.4 Stress Test Objective ......................................................................................291 12.3.5 Implementation...............................................................................................292 12.3.6 Hardware and Network Specifications ..........................................................294
xi 12.4 STRESS TEST ARCHITECTURE ................................................................................295 12.5 RUNNING STRESS TEST CASES...............................................................................297 12.6 BUILDING THE STRESS TEST MODEL FOR SCAPS .................................................298 12.6.1 Network Interconnectivity Tree......................................................................298 12.6.2 Control Flow Analysis of SDs ........................................................................299 12.6.3 Derivation of Distributed Concurrent Control Flow Paths ...........................302 12.6.4 Derivation of Independent-SD Sets ................................................................303 12.6.5 Derivation of Concurrent SD Flow Paths......................................................304 12.6.6 Data Size of Messages....................................................................................306 12.7 STRESS TESTING SCAPS BY TIME-SHIFTING STRESS TEST TECHNIQUE ................307 12.8 STRESS TESTING SCAPS BY GENETIC ALGORITHM-BASED STRESS TEST TECHNIQUE308 12.8.1 Using GARUS to Derive Stress Test Requirements .......................................308 12.8.2 Test Results.....................................................................................................318 12.8.3 Conclusions ....................................................................................................324 CHAPTER 13 GENERALIZATION OF OUR STRESS TEST METHODOLOGY TO TARGET OTHER TYPES OF FAULTS .............................................................325 13.1 TARGETING OTHER TYPES OF RESOURCES .............................................................325 13.1.1 Resource Usage Analysis of other Types of Resources..................................326 13.1.2 CPU................................................................................................................329 13.1.3 Memory...........................................................................................................333 13.2 TARGETING OTHER TYPES OF FAULTS ...................................................................335 13.2.1 Distributed Unavailability Faults ..................................................................336 13.2.2 Resource Unavailability Faults......................................................................338 13.2.3 Concurrency Faults........................................................................................339 CHAPTER 14 SUMMARY...........................................................................................343 14.1 CONCLUSIONS ........................................................................................................343 14.2 FUTURE RESEARCH DIRECTIONS ...........................................................................345
xii List of Tables Table 1-A stereotype to model SRT constraints. .............................................................. 67 Table 2-A stereotype to model HRT constraints. ............................................................. 67 Table 3-Tagged values of SRT and HRT stereotypes. ..................................................... 67 Table 4- Mapping rules from SDs to CCFGs. .................................................................. 78 Table 5-Data size of some of the primitive data types in Java (adopted from [75])....... 109 Table 6-A set of heuristics to identify a suitable MST (MSTsuitable). .............................. 179 Table 7-(a): Durations of several CCFPs. (b): Arrival patterns of several SDs. ............ 196 Table 8-Output format of 10 schedules generated by GARUS. ..................................... 217 Table 9-Descriptive statistics of the maximum ISTOF values over 1000 runs. Values are in units of data traffic (e.g. KB)...................................................................................... 218 Table 10-Summary of GARUS results for five runs. ..................................................... 223 Table 11- Variability parameters for experimental test models...................................... 225 Table 12-Experimental test models with different sizes................................................. 230 Table 13-Experimental test models with variations in SD arrival patterns. ................... 232 Table 14-Execution time statistics of 1000 runs of tm1…tm6. ......................................... 235 Table 15-Descriptive statistics of the maximum ISTOF values for each test model over 1000 runs. Values are in units of data traffic. ................................................................. 239 Table 16-Descriptive statistics of the maximum stress time values for each test model over 1000 runs. Values are in time units......................................................................... 243 Table 17-Minimum, maximum and average values of the generation numbers when a stable maximum fitness plateau is reached in 1000 runs of each test model.................. 245 Table 18-Execution time statistics of 1000 runs of tm7…tm11. ........................................ 246 Table 19-Descriptive statistics of the maximum ISTOF values for each test model over 1000 runs. Values are in units of data traffic. ................................................................. 249 Table 20-Descriptive statistics of the maximum stress time values for each test model over 1000 runs. Values are in time units......................................................................... 250 Table 21-Minimum, maximum and average values of the generation numbers when a stable maximum fitness plateau is reached in 1000 runs of each test model.................. 252 Table 22-Execution time statistics of 1000 runs of tm8, tm9, tm10, tm12,…tm18. ....... 255 Table 23-Descriptive statistics of the distributions in Figure 109. ................................. 257 Table 24-Descriptive statistics of the distributions in Figure 110. ................................. 259 Table 25-Descriptive statistics of the distributions in Figure 111. ................................. 262 Table 26-Descriptive statistics of the distributions in Figure 112. ................................. 267 Table 27-Mean data sizes of the entity data classes of SCAPS...................................... 307 Table 28-An operational profile for SCAPS................................................................... 320 Table 29-Probabilities of taking DCCFPs of SDs OC and PRNF according to the operational profile given in Table 28.............................................................................. 321 Table 30-Quantiles of the distributions in Figure 144. ................................................... 323
xiii List of Figures Figure 1-The structure of the GRM Framework of the UML-SPT profile [12]. .............. 15 Figure 2-Part of the deployment architecture of a chemical reactor system..................... 16 Figure 3-Example of time modeling using UML-SPT profile.......................................... 17 Figure 4-UML 2.0 Sequence Diagram Metamodel. ......................................................... 18 Figure 5-An example illustrating the new features of the UML 2.0 SDs. ........................ 19 Figure 6-The fundamental chain of dependability threats. ............................................... 21 Figure 7-Tree of Generalized Fault Classes for Distributed Systems............................... 23 Figure 8-Occurrences of Distributed Unavailability Faults (DUF). ................................. 27 Figure 9-An example scenario showing how a distributed traffic fault might happen..... 29 Figure 10- Overview of our model-based stress test methodology (a UML activity diagram). ........................................................................................................................... 35 Figure 11- Metamodel of input and intermediate test models in our stress test methodology. .................................................................................................................... 37 Figure 12-Modeling the deployment node of an object using node tagged value. ........... 43 Figure 13- Probabilistic representation of uncertainty in a task’s execution times. ......... 47 Figure 14-The approach in which the different SD constraint types are considered by the two optimization algorithms in this work. ........................................................................ 50 Figure 15- Use Case Sequential Constraints for the Librarian actor (adopted from [60]). ........................................................................................................................................... 52 Figure 16-Interaction Overview Diagram (IOD) of a simplified ATM system................ 54 Figure 17- Modified Interaction Overview Diagram (MIOD) of a simplified ATM system. .............................................................................................................................. 55 Figure 18-A controller system made of several sensors. .................................................. 57 Figure 19-(a): Modeling concurrent instances of SDs inside MIOD. (b): Equivalent in meaning to (a). .................................................................................................................. 58 Figure 20-A simple network deployment for an online shopping service........................ 59 Figure 21-A metamodel for network topologies............................................................... 60 Figure 22-A network topology.......................................................................................... 60 Figure 23-Using a Network Deployment Diagram (NDD) to model the network topology of Figure 22....................................................................................................................... 62 Figure 24-Modeling network interconnectivity of a university network.......................... 63 Figure 25-Network Interconnectivity Graph (NIG) of the topology in Figure 22............ 64 Figure 26- Examples usages of the «SRTaction» and «HRTaction» stereotypes in a SD and in a MIOD. ................................................................................................................. 68 Figure 27-A SD with asynchronous messages.................................................................. 71 Figure 28- A SD with par operator................................................................................... 72 Figure 29- CCFG metamodel............................................................................................ 75 Figure 30-CCFG of the SD in Figure 27. ......................................................................... 79 Figure 31-(a)-Part of the CCFG instance ccfg mapped from the SD in Figure 27, satisfying the consistency rule #2. (b)-Part of the CCFG, corresponding to the instance shown in (a)....................................................................................................................... 81 Figure 32-(a):Part of the CCFG instance ccfg mapped from the SD in Figure 27, satisfying the consistency rule #3. (b): Part of the CCFG, corresponding to the instance shown in (a)....................................................................................................................... 83 Figure 33-CCFPs of the CCFG in Figure 30. ................................................................... 83
xiv Figure 34- DCCFPs of the CCFPs in Figure 33. .............................................................. 88 Figure 35-Timed inter-node representation of DCCFP(ρ2) in Figure 34. ........................ 89 Figure 36-A simple system NIG. ...................................................................................... 89 Figure 37-Timed inter-network representation of a DCCFP. ........................................... 90 Figure 38- The MIOD of a library system. ....................................................................... 93 Figure 39-The Independent SD Graph (ISDG) corresponding to the MIOD in Figure 38. The ISDS={A,B,G,H} is shown with dashed edges. ......................................................... 96 Figure 40-A MIOD with a multi-SD construct................................................................. 97 Figure 41-An example MIOD and the CCFG of one of its SDs....................................... 99 Figure 42-The call tree of the recursive algorithm Duration applied to CCFPS1. ......... 104 Figure 43-A class diagram showing three classes with data fields................................. 109 Figure 44-A Network Interconnectivity Graph (NIG).................................................... 112 Figure 45-A system made up of four nodes and three networks. ................................... 115 Figure 46-Timed inter-node and inter-network representations of three DCCFPs......... 116 Figure 47-A typical system composed of two nodes and four processes. ...................... 118 Figure 48-Network traffic diagram (data traffic) of DCFP2 in Figure 47. ..................... 118 Figure 49-Network traffic diagram (number of distributed messages) of DCFP2 in Figure 47..................................................................................................................................... 119 Figure 50-“In-data” traffic diagram of a node, highlighting difference between instant and interval (3ms) traffic. ............................................................................................... 120 Figure 51-Example Network Interconnectivity Graph (NIG). ....................................... 122 Figure 52-A Network Deployment Diagram (NDD) annotted with network transmission delay information. ........................................................................................................... 125 Figure 53-The data traffic diagram of a node with two processes.................................. 127 Figure 54-Naming convention for the traffic usage functions........................................ 128 Figure 55-A simple system NIG. .................................................................................... 138 Figure 56-Heuristic to stress test instant data traffic on a network................................. 140 Figure 57-Activity diagram of stress test strategy StressNetInsDT(net). ....................... 141 Figure 58- Pseudo-code to check if the arrival pattern AP is satisfied by an arrival time. ......................................................................................................................................... 150 Figure 59-Accepted Time Intervals (ATI) of a bounded arrival pattern (‘bounded’, (4, ms), (5, ms)), i.e. MinIAT=4ms, MaxIAT=5ms.............................................................. 151 Figure 60-Accepted Time Intervals (ATI) of the bursty arrival pattern (‘bursty’, (5, ms), 2). .................................................................................................................................... 152 Figure 61-Accepted Time Points (ATP) of the irregular inter-arrival pattern (‘irregular’, (1, ms), (5, ms), (6, ms), (8, ms), (10, ms))...................................................................... 153 Figure 62-Accepted Time Intervals (ATI) of the periodic inter-arrival pattern (‘periodic’, (5, ms), (1, ms)). .............................................................................................................. 153 Figure 63-Probability Distribution Function (PDF) of (‘poisson’, (5, ms)) arrival pattern. ......................................................................................................................................... 154 Figure 64-(a): Accepted Time Set (ATS) metamodel. (b): Three instances of the metamodel....................................................................................................................... 155 Figure 65- Illustrating the overlap of two ATSs’ intervals............................................. 158 Figure 66-Example intersections of two ATSs............................................................... 158 Figure 67-Formulating the problem of generating stress test requirements as an optimization problem. ..................................................................................................... 159
xv Figure 68-Impact of arrival patterns on instant (a)-(b) and interval (c)-(d) stress test strategies. ........................................................................................................................ 162 Figure 69-SD arrival pattern constraints......................................................................... 164 Figure 70-(a): Metamodel of chromosomes and genes in our GA algorithm. (b): Part of an instance of the metamodel.......................................................................................... 169 Figure 71- Constraint #1 of the GA (an OCL expression).............................................. 171 Figure 72-Constraint #2 of the GA (an OCL function). ................................................. 172 Figure 73-Pseudo-code to generate a chromosome for the GA’s initial population....... 173 Figure 74-An example where the ATS intersection of all SDs is null, but they can overlap............................................................................................................................. 175 Figure 75-Impact of maximum search time on exercising the time domain. ................. 177 Figure 76- The ATSs of three irregular APs................................................................... 178 Figure 77-Illustration showing the heuristic of choosing a suitable maximum search time. ......................................................................................................................................... 181 Figure 78-Computing the Instant Stress Test Objective Function (ISTOF) value of a chromosome.................................................................................................................... 184 Figure 79-Crossover operators........................................................................................ 187 Figure 80-Two example uses of the crossover operators................................................ 188 Figure 81- DCCFPMutation operator............................................................................. 191 Figure 82- startTimeMutation operator. ......................................................................... 191 Figure 83- ISDSMutation operator.................................................................................. 191 Figure 84-Impact of arrival patterns on the duration of a CCFP. ................................... 195 Figure 85-Call tree of the recursive algorithm minAPDuration applied to a CCFPS. ... 197 Figure 86-Heuristics of the Wait-Notify Stress Test Technique (WNSTT). .................. 201 Figure 87-Basic GAlib class hierarchy (adopted from [99]). ......................................... 203 Figure 88-Simplified class diagram of GARUS. ............................................................ 205 Figure 89-Overview activity diagram of GARUS. ......................................................... 207 Figure 90-GARUS input file format. .............................................................................. 208 Figure 91-An example input file of GARUS.................................................................. 210 Figure 92-An example DTUP of a DCCFP. ................................................................... 210 Figure 93-(a): Stress test requirements format in GARUS output file. (b): An example. ......................................................................................................................................... 212 Figure 94-ATSs of the SDs in the TM in Figure 91, and a stress test schedule generated by GARUS. ..................................................................................................................... 215 Figure 95-Modified DCCFPs of the test model in Figure 91. ........................................ 217 Figure 96-(a): Histogram of maximum ISTOF and stress time values for 1000 runs of test model corresponding to the input file in Figure 91. (b): Corresponding max stress time values for one of the frequent maximum ISTOF values (72 units of traffic). ................ 219 Figure 97-Histogram of the generation numbers when a stable maximum fitness plateau is reached in 1000 runs of the test model corresponding to the input file in Figure 91 by GARUS. .......................................................................................................................... 221 Figure 98-Simplified activity diagram of our random test model generator. ................. 228 Figure 99-Visualization of the average values in Table 14. ........................................... 235 Figure 100-Histograms of maximum ISTOF values (y-axis) for 1000 runs of each test model. The y-axis values are in traffic units................................................................... 239
xvi Figure 101- Probability of the event that at least one test requirement with an ISTOF value in group70 is yielded in a series of n runs of GARUS. .......................................... 240 Figure 102-Histograms of maximum stress time values for 1000 runs of each test model. The y-axis values are in time units. ................................................................................ 242 Figure 103- Histograms of the generation numbers when a stable maximum fitness plateau is reached in 1000 runs of each test model......................................................... 244 Figure 104-Visualization of the average values in Table 18. ......................................... 246 Figure 105-Histograms of maximum ISTOF values for 1000 runs of each test model. The y-axis values are in traffic units. ..................................................................................... 248 Figure 106-Histograms of maximum stress time values for 1000 runs of each test model. The y-axis values are in time units. ................................................................................ 250 Figure 107- The intersection of several periodic ATSs is a discrete unbounded ATS... 251 Figure 108- Histograms of the generation numbers when a stable maximum fitness plateau is reached in 1000 runs of each test model......................................................... 252 Figure 109-Histograms of maximum ISTOF values for 1000 runs of each test model. The y-axis values are in traffic units. ..................................................................................... 256 Figure 110- Histograms of maximum stress time values for 1000 runs of each test model. The y-axis values are in time units ................................................................................. 260 Figure 111- Histograms of the generation numbers when a stable maximum fitness plateau is reached in 1000 runs of each test model......................................................... 263 Figure 112- Impact of variations in maximum search time on the GA’s behavior and outputs............................................................................................................................. 265 Figure 113-A typical architecture of SCADA systems................................................... 271 Figure 114- Modified SCAPS Use-Case Diagram including a Timer actor................... 278 Figure 115- SCAPS network deployment diagram. ....................................................... 279 Figure 116-SCAPS partial class diagram. ...................................................................... 280 Figure 117- SDs OM_ON and OM_QC (Overload Monitoring). ................................... 282 Figure 118-SD queryONData(dataType). ...................................................................... 283 Figure 119-SD queryQCData(dataType). ...................................................................... 283 Figure 120- SD OC (Overload Control). ........................................................................ 285 Figure 121-SD DSPS_ON and DSPS_QC (Detection of Separated Power System)...... 285 Figure 122-SD PRNF (Power Restoration after Network Failure)................................. 286 Figure 123-SCAPS Modified Interaction Overview Diagram (MIOD). ........................ 290 Figure 124-A screenshot of the main screen of SCAPS. ................................................ 293 Figure 125-Overview of SCAPS Stress Test Architecture. ............................................ 295 Figure 126- SCAPS Network Interconnectivity Graph (NIG). ...................................... 298 Figure 127-CCFG(OM_ON). ......................................................................................... 299 Figure 128-CCFG(OM_QC)........................................................................................... 300 Figure 129-CCFG(OC). .................................................................................................. 300 Figure 130-CCFG(DSPS_ON). ...................................................................................... 301 Figure 131-CCFG(DSPS_QC). ...................................................................................... 301 Figure 132-CCFG(PRNF)............................................................................................... 301 Figure 133-CCFP and DCCFP sets of SDs in SCAPS. .................................................. 302 Figure 134-(a):Independent-SDs Graph (ISDG) corresponding to the MIOD of Figure 123. (b), (c) and (d): Three of the maximal-complete subgraphs of the ISDG (shown with dashed edges), yielding three ISDSs............................................................................... 304
xvii Figure 135-A grammar to derive CSDFPs from SCAPS’ MIOD................................... 305 Figure 136-Some of the CSDFPs of SCAPS derived from the grammar in Figure 135. 306 Figure 137- Input File containing SCAPS Test Model for a GASTT Test Objective.... 310 Figure 138-Relationship between ATSs of SCAPS SDs and their execution durations, d(sd_name), to each other in 50 time units. .................................................................... 311 Figure 139--Relationship between ATSs of SCAPS SDs and their execution durations, d(sd_name), to each other in 200 time units. .................................................................. 313 Figure 140-Histograms of 100 GARUS Outputs for a SCAPS Test Objective.............. 314 Figure 141- Probability of the event that at least one test requirement with an ISTOF value in groupA is yielded in a series of n runs of GARUS for SCAPS. ........................ 316 Figure 142-Five Different Test Requirements (TR) generated by GARUS for a SCAPS Test Objective. ................................................................................................................ 317 Figure 143-Part of CCFG(OC), annotated with probabilities of paths after decision nodes. ......................................................................................................................................... 320 Figure 144-Execution time distributions of test suites corresponding to SRT constraint SRTC1 by running operational profile test (OPT) and stress test cases from GASTT (ST). ......................................................................................................................................... 323 Figure 145-Overview activity diagram of the Model-Based Resource Usage Analysis (MBRUA) technique....................................................................................................... 327 Figure 146-Modeling CPU usage example..................................................................... 331 Figure 147-Memory usage analysis example. ................................................................ 334 Figure 148-Four SDs with distributed messages. ........................................................... 337 Figure 149-Heuristics for the application of the barrier scheduling heuristic in the context of UML-based stress testing. .......................................................................................... 341 Figure 150-GA chromosome terminology...................................................................... 359 Figure 151-Illustration of crossover operator (single point crossover). ......................... 360 Figure 152-Illustration of mutation operator. ................................................................. 360 Figure 153-Activity diagram of the most general form of genetic algorithms (concept from [87])........................................................................................................................ 361 Figure 154-Formalization of bounded APs time properties. .......................................... 363 Figure 155-Two overlapping ATIs. ................................................................................ 364
xviii List of Equations Equation 1- Distributed Traffic Usage (DTU) functions for different types of messages. ......................................................................................................................................... 108 Equation 2-Node-network membership function............................................................ 112 Equation 3-Network-network membership function. ..................................................... 112 Equation 4-A function to calculate the shares of a network in data transmissions between two nodes. ....................................................................................................................... 123 Equation 5-A function to calculate the data transmissions delay of network between a source node and a network (or a destination node)......................................................... 126 Equation 6-Intersection of two ATSs. ............................................................................ 157 Equation 7-A formula to calculate the maximum ATP (maxATP) of an irregular AP... 179 Equation 8-A formula to calculate the Unbounded Range Starting Point (URSP) of a bounded AP, given the ATIs of the AP. ......................................................................... 180 Equation 9-A formula to calculate the Unbounded Range Starting Point (URSP) of a bounded AP, given the minimum and maximum inter-arrival times (minIAT and maxIAT) of the AP. ........................................................................................................................ 180 Equation 10- Instant Stress Test Objective Function (ISTOF)....................................... 183 Equation 11- Function returning the earliest arrival time of a SD based on its arrival pattern. ............................................................................................................................ 195 Equation 12-RUD and RUM for CPU resource. ............................................................ 332 Equation 13-RUD and RUM for memory resource........................................................ 335
xix List of Acronyms AD
Activity Diagram
AOCS
Attitude and Orbit Control System
AP
Arrival Pattern
APC
Arrival-Pattern Constraint
ATI
Accepted Time Interval
ATP
Accepted Time Point
ATS
Accepted Time Set
BCET
Best-Case Execution Time
BLOB
Binary Large OBject
BNF
Backus-Nauer Form
CCFG
Concurrent Control Flow Graph
CCFP
Concurrent Control Flow Path
CCFPS
Concurrent Control Flow Path Sequence
CFA
Control Flow Analysis
CFG
Control Flow Graph
CFM
Control Flow Model
CFP
Control Flow Path
CPU
Central Processing Unit
CSDFP
Concurrent SD Flow Paths
DBMS
DataBase Management System
DCCFP
Distributed Concurrent Control Flow Path
DCCFPS
Distributed Concurrent Control Flow Path Sequence
DCS
Distributed control system
DRTS
Distributed Real-Time Systems
DT
Data Traffic
DUF
Distributed Unavailability Fault
ECC
Error Correcting Codes
GARUS
GA-based test Requirement tool for distribUted Systems
GASTT
Genetic Algorithm-based Stress Test Technique
GRM
General Resource Modeling
HMI
Human-Machine Interface
HRT
Hard Real-Time
IDE
Integrated Development Environment
xx IOD
Interaction Overview Diagram
IVSDS
Invalid SD Schedule
IPMCS
Industrial Process Measurement and Control System
ISDS
Independent-SD Sets
ISTOF
Instant Stress Test Objective Function
LAN
Local Area Network
MIOD
Modified Interaction Overview Diagram
MT
Message Traffic
NDD
Network Deployment Diagram
NIG
Network Interconnectivity Graph
NRI
Network Resources Index
OCL
Object Constraint Language
OMG
Object Management Group
OO
Object-Oriented
OPTC
Operation Profile-based Test Case
OPTR
Operation Profile-based Test Requirement
OSI
Open Systems Interconnection
PDF
Probability Distribution Function
PLC
Programmable Logic Controller
PRI
Performance Requirements Index
PSTN
Public Switched Telephone Network
RAD
Rapid Application Development
RandTMGen
Random Test Model Generator
RT
Real-Time
RTCOST
Real-Time Constraint-Oriented Stress Test
SCADA
Supervisory Control and Data Acquisition
SCAPS
A SCADA-based Power System
SD
Sequence Diagram
SDNUM
SD-Network Usage Matrix
SHR
Synchronized Hyperedge Replacement
SPE
Software Performance Engineering
SRT
Soft Real-Time
STPE
Stress-Test Performance Engineering
SUT
System Under Test
xxi TC
Te1e-Control unit
TM
Test Model
TSSTT
Time-Shifting Stress Test Technique
UC
Use Case
UCM
Use-Case Map
UML
Unified Modeling Language
UML-SPT
UML profile for Schedulability, Performance, and Time
VSDS
Valid SD Schedule
WAN
Wide Area Network
WCET
Worst-Case Execution Time
WNSTT
Wait-Notify Stress Test Technique
1
Chapter 1
INTRODUCTION
1.1 Motivation and Goal Distributed Real-Time Systems (DRTS for short) are becoming more important to our everyday life. Examples include command and control systems, aircraft aviation systems, robotics, and nuclear power plant systems [1]. However as described in the literature, the development and testing of a DRTS is difficult and takes more time than the development and testing of a distributed system without real-time constraints or a non-distributed system, one which runs on a single computer. System testing has been the topic of a myriad of research in the last two decades or so. Most testing approaches target system functionality rather than performance. However, Weyuker and Vokolos point out in [2], that a working system more often encounters problems with performance degradation as opposed to system crashes or incorrect system responses. In other words, not enough emphasis is generally placed on performance testing. In hard real-time systems, where stringent deadlines must be met, this poses a serious problem. Because hard real-time systems are often safety critical systems,
2 performance failures are intolerable. Deadlines that are not adhered to can in some applications lead to life-threatening risks. The risk of this occurring can be greatly reduced if enough performance testing is done before deploying the system. Performance degradation and consequent system failures due to this degradation usually arise in stressed conditions. For example, stressed conditions can be attained in a DRTS when many users are concurrently accessing a system or when large amounts of data are transferring through a network link. In a recent paper by Kuhn [3], sources of failures in the United States’ Public Switched Telephone Network (PSTN), as a very big DRTS, were investigated. It was reported that in the time period of 1992-1994, although only 6% of the outages were overloads, they led to 44% of the PSTN’s service downtime in the respected time frame. In the system under study, overload was defined as the situation in which service demand exceeds the designed system capacity. So it is evident that although overload situations do not happen frequently, the failure consequences they result into are quite expensive. Furthermore, in the context of Distributed Control Systems (DCS) (e.g., [4]) and Supervisory Control And Data Acquisition (SCADA) systems (e.g., [5]), reports such as [6], [7], [8], [9] indicate the high risk of failures due to network overload. The motivation for our work can be stated as follows: because DRTS are by nature concurrent and are often real-time, there is a need for methodologies and tools for stress testing and debugging DRTS under stressing conditions, such as heavy user loads and intense network traffic. The systems should be tested under stress before being deployed in the field. In this work, our focus for stress testing is on the network traffic in DRTS, one of the fundamental factors affecting the behavior of DTRS. Distributed nodes of a
3 DTRS regularly need to communicate with each other to perform some of the system’s functionalities. Network communications are, however, not always successful and timely. Problems such as congestion, transmission errors, or delays might occur in a network. On the other hand, many real-time and safety-critical systems have hard deadlines for many of their operations, where catastrophic consequences may result from missing deadlines. Furthermore, a system might behave well with normal network traffic loads (in terms of either amount of data or number of requests), but the communication might turn to be poor and unreliable if many network messages or high loads of data are concurrently transmitted over a particular network or towards a particular node. 1.2 Approach We propose a technique to derive test requirements to stress the robustness of a system to network traffic problems in a cost-effective manner. It is based on models, rather than code, describing, among other things, interactions between distributed objects. This is a difficult problem as, for a given DRTS where several concurrent processes are running on each distributed node and processes communicate frequently with each other, the size of the set of all possible network interaction interleavings is unbounded, where a network interaction interleaving is a possible sequence of network interactions among a subset of all processes running on a subset of all nodes. The Unified Modeling Language (UML) [10] is increasingly used in the development of DRTS systems. Since 1997, UML has become the de facto standard for modeling objectoriented software and is used, in one way or another, by nearly 70 percent of IT industry [11]. The new version of UML, version 2.0 [10], was finalized by the OMG in August 2003. UML 2.0 offers an improved modeling language compared to UML 1.x versions:
4 enhanced architecture modeling, improved extensibility, support for component-based development, modeling of relationships and model management [11]. As we expect UML to be increasingly used for DTRS, it is therefore important to develop automatable UML model-driven, stress test techniques and this is the main motivation for the work reported here. Assuming that the UML design model of a DTRS is in the form of Sequence Diagrams (SD) annotated with timing information, and the systems’ network topology is given in a specific modeling format, we propose a technique to derive test requirement to stress the DTRS with respect to network traffic in a way that will likely reveal robustness problems. We introduce a systematic technique to automatically generate a network interaction interleaving that will stress the network traffic on a network or a node in a System Under Test (SUT) so as to analyze the system under strenuous but valid conditions, e.g., triggering the Withdraw sequence diagram before (or together with) the Login in an ATM system is invalid. If any network traffic-related failure is observed, designers will be able to apply any necessary fixes to increase robustness before system delivery. 1.3 Contributions The contributions of this work can be summarized as follows: •
An extended faults taxonomy for DRTS (Chapter 3)
•
A control flow analysis technique based on UML 2.0 SDs (Chapter 6)
•
A resource usage analysis technique for network traffic usage in DRTS (Chapter 8)
5 •
A family of automated stress testing techniques (Chapter 9) aiming at increasing chances of discovering faults related to network traffic in DTRS. Based on a specific UML 2.0 system model, and analysis of the control flow in SDs, it yields stress test requirements composed of specific CFPs (Control Flow Paths) to be invoked and a schedule according to which to trigger each CFP. In addition to sequence diagrams. Two different approaches are discussed for the identification and scheduling of CFPs: the first one is based on a heuristic (Chapter 9); the second one, more general, re-expresses the objectives as an optimization problem and solves it with a Genetic Algorithm (Chapter 10).
1.4 Structure The remainder of this document is structured as follows. Relevant background information is given in Chapter 2, where we discuss the related works and define the main terminology used throughout the document. Chapter 3 presents an extended fault taxonomy for DRTS so that the types of faults we target are well defined. Chapter 4 presents an overview of the stress test methodology. The assumed input system models for the methodology are precisely described in Chapter 5. From Chapter 6 to Chapter 8, we describe in detail how a stress test model is built to support automation. Chapter 6 describes a technique for the control flow analysis of UML 2.0 sequence diagrams. Chapter 7 discusses how sequential and conditional constraints among sequence diagrams (or their corresponding use cases) can be analyzed when generating stress test requirements. A resource usage analysis technique for network traffic usage is then presented in Chapter 8. Chapter 9 proposes the simpler version of our stress test technique which should be applicable for a large proportion of DTRS. A more
6 sophisticated version of the technique, which takes into account complex arrival patterns for internal and external system events, is presented in Chapter 10. This technique reexpresses our objectives as an optimization problem and uses Genetic Algorithms to derive test requirements. Chapter 11 discusses how the stress test methodology can be fully automated using a prototype tool we have developed to generate stress test requirements. This tool is carefully assessed by an experiment. A comprehensive case study is presented in Chapter 12 in order to assess the usefulness of our overall methodology on a realistic example. Chapter 13 discusses how our stress test methodology can be generalized to target other types of faults than the one targeted in Chapter 9 and Chapter 10, or other types of resources (e.g. CPU or memory) instead of network traffic. Finally, Chapter 14 concludes this document and discusses some of the future research directions.
7
Chapter 2
BACKGROUND
This section presents related works (Section 2.1), a detailed problem statement (Section 2.2), the basic terminology used in this thesis (Section 2.3), and a brief introduction to the UML profile for Schedulability, Performance, and Time (UML-SPT) [12] (Section 2.4). As UML 2.0 sequence diagrams are used as the main behavior model, an overview on SDs is presented in Section 2.5. 2.1 Related Works There has not been a great deal of work published on systematic generation of stress test suites for software systems. The works in [13-17] are notable exceptions. On a different note, there are reports that highlight the high cost of system outages and damages due to high loads and systems’ malfunction under stressing conditions. For example, Kuhn [3] investigated the sources of failures in the United States’ Public Switched Telephone Network (PSTN)─a very large distributed system. It was reported that in the time period of 1992-1994, although only 6% of the outages were overloads, they led to 44% of the PSTN’s service downtimes in the studied time frame.
8 Authors in [15] propose a class of load test case generation algorithms for telecommunication systems which can be modeled by Markov chains. The black-box techniques proposed are based on system operational profiles. The Markov chain that represents a system’s behavior is first built. The operational profile of the software is then used to calculate the probabilities of the transitions in the Markov chain. The steady-state probability solution of the Markov chain is then used to guide the generation process of test cases according to a number of criteria, in order to target specific types of faults. For instance, using probabilities in the Markov chain, it is possible to ensure that a transition in the chain is involved many times in a test case so as to target the degradation of performance due to large numbers of calls/requests that can be accepted by the system. From a practical standpoint, targeting only systems whose behavior can be modeled by Markov chains can be considered a limitation of this work. Furthermore, using only operational profiles to test a system may not lead to stressing situations. Yang proposed a technique [13] to identify potentially load sensitive code regions to generate load test cases. The technique targets memory-related faults (e.g., incorrect memory allocation/de-allocation, incorrect dynamic memory usage) through load testing. The approach is to first identify statements in the module under test that are load sensitive, i.e., they involve the use of malloc() and free() statements (in C) and pointers referencing allocated memory. Then, data flow analysis is used to find all Definition-Use (DU)-pairs that trigger the load sensitive statements. Test cases are then built to execute paths for the DU-pairs. Briand et al. [16] propose a methodology for the derivation of test cases that aims at maximizing the chances of deadline misses within a system. They show that task
9 deadlines may be missed even though the associated tasks have been identified as schedulable through appropriate schedulability analysis. The authors note that although it is argued that schedulability analysis simulates the worst-case scenario of task executions, this is not always the case because of the assumptions made by schedulability theory. The authors develop a methodology that helps identify performance scenarios that can lead to performance failures in a system. It combines the use of external aperiodic events (ones that are part of the interface of the software system under test, i.e., triggered by events from users, other software systems or sensors) and internally generated system events (events triggered by external events and hidden to the outside of the software system) with a Genetic Algorithm. Zhang et al. [14] describe a procedure, similar to ours, for automating stress test case generation in multimedia systems. The authors consider a multimedia system consisting of a group of servers and clients connected through a network as a SUT. Stringent timing constraints as well as synchronization constraints are present during the transmission of information from servers to clients and vice versa. The authors identify test cases that can lead to the saturation of one kind of resource, namely CPU usage of a node in the distributed multimedia system. The authors first model the flow and concurrency control of multimedia systems using Petri-nets [18] coupled with temporal constraints. Allen’s interval temporal logic [19] was used by the authors to model temporal relationships. For example, given two media objects, VideoA and VideoB, the representation: αVideoB =
βVideoA + 4 (where αVideoB and βVideoA denote the begin time of VideoB and end time of VideoA respectively) is used to express the starting of VideoB four time units after the end of VideoA. In their model, Zhang and Cheung first identify a reachability graph of the
10 Petri net representing the control flow of multimedia systems. This graph is quite similar to a finite state machine where the states are referred to as markings and the transitions correspond to the transitions in the Petri-net. Each marking on the reachability graph is composed of a tuple representing all the places on the Petri-net along with the number of tokens held in each. It is important to note that only reachable markings (that is ones that can be reached by an execution of the Petri-net) are included in the reachability graph. From there, the authors identify test coverage of their graph as a set of sequences that cover all the reachable markings. These sequences, or paths in the reachability graph, are referred to as firing sequences. Firing sequences are composed of a transition and a firing time, represented as a variable. From there, each sequence is formulated into a linear programming problem and solved, outputting the actual firing times that maximize resource utilization. The proposed technique can not be easily generalized to generate test cases for different stress testing strategies of a distributed system. Some of the limitations of their technique are: •
They assume constant resource utilization (called as weight by the authors) for each media object. While in most DRTS, the resource usage of each object (system component) varies with time.
•
Only instant stress testing (happening in one time instant) is supported. But a system may only exhibit failures if stress test is prolonged for a period of time.
•
The temporal relationships and control flow model of the system should be modeled using Petri-nets [18] and Allen’s interval temporal logic [19]. Although these two notations have solid mathematical foundations, they are not widely used
11 by software developers. It would be much better if the required temporal relationships and control flow information could be extracted from the UML model of a system. •
The proposed technique can not be easily generalized to generate test cases for different stress testing strategies, i.e., testing networks vs. nodes, stress direction (i.e., towards a node vs. from a node). This will be discussed in detail in our system model and methodology sections.
Several techniques have been proposed to find concurrent faults, such as [20-23] which aim at finding data-race related faults. For example, Ben-Asher et al. [21] propose a set of heuristics to increase the probability of manifesting data-race related faults. The goal is to increase the chance of exercising data-races in the program under test and thus increase the chance of manifesting concurrency faults that are data-race related. The proposed technique first orders global shared variables according to the number of times they are accessed by different processes. Then data-race based heuristics are used to change the runtime interleaving of threads so that the probability of fault manifestation increases. One of the proposed heuristics in [21] is called barrier scheduling, in which barriers are installed before and after accessing a particular shared variable. A barrier causes the processes accessing the variable to wait just before accessing it. When a predefined number of processes are waiting, the heuristic then simultaneously resumes all the waiting processes to access the shared variable, for example using notifyAll() in Java. The existing techniques to find concurrent faults do not distinguish between local or distributed concurrent processes. However since a set of concurrent processes can run on
12 distributed locations, the existing methods to find concurrency faults can also be potentially used in a distributed system, which is implicitly concurrent as well. 2.2 Problem Statement (Initial) We first define the problem we tackle in a general way, without providing details on the modeling and formalisms which will be proposed later on in this thesis. Assuming that the UML design model of a DRTS is given, the problem is to find a systematic technique which automatically generates a set of test requirements to stress the network traffic of the system nodes and network links such that the probability of exhibiting network traffic-related faults increases. The UML design model of the SUT is assumed to include at least the system’s sequence diagrams (annotated with start and end timing information of each message), class diagram(s) and a system network interconnectivity package diagram which will be introduced in Section 5.5 and shows the interconnectivity of the system’s nodes and network links. There can be several concurrent processes running on each system node where processes communicate with other processes located on the other nodes. The above problem statement will be revisited in Section 9.1, where it will be detailed and rephrased using the modeling and formalisms proposed in Chapter 5 to Chapter 7. 2.3 Terminology Here we define the basic terminology used throughout this paper. Performance Testing. Performance testing is defined as the testing activity which is conducted to evaluate the compliance of a system or component with specified
13 performance requirements. By thorough performance testing, it is expected that the risks of performance failures in systems are reduced. If performance is defined in terms of response time, software systems must produce results within acceptable time intervals. For example, most users of desktop systems will be annoyed with response times longer than a few seconds. In hard real-time systems, the deadlines to accept and respond to an input are measured in small time units such as milliseconds [24]. In all of these applications, the inability to meet response time requirements is no less a bug than incorrect outputs or a system crash. Stress Testing. Stress testing is defined as the testing process by which a software system is put under heavy stress and demanding conditions in an attempt to increase the probability of exhibiting failures. A stress test pushes the SUT to its design limits and tries to cause failures under extreme but valid conditions. This kind of testing will reveal two kinds of faults: lack of fail-safe behavior and load-sensitive bugs. The stress test suites may increase the number of simultaneous actions and cause resources to be used in unexpected way. This may reveal faults on rare conditions, in exception handlers, and in restart/recovery features of a software system [24]. Distributed system: A collection of autonomous, geographically-dispersed computing nodes (hardware or software) connected by some communication medium: one or more networks. Distributed node: A geographically-dispersed computing node, which is a part of a distributed system and is part of a network.
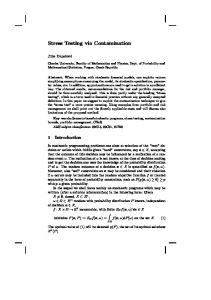
14 Network: A network is the communication backbone for a set of nodes in a distributed system. A network may be a subnet of another network or the supernet of several other networks. 2.4 UML Profile for Schedulability, Performance, and Time The UML standard has been used in a large number of time-critical and resource-critical distributed systems [25-29]. Based on this experience, a consensus has emerged that, while a useful tool, UML is lacking some modeling notations in key areas that are of particular concern to distributed system designers and developers. In particular, it was noticed that the lack of a quantifiable notion of time and resources was an obstacle to its broader use in the distributed and embedded domain. To further standardize the use of UML in modeling complex distributed systems, the OMG (Object Management Group) adopted a new UML profile named “UML Profile for Schedulability, Performance and Time” (SPT) [12] (referred to as the UML-SPT). The UML-SPT profile proposes a framework for modeling real-time systems using UML. The profile was finalized on Sept. 2003 and is becoming popular in the research community [30-34] and the industry [35]. The profile provides a uniform framework, based on the notion of quality of service (QoS), for attaching quantitative information to UML models. Specifically, QoS information models, either directly or indirectly, the physical properties of the hardware and software environments of the application represented by the model. This framework is referred to as the General Resource Modeling framework (GRM) by the UML-SPT profile. The structure of the GRM framework is shown in Figure 1 [12].
15
General Resource Modeling Framework
«sub-profile» RTresourceModeling
«import»
«import»
«sub-profile» RTconcurrencyModeling
«sub-profile» RTtimeModeling
Figure 1-The structure of the GRM Framework of the UML-SPT profile [12]. According to the UML-SPT profile’s specification [12], sub-profiles are defined as profile packages dedicated to specific aspects and modeling analysis techniques. As shown in Figure 1, the RTtimeModeling sub-profile imports the RTresourceModeling sub-profile since time can be considered as a resource in a system. The RTtimeModeling sub-profile provides means for representing time and time-related mechanisms that are appropriate for modeling real-time software systems. It is composed of several packages that introduce the following separate but related groups of concepts: •
Concepts for modeling time and time values, included in the TimeModel package.
•
Concepts for modeling events in time and time-related stimuli, included in the TimedEvents package.
•
Concepts for modeling timing mechanisms (clocks, timers), included in the TimingMechanisms package.
•
Concepts for modeling timing services, such as those found in real-time operating systems, included in the TimingServices package.
As we will see in the faults taxonomy related to time constraints in distributed systems (Section 3.1.1), we will mostly use the concepts for modeling events in time and time-
16 related stimuli in the context of this work. Those concepts are included in the TimedEvents package of the RTtimeModeling sub-profile. The modeling of the TimedEvents package is shown in Section 4.1.3 of the UML-SPT profile [12]. As an example, part of the deployment architecture of a typical chemical reactor system is shown in Figure 2, where a sensor controller node (nsc) is supposed to get the sensor data from sensors ns1 and ns2, and then send the data to be updated in the control server (ncs).
ns1:HeatSensor
nsc :SensorController
ncs : ControlServer
nrm:ReactorMonitoring
ns2:HeatSensor Reactor Expert
`
Reactor
LAN
Figure 2-Part of the deployment architecture of a chemical reactor system. The sequence diagram (SD) in Figure 3 shows the realization of the data update process. The SD is using time modeling constructs in the TimeModel package of the UML-SPT profile and the UML 2.0 [10] notations. The timing information of messages has been modeled using the UML-SPT. For example, «RTstimulius» denotes that the first message is
a
RT
stimulus
«RTArrivalPattern».
with
an
arrival
pattern
specified
by
the
tagged-value
17 «RTstimulus» {RTArrivalPattern= "'periodic',(100,'ms')" RTduration0]
InteractionOccurrence
N
ref
InteractionOperand separator
N InteractionOperand
[else] ref
P CombinedFragment
Figure 5-An example illustrating the new features of the UML 2.0 SDs. UML also provides four varieties (or sorts as UML 2.0 calls them) for a message. Message sorts identify the sort of communication reflected by a message. The sorts of messages supported are defined in an enumeration called MessageSort (in Figure 328 of [10]) as:
SynchCall: synchronous call
AsynchCall: asynchronous call
SynchSignal: synchronous signal
AsynchSignal: asynchronous signal
20
Chapter 3
AN EXTENDED FAULT TAXONOMY FOR DISTRIBUTED REAL-TIME SYSTEMS
Before devising any type of testing technique, one needs to clearly specify the target set of fault types. Since the scope of our testing technique is distributed real-time systems, we present in this chapter a fault taxonomy for such systems, which is an extension to the fault taxonomy presented in [38]. Section 3.1 presents our fault classification for DRTS. Section 3.2 discusses the chain of distribution faults, i.e., how a specific fault may recursively lead to other faults (possibly of other types than the initial fault). Finally, the classes of faults considered in this work, a sub-set of what is described in Section 3.1, are described in Section 3.3. This will clarify the objectives of the stress testing methodology we present in Chapter 9 and Chapter 10.
21 3.1 An Extended Fault Classification for Distributed Real-Time Systems To operate successfully, most large distributed systems depend on software, hardware, and human operators and maintainers to function correctly. Failure of any one of these elements can disrupt or bring down an entire system. According to the terminology used in system dependability, a system may fail either because it does not comply with the specification, or because the specification did not adequately describe its function [38]. Three fundamental categories of threats exist in the dependability theory presented in [38]: failures, errors, and faults. A system failure occurs when the delivered service deviates from fulfilling the system function. An error is the part of the system state that may cause a subsequent failure. A fault is the adjudged or hypothesized cause of an error. A fault is active when it produces an error; otherwise it is dormant. Failures, errors, and faults are closely related. The chained causality relationship between these threats is shown by Avizienis et al. [38], as depicted in Figure 6.
...
activation Fault
propagation Error
causation Failure
Fault
...
Figure 6-The fundamental chain of dependability threats. The arrows in this chain express a causality relationship between faults, errors and failures. From the users viewpoint, a malfunction in a system is observed via a failure, which itself has been caused by an error and that by a fault. Therefore in terms of system granularity, failures are in a higher level than errors and those are in a higher level than faults. For example in a typical web-based email system such as Yahoo, which most
22 probably uses parallel/distributed web servers to serve huge number of clients at the same time, a typical failure from a user standpoint might be: “Yahoo! mail doesn’t let me log in”. This failure might be due to an error such as: “the user database can not be reached” in the system, which in turn, might be caused by a distributed fault like: “congestion in a database server’s request queue has resulted in an unavailability of the server”. Adapting the concept of dependability to our context, i.e., distributed systems, it makes sense to account for specific faults which occur specially in distributed systems and thus extend the taxonomy introduced in [38]. Our proposed additions are presented in Figure 7, where the faults classes on the gray background are our proposed additions, while those on a white background were discussed by Avizienis et al. in [38]. We have added five top-most categories: distribution, time criticality, concurrency, resource-usage orientation, and location of creation or occurrence. By this extension, we believe that the fault taxonomy can be used in the context of DRTSs. The technique proposed in this thesis aims to target transient faults (in term of persistency) since stressing conditions are by nature transient. Thus, we first revisit the persistency of faults in Section 3.1.1. In terms of the other fault categories described in [38] (domain, intent, boundary, cause and phase), the objective of our technique is not specific to a specific category (e.g., internal or external for the faults boundary). Thus, we do not discuss those fault categories in detail here. Sections 3.1.2 to 3.1.6 discuss our five extended categories: distribution, time criticality, concurrency, resource-usage orientation, and location of creation or occurrence.
23
Persistency
Permanent By Avizienis et al.
Transient Domain
Software Phenomenological Cause
Faults
System Boundary
Proposed in the current work
Hardware
A
Testing focus of the current work
Natural Human-made Internal External
Phase of Creation or Occurrence
Intent
Developmental Operational Accidental Deliberate
Distribution
Local Distributed
Time Criticality
Real-Time Non Real-Time
Concurrency
Malicious Non-Malicious
Concurrent
Unavailability Traffic
Amount of Data Number of Requests
Soft Real-Time Hard Real-Time
Non Concurrent Resource-Usage Orientation Location of Creation or Occurrence
Resource-usage orientated Non Resource-usage orientated
Overload Usage Unavailability
Network Node
Figure 7-Tree of Generalized Fault Classes for Distributed Systems. 3.1.1 Persistency of Faults Some studies have suggested that since software is not a physical entity and hence not subject to transient physical phenomena (as opposed to hardware), software faults are permanent in nature [39]. Some other studies classify software faults as either permanent or transient [38]. Permanent faults are essentially design faults which can be identified quite easily and can be removed during the testing and debugging phase (or early deployment phase) of the software life cycle. Transient faults, on the other hand, belong to the class of temporary internal faults and are intermittent. They are essentially faults
24 whose conditions of activation occur rarely or are not easily reproducible. Hence these faults result in transient failures, i.e., failures which may not recur if the software is restarted or is run in normal load conditions. Some typical situations in which transient faults might surface are high usage loads, improper or insufficient exception handling and interdependent timing of various events. It is for this reason that transient faults are difficult to identify through regular testing techniques. Hence a mature piece of software in the operational phase, released after its development and testing stage, is more likely to experience failures caused by transient faults than due to permanent faults. Some studies on failure data have reported that a large proportion of software failures are transient in nature [40, 41], caused by phenomena such as overloads or timing and exception errors [42, 43]. For example, a study of failure data from a fault tolerant system, called Tandem, indicated that 70% of the failures were transient failures, caused by faults like race conditions and timing problems [44]. Altogether, depending on the system under study, we might be able to list some of the situations in which transient faults might happen: •
Overloads
•
Race conditions on shared resources
•
Interdependent timing of various events
•
Improper or insufficient error handling
•
Memory leaks
25 3.1.2 Distribution Since nodes are geographically distributed in a distributed system, there should be a communication medium connecting them. We can thus classify faults based on their distribution aspect. We identify faults pertaining to communication among nodes under the class of distributed faults. The contrary category is called local faults. An important point to mention here is that since both the SUT and the test system run in the application layer of the OSI (Open Systems Interconnection)’s 7-layer network architecture [45], we only consider faults which are of relevance to the application layer and not the lower OSI layers, such as bit transmissions errors which are handled and corrected by the Error Correcting Codes (ECC) in the data link layer. In the context of testing distributed systems, we identify two types of faults with a distributed nature: •
Distributed unavailability faults
•
Distributed traffic faults
We discuss each of the above fault categories in the following sections. 3.1.2.1 Distributed Unavailability Faults Distributed unavailability faults relate to the availability (readiness for correct service) and reliability (continuity of correct service) attributes of a system. The specification of most distributed systems usually dictates that the system’s network links and nodes should be highly available and reliable. For example, in a safety-critical system like a distributed air traffic control, the flight and runway information should be updated frequently in the system’s central database. Failing to do so, which might be caused for
26 example by a network unavailability fault between a radar and the controller, might result in disastrous consequences. A distributed unavailability fault happens when a system component is no longer available and can not provide services to other components in the system. This equally applies to networks and nodes. For example, a distributed message from a source node may not reach the destination node because one of the network links in the path from the source to the destination node is exhibiting a distributed unavailability fault. Since there are essentially three parties (network, the source and the destination nodes) in every communication, therefore in our definition, this fault might happen in either a network or in a node, which can be described using the “Location of Creation or Occurrence” fault class, as shown in Figure 7. This justifies why Unavailability, an orthogonal concept to “Location of creation or Occurrence”, is sub-type of type Distributed. Network links between any two distributed nodes might become unavailable at any time during the system activity. As we will assume in the system model in Chapter 5, any arbitrary network link in the network path between any two nodes in the system might be unavailable while the other links are functioning well. Therefore, all different types and combinations (e.g., the sender node, any of the network links, or the receiver node of a message) of unavailability faults have to be accounted for if we want to test all possibilities of unavailability in a system. The reason why we would like to distinguish the unavailability fault in terms of its location of creation or occurrence is that the system’s overall behavior might be different when a network link, the source or the destination nodes exhibit unavailability faults. A schematic notation of possible
27 distributed unavailability faults in a simple distributed message scenario is shown in Figure 8. Network
SD DUF1
DUF2
DUF3
n1
o2 {node=n2}
o1 {node=n1}
n2
o2.f() DUF3
DUF1
DUF2
v1=o2.f() DUF
Denotes the occurrence of a distributed unavailability fault
Figure 8-Occurrences of Distributed Unavailability Faults (DUF). In the simple distributed message scenario of Figure 8, object o1 on node n1 invokes a remote procedure call f() from object o2 on node n2 and subsequently receives the return value. A distributed unavailability fault (DUF) might happen anywhere in this scenario. We have identified three of all possible DUFs as shown with DUFi’s in Figure 8. Suppose DUF1 happens on the network connecting two nodes and just after the message o2.f() is sent from o1 to o2. DUF2 occurs in n2 (e.g. node n2 crashes) after message o2.f() has arrived in o2 and while o2 (node n2) is busy processing function f(). DUF3 is a DUF which takes place in n1 before receiving the reply message (v1=o2.f()). The time and location where a DUF happens might cause different failures and subsequent faults in a system. Therefore to achieve full coverage in terms of DUFs, all different times and locations of DUFs have to be tested in a system. Distributed unavailability faults might happen due to a variety of reasons, such as: physical damage to a network cable, dead node, dead router/switch/hub in the network path, and network or application software malfunction.
28 3.1.2.2 Distributed Traffic Faults A distributed traffic fault occurs when at least one of the system components does not function correctly under heavy network traffic, but remains available. Distributed traffic faults can be due, for instance, to network congestions, buffer overflows, or processing delay in software modules. This, again, also equally applies to networks and nodes. A detailed discussion of the root causes for distributed traffic faults is outside the scope of this document since such discussions will be mostly related to computer and communication networks literature. However, among the main causes, we consider two cases: large amounts of data transmitted by networks, and high number of requests handled by nodes. There have been many studies in the area of network traffic and researchers have used many analytical models. One of the most common models to represent traffic in networks is to use queuing theory [46]. Those group of works build mathematical models (such as Markov chains) to analyze a network’s behavior under stressed conditions. Most of such techniques work in the lower layers of the OSI architecture and do not analyze stressed conditions from the application layer (software) point of view. Thus, a detailed discussion of those group of works is outside the scope of this document as they are mostly in the field of computer and communication networks. The interested reader is referred to the extensive literature in these areas. As an example of a scenario when a distributed traffic fault might happen, consider the network schematic shown in Figure 9. Let us suppose the nodes in NetworkA (n1, n2, n3) send messages to nodes in NetworkB (n4, n5, n6) simultaneously, where each message contains a large amount of data. All of these messages have to go through NetworkAB
29 which connects NetworkA and NetworkB. If the total size of the simultaneous data sent over NetworkAB is larger than its capacity, there will probably be a delay or other network faults that can be referred to “distributed traffic faults”. This fault may cause an error and subsequently a failure in the system, which in turn might lead to other classes of faults according to the fundamental chain of dependability threats shown in Figure 6. Distributed database and multimedia servers are examples of systems where large amounts of data are usually exchanged between nodes and distributed traffic faults might occur. NetworkAB
n1
NetworkB 3,6,t
2,5,t
1,4,t
NetworkA
n2
n3
n4
i,j,t
n5
n6
Denotes a message from node ni to node nj at time t
Figure 9-An example scenario showing how a distributed traffic fault might happen. As discussed previously, in addition to the amount of data transmitted over a network or from/to a node, we further acknowledge that high number of simultaneous messages might also be a potential cause of traffic faults. Considering the example scenario in Figure 9, assume each of the concurrent processes on the nodes n1, n2, and n3 (inside NetworkA) send messages to processes on nodes n4, n5, and n6 (inside NetworkB) all at the same time. Since there can be large number of concurrent processes on each node, there might be scenarios where high number of distributed messages go over the network
30 NetworkAB. This, subsequently, might cause a distributed traffic fault in the network and/or any of the nodes. 3.1.3 Time Criticality In the context of DRTSs, faults can also be categorized based on their real-time (time criticality) aspect. A real-time fault occurs when a real-time deadline is missed. As discussed earlier, safety-critical systems often have time constraints which they should react on time. As usually categorized in the literature, real-time deadlines (constraints) are of two types: hard and soft deadlines. Hard deadlines are constraints that absolutely must be met [47]. A missed hard deadline results in a system failure. A system with hard deadlines is called a hard real-time system. On the other hand, soft real-time systems are characterized by time constraints (soft deadlines) which can (a) be missed occasionally, (b) be missed by small time derivations, or (c) occasionally skipped altogether. Usually, these permissible variations are stochastically characterized. Another common definition for soft real-time systems is that they are constrained only by average time constraints. Examples include on-line databases and flight reservation systems. Therefore, in soft real-time systems, late data may still be good data, depending on some measure of the severity of the lateness. 3.1.4 Concurrency A concurrency fault occurs if the root cause of a system failure is due to the concurrency among processes. There might be, for example, a shared resource that is accessed by several processes in a system. The synchronization scheme and order in which a shared
31 resource is accessed might lead to a concurrency fault. Some types of concurrency faults are: deadlock, livelock, starvation and data-races. A deadlock is a situation where two or more processes cannot proceed because they are all waiting for the other to release some shared resource. Livelock happens when processes are blocked with reasons other than waiting for a shared resource, for example a busy waiting on a condition that can never become true [48]. Resource starvation is a more subtle form of a deadlock state. A process may have large resource requirements and may be overlooked repeatedly because it is easier for the resource management system to schedule other processes with smaller resource requirements [48]. Data-race is an anomaly of concurrent accesses by two or more threads to a shared variable when at least one is writing. Programs which contain data-races usually demonstrate unexpected and even non-deterministic behavior. The outcome might depend on specific execution order (a.k.a. threads’ interleaving). Rerunning the program may not always produce the same results. Thus, programs with data-races are hard to test and debug. 3.1.5 Resource-Usage Orientation Resource-usage orientated (resource, in short) faults relate to usage of resources (e.g. network bandwidth, CPU, or memory) in a system. We identify two types of resource faults : (1) overload usage of a resource, and (2) unavailability of a resource. An overload resource fault might happen if the amount of usage from a resource exceeds its limits (capacity). For example, several processes may try to allocate more memory space than it is available in a system. Resource unavailability faults relate to the availability (readiness for correct service) and reliability (continuity of correct service)
32 attributes of resources. Note that there is an overlap in the concept between resource unavailability and distributed unavailability faults. The focus of the former is on resource aspect of faults, while the later deals with distribution aspect of faults in a DRTS. Distributed unavailability faults can be considered as a special type of resource unavailability faults if networks and nodes (distributed components of a DRTS) are considered as resources. 3.1.6 Location of Creation or Occurrence We propose this new classification for faults in DRTS to specify location of creation or occurrence. We consider two possibilities for the location of a fault: network or node. Considering a distributed system to be a set of networks and nodes, a fault might occur in any of the nodes or networks. 3.2 Chain of Distribution Faults As shown in the fundamental chain of dependability threats in Figure 6, a fault with a specific type may recursively lead to other faults with different types. For example, a distributed fault such as data traffic fault might lead to a real-time fault, where a process might miss its assigned deadline to perform a particular task. This chained causality can be rephrased as: when a process does not receive the data it was waiting for, on time (by a specific deadline), it is not able to perform its action on time. Therefore, when studying the root cause of faults in a system, it is important to order the faults according to the order they occur and cause the next one in the faults chain: the data traffic fault is the first fault in the chain and the real-time one is the second in the above example.
33 3.3 Class of Faults Considered in this Work The dark boxes in Figure 7 depict the classes of faults targeted by the stress testing methodology described in this document: In other words, our methodology targets traffic-related faults of distributed nature, which can occur on either nodes or networks in a DRTS. Such a traffic-related fault is supposed to be related with network bandwidth as resource type. The following can be an example of such a fault: congestion in a database server’s request queue. To investigate if our test methodology can be generalized to target other types of faults, we will need to discuss its details first through the next several chapters. We will discuss in Chapter 13 how our methodology can be either tailored to target other types of resources (e.g. CPU or memory) instead of network bandwidth, or generalized to target other types of faults.
34
Chapter 4
OVERVIEW OF THE STRESS TEST METHODOLOGY
In this chapter, we present in one view the different pieces of information and steps/activities of our entire approach, and at the same time indicating in which coming chapter more details are provided. We also describe succinctly the purpose of each part of the input model and the purpose of each intermediate representation. Note the although some input (and intermediate) models (in our approach) are not standard UML diagrams, we propose them to stay in the UML world, thus facilitating tool support. Section 4.1 presents the overview of our model-based stress test methodology. An overview of the input (and intermediate) models used in our stress test methodology is discussed in Section 4.2. 4.1 Stress Test Methodology The overview of our model-based stress test methodology is shown using an Activity Diagram (AD) in Figure 10. Note that the steps after test requirements generation, i.e., deriving test cases and executing them, are not addressed by this thesis. However, we discuss those steps for the specific case of our case study. A UML model of a SUT, following specific but realistic requirements, is used in input. A test model (TM) is then
35 built to facilitate subsequent automation steps. The TM and a set of stress test parameters (objectives) set by the user are then used by an optimization algorithm to derive stress test requirements. Test requirements can finally be used to specify test cases to stress test a SUT. The TM consists of three sub-models: a control flow analysis model (Chapter 6), inter-SD constraints (Chapter 7) and network traffic usage pattern (Chapter 8).
Design UML Model (Section 5)
Time-Shifting Stress Test Technique (Chapter 9)
Test Model Generator
Sequence Diagrams (SD)
Modeler
Class Diagrams (CD)
Test Model (TM)
Context Diagrams
Network Interconnectivity Tree (Section 5.5)
Network Deployment Diagram (NDD)
Control Flow Model (CFM) (Chapter 6)
Modified Interaction Overview Diagrams (MIOD)
INPUT
Inter-SD Constraints (Chapter 7)
None of SUT SDs have arrival pattern constraints At least one of SUT SDs has arrival pattern constraints Genetic Algorithm-based Stress Test Technique (Chapter 10)
Distributed Traffic Usage Patterns (Chapter 8) Discussed in this work
Stress Test Parameters
Stress Test Requirements OUTPUT Tester Stress Test Parameters
Test Oracles
Test Cases (TC)
SUT
Test Driver
Figure 10- Overview of our model-based stress test methodology (a UML activity diagram). As we will discuss in Section 5.3, triggering SDs may not be allowed in any time instant. These types of constraints are called arrival-patterns. If none of a SUT’s SDs has arrivalpattern constraints, we use a simple optimization algorithm (Chapter 9) to derive stress test requirements from a TM. Otherwise, if at least one of SDs has arrival pattern constraints, we show in Chapter 10 that a more sophisticated optimization algorithm is needed and present one based on Genetic Algorithms.
36 Test requirements are the outputs of our technique, which can be used by a tester to derive test cases. A test driver can be utilized to feed the derived test cases to the SUT, monitor its behavior, check the output with test oracles and generate test verdicts. 4.2 Input and Intermediate Models in our Stress Test Methodology An overview of the input and intermediate test models in our stress test methodology is shown by their respective high level metamodels in Figure 11. The metamodels are grouped into two packages: input system design models, and test models, which are described next. 4.2.1 Input System Design Models The design UML model of a SUT should consist of the following diagrams which are described extensively in Chapter 5. •
Sequence diagrams (SD): SDs model the behavior of a SUT. To enable our stress test methodology to derive stress test requirements (as schedules to trigger SDs), we also require the messages in SDs to be annotated with timing information (e.g., Figure 3).
•
Class diagrams (CD): CD of a SUT will be used to estimate the data size of messages in SDs. This will enable our stress test methodology to derive stress test requirements with maximum possible network traffic.
•
Network Deployment Diagram (NDD): A NDD is an extended diagram to UML 2.0 deployment diagrams will models the network topology of a SUT, and will let
37 our stress test methodology to derive localized stress test requirements (i.e., on a specific node or network). «metamodel» Input System Design Models
Activity Diagram
UML 2.0 Diagram
Package Diagram
Class Diagram
Sequence Diagram 1
Modified Interaction Overview Diagram
Network Deployment Diagram 1
1
Context Diagram 1
1
1 SUT Design Model 1 1
«metamodel» Test Models
«metamodel» Network Interconnectivity Tree
Network Interconnectivity Tree
«metamodel» Control Flow Analysis
Concurrent Control Flow Graph
1
«metamodel» Inter-SD Constraints
Independent-SD Sets
Concurrent SD Flow Paths
Concurrent Control Flow Paths Sequence
1 «metamodel» 1 Resource Usage Analysis
Network Traffic Usage
Figure 11- Metamodel of input and intermediate test models in our stress test methodology. •
Context Diagram [49]: Context diagrams are an extension to class diagrams and will provide the number of multiple invocations of a SD, relevant in the context of DRTSs.
38 •
Modified Interaction Overview Diagram (MIOD): A MIOD models the sequential and conditional constraints among SDs. This will enable modelers to specify the valid sequences of SDs in a SUT, and our stress test methodology to derive stress test requirements complying with such constraints.
SDs and CDs are standard UML diagrams, while NDDs, Context diagrams and MIODs are not standard diagrams, but they extend standard UML diagrams as explained in detail in Chapter 5. 4.2.2 Test Models The Test Model (TM) package consists of four sub-packages: (1) control flow analysis model, (2) network traffic usage model, (3) network interconnectivity tree and (4) interSD constraints, which are described in the next subsections. 4.2.2.1 Control Flow Analysis In UML 2.0 [10], SDs may have various program-like constructs such as conditions (using alt combined fragment operator), loops (using loop operator), and procedure calls (using interaction occurrence construct). As a result, a SD is composed of Control Flow Paths (CFP), defined as a sequence of messages in a SD. Furthermore, as we discussed in [50], asynchronous messages and parallel combined fragments entail concurrency inside SDs. In a SD of a DS, some messages are local (sent from an object to another on the same node), while others are distributed (sent from an object on one node to an object on another node). Furthermore, different CFPs can have different sequences of messages and each message can have different signatures and a different set of parameters. Therefore,
39 the network traffic usage pattern of each CFP can be different from other CFPs. Thus, comprehensive model-based stress testing should take into account the different CFPs of a SD. As we will discuss in Chapter 6, synchronous and asynchronous messages should be handled differently in the control flow analysis of a SD. We will propose a CFM (Control Flow Model) for SDs, referred to as CCFG (Concurrent Control Flow Graph). OCL consistency-rules will be used to define the mapping between a SD and its equivalent CCFG (Concurrent Control Flow Graph). CCFGs will support asynchronous messages and concurrency in SD. Similar to the concept of Control Flow Paths (CFP), we will propose Concurrent Control Flow Paths (CCFP), which can be derived from a CCFG. To consider distributed messages, between two objects on two different nodes, in a SD, Distributed Concurrent Control Flow Paths (DCCFP) will be defined. The process to build a CFM will be discussed in Chapter 6. 4.2.2.2 Resource Usage Analysis We define the resource usage analysis metamodel to enable resource usage analysis of messages in SDs. We only consider network traffic resource usage in this work. Quantifying network traffic usage is done by measuring the amount of traffic entailed by a message and assigning the value to the flow node (in CCFP) corresponding to a message. Therefore, the resource usage analysis is done at the message-level in this work. We consider four abstract classes for network traffic usage: type, duration, direction, and location. These classes will be discussed in further detail in Chapter 8. A technique to formally analyze network traffic usage of a system based on a given UML model will be
40 proposed in Chapter 8. The resource model will be formalized in a way to facilitate the stress testing of network traffic in a SUT. 4.2.2.3 Network Interconnectivity Graph A Network Interconnectivity Graph (NIG) is an internal data structure derived from a NDD using the technique presented in Section 5.5.2. As we discuss in Chapter 9, it facilitates tree-based manipulations on a SUT’s topology, such as extracting the network path between two nodes. 4.2.2.4 Inter-SD Constraints These constraints are derived from a Modified Interaction Overview Diagram (MIOD), which models constraints among SDs of a SUT. We will propose in Chapter 7 four concepts to analyze such constraints in our methodology. •
Independent-SD Sets (ISDS): An ISDS is a set of SDs that can be executed concurrently, i.e. there are no sequential constraints between any two of the SDs in the set to prevent it.
•
Concurrent SD Flow Paths (CSDFP): A CSDFP is a sequence of SDs from a start to an end node of a MIOD. In other words, a CSDFP is a sequence of SDs that are allowed to be executed in a system (according to the constraints modeled in a MIOD).
•
Concurrent Control Flow Paths Sequence (CCFPS): A CCFPS is derived from a CSDFP by substituting each SD by one of its CFPs.
41
Chapter 5
INPUT SYSTEM MODEL
In this work, stress test input data is assumed to be the UML 2.0 [10] design model of a SUT. As discussed in Chapter 1, UML has become the de-facto standard for modeling object-oriented software for nearly 70 percent of IT industry since 1997 [11]. The new version, UML 2.0 [10], proposed by the OMG in August 2003, offers an improved modeling language. As we expect UML to be increasingly used for DRTS, it is therefore important to develop automatable UML model-driven, stress test techniques. We describe in this chapter the modeling information required. The rationale for using the following five modeling diagrams by the methodology are described next: •
Two standard UML 2.0 diagrams: sequence diagrams (Section 5.1), and class diagrams (Section 5.1.1.3)
•
A modified UML 2.0 diagram: modified interaction overview diagram (Section 5.3) - our specific diagram used in our test methodology
•
A context diagram [49] (Section 5.4)
42 •
A specialized UML 2.0 package structure, referred to as Network Deployment Diagram (NDD) (Section 5.5)
Furthermore, two tagged-values (specialized from the UML-SPT tagged-values) for modeling hard and soft Real-Time constraints in UML behavior diagrams are described in Section 5.6. 5.1 Sequence Diagram The goal in this work is to systematically stress test a SUT and we need to find some particular test requirements, based on the behavior of the SUT, to feed into the SUT. Therefore the dynamic behavior of the SUT should be analyzed to derive such test requirements. According to the UML 2.0 specification [10], seven UML diagrams can be used to specify the behavior of a system. As shown in Appendix A of [10], they are Activity, Sequence, Collaboration (or called Communication in Section 14 of [10]), Interaction Overview, Timing, Use case and State machine diagrams. Among all those diagrams, only sequence and communication diagrams provide message-level details of a program, which are needed for the Control Flow Analysis (CFA) needed for stress testing. Furthermore, among the last two, SDs have been more popular than communication diagrams in modeling dynamic behavior of systems, as they provide a richer set of behavior modeling constructs (e.g. loops and conditions). SDs have been accepted as essential UML artifacts for modeling the behavioral aspects of systems [51]. They show interacting objects as well as the control flow of those interactions (e.g., if-then conditions, repetitions) [52]. These diagrams are particularly well-suited for object-oriented software as it is now well recognized that the complexity
43 of object-oriented software lies in objects interactions much more than in individual operations. Moreover, SDs have been the basis for several approaches for testing objectoriented software [24, 51, 53, 54], although not in a distributed or real-time context. These are the reasons why we choose SDs as the source of information for dynamic behavior of a SUT. Because SDs can specify varying flows of control (e.g., thanks to conditional constructs), network-traffic stress conditions may happen in only subsets of those SD control flows. Thus, we need to analyze control flow in SDs to derive network-aware stress test requirements. We have presented a control flow analysis technique based on SDs in [50], which we will use in this work. An overview of this technique will be given in Chapter 6. Since each of the participating objects of a SD may be deployed on a different node, we need to model this information in SDs. We use a node tagged value to specify this information, as illustrated in Figure 12: objects o1, o2, and o3 are deployed on three different nodes in the network, n1, n2, and n3, respectively.. sd M o1 {node = n1}
o2 {node = n2}
o3 {node = n3}
m1 m2
Figure 12-Modeling the deployment node of an object using node tagged value.
44 5.1.1 Timing Information of Messages in SDs As mentioned in Chapter 1, real-time systems often have real-time constraints that have to be met at runtime or real-time faults will occur. In Chapter 3, we also mentioned that that a fault can trigger other subsequent faults as well. For instance, a network traffic fault might trigger a real-time fault. Therefore, our overall heuristic in this work is to schedule the SD’s of a SUT such that all possible distributed messages with maximum data sizes on a particular network link or a node happen at the same time. As we will see in the next sections, this will maximize the chance of exhibiting network traffic faults and consequently any other faults dependent on them. In order to devise precise test requirements (from time point of view) that yield such a stress test scenario of network traffic in a SUT, our stress test methodology requires that the timing information of messages in SDs is available and as precise as possible. The more precise the timing information of messages, the more precise (and thus potentially more stressing) the test requirements will be to stress test a SUT. By timing information of a message, we basically mean the start and end times of a message. As discussed in Section 3.1.3, messages in a typical DRTS might have hard or soft real-time constraints. There might be also messages that do not possess any real-time constraints. In terms of timing information, there can be two types of messages which are discussed next: (1) messages with predictable timing (to a degree of uncertainty), and (2) messages with unpredictable timing information.
45 5.1.1.1 Estimating Execution Times Three of the approaches used in the literature to estimate timing information of messages in DRTSs are: -
Static analysis and manual estimations (such as [55])
-
Runtime monitoring (such as [56])
-
Benchmarks (such as [49])
With manual estimations, different schedulability analysis techniques are used and the program code is analyzed by hand. The possible execution paths which lead to extreme execution times are then derived. Static analysis methods are limited when the test object contains program control structures such as loops. In this case, loop bounds must be specified manually or can only be estimated. This process is resource-consuming, errorprone, and is not scalable. Furthermore, the BCET (Best-Case Execution Time) can be too optimistic and the WCET (Worst-Case Execution Time) too pessimistic due to manual estimations. Another common approach for estimating timing information is runtime monitoring techniques (such as [56]), which can be utilized to get a statistical overview of the time length of such messages at runtime prior to the testing phase. Statistical distributions of start and end times of such messages can be derived by running the system before testing and their expected values can then be used by the stress test technique in this paper. However, due to the statistical (and hence indeterministic) nature of the timing values, such timing information might not lead to precise stress scenarios. We assume that a time
46 measurement technique has been used for the messages in the SUT and that such information is already available. Estimating timing information may also be possible in late design stages by using, for example, heuristics similar to the ones used in the COMET (Concurrent Object Modeling and Architectural Design with UML) [49] object-oriented life cycle, where Gomaa proposed a heuristic to estimate time durations of messages based on benchmarks defined on previously-developed similar messages. Such an approach can be adapted to the estimation of number and types of local variables of a method by comparing the functionality/role of a method at hand with benchmarks of previously-developed methods’ local variables (in the same target programming language). It should be acknowledged that this is in general a complex task which would require extensive experience and skills. Such information should then be provided by modelers in an appropriate way, for example by using specific tagged-values. 5.1.1.2 Uncertainty of Timing Information Regardless of the type of technique used by engineers to estimate timing information, uncertainty (impreciseness) in timing information is inevitable. Different models have been used in the literature to model time uncertainty (e.g., [57, 58]). The core part of such models which incorporates uncertainty of time are similar. The work in [58] formalizes such a concept as follows. Uncertainty in execution time of a task t is taken care of by letting its execution time ET be a random variable characterized by a probability mass function (PMF) PET. PET is defined over K+1 points, denoted by etk, k∈0…K. By definition, a) the values etk are
47 assumed to be in the ascending order with increasing k, but with the restriction that etk,≤WCET of task t, b) et0 = 0 and PET (ET = et0) = 0, and c) PET(ET = etk)≠0 for k∈1…K. Assumptions (b) and (c) are intended to produce a minimal set of mass values in the initial specification of uncertainties, while excluding zero as a possible execution time. For example, the probabilistic representation of a task execution requirement is depicted in Figure 13. The sequence of execution times and their probabilities are derived by applying schedulability analysis techniques, and are referred to as Timed Sequence of Probabilities (TSP) [58]. As it is shown, the task’s execution time is assumed to be 2, 3 and 6 units of time with the probabilities of 0.3, 0.6, and 0.1, respectively. 0.7 0.6
0.6
probability
0.5 0.4 0.3
0.3 0.2
0.1
0.1 0 0
1
2
3
4
5
6
7
execution time
Figure 13- Probabilistic representation of uncertainty in a task’s execution times. To further investigate the impact of uncertainty in timing information on our quantitative stress test methodology (Chapter 9), we need to present the methodology itself first. Thus, such this topic will be revisited in Section 10.9.
48 5.1.1.3 Messages with Unpredictable Execution Times After using different schedulability analysis techniques to estimate execution times of messages in a SUT, there might still be messages whose execution times are unpredictable: no WCET/BCET can be found for them. Examples of such messages are those with data-intensive parameters whose data sizes can not be estimated early enough. Estimating the execution times of such messages will lead to great amounts of uncertainty in such time values, which might lead to great deals of indeterminism in our stress test methodology and the output test requirements it will generate. Thus, we will present in Section 10.10 a different version of our stress test methodology, referred to as Wait-Notify Stress Test Technique (WNSTT), which will in specific target systems with at least one message with unpredictable execution time. 5.2 Class Diagram The class diagram is at the heart of the object modeling process. The class diagram models the resources used to build and operate the system. It models each resource in terms of its structure, relationships and behavior [11]. The stress testing technique in this document will use the class diagram(s) of a system for the following two purposes: •
To achieve full coverage criteria for polymorphism in control flow analysis of SDs, as explained in Section 5 of [50, 59], and
•
To estimate the data size of a distributed message in a SD (either a call or a reply message), as explained in Section 8.1.1.
No specific constraints is imposed on the use of the UML 2.0 class diagram notation.
49 5.3 Modified Interaction Overview Diagrams Executing any arbitrary sequence of use cases (UCs) (i.e., their corresponding SDs) in a SUT might not be always valid or possible. Business logic of a SUT might enforce a set of constraints on the sequence (order) of SDs, requiring that certain conditions be satisfied before a particular SD can execute. Different types of SD constraints can be considered: •
Sequential constraints [60] define a set of valid SD sequences: e.g., the Login SD of an ATM system should be executed before the Withdrawal SD.
•
Conditional constraints are related to sequential constraints and indicate the condition(s) that have to be satisfied before a sequence of SDs can be executed. For example, the Login SD should be executed “successfully” before the Withdrawal, Transfer and Deposit SDs, or the RenewLoan SD of a library system can be invoked up to “two times” for an instance of a loan.
•
Arrival-pattern constraints relate to timing of SDs. The time instant when a SD can start running might be constrained in a system. Each SD might be allowed to execute only in some particular time instants. For example in a replicated distributed database server system, where the data on the main server is mirrored (copied) to the replicated servers, the policy may be to run the Mirror SD every hour and not on every transaction (maybe since the SD deals with enormous amounts of data). Another scenario in which a SD can have an arrival-pattern constraint is when the SD is triggered by an event and the event is periodic.
50 Accounting for those constraints when deriving stress test requirements is paramount if one wants to obtain valid stressing executions. If no constraint or only sequential and conditional constraints apply to SDs, we have developed a simple heuristic approach for stress test requirement generation (Chapter 9). If arrival-pattern constraints exist, a more complicated approach, based on a Genetic Algorithm is proposed in Chapter 10. This is illustrated in Figure 14. Constraint types considers
Time-Shifting Stress Test Technique (Section 9)
considers
Sequential
Conditional
Arrival-pattern
considers
considers
Genetic Algorithm-based Stress Test Technique (Section 10)
considers
Figure 14-The approach in which the different SD constraint types are considered by the two optimization algorithms in this work. In order to analyze and take the above three types of constraints into account when conducting any type of testing on a SUT, the constraints should be modeled. Arrival patterns apply to each SD, and hence are not inter-SD constraints. Arrival patterns can be modeled using the RTArrivalPattern tagged-value of the UML-SPT profile, as explained in Section 2.4. Refer to the SD in Figure 3 for an example. Sequential and conditional constraints are between SDs. Therefore, we refer to them as inter-SD constraints. In the following, we first discuss existing techniques and representations to model and formalize inter-SD constraints (Section 5.3.1) and we then choose the one which suits best our context (Section 5.3.2).
51 5.3.1 Existing Representations to Model Inter-SD Constraints In this section, we present a brief review of the existing representations to model SD constraints, in both UML and non-UML contexts. We briefly discuss some of them and focus on the ones in the context of UML. Before UML became a standard, an OO-development method called Fusion [61] proposed the notion of life-cycle model which bears some similarity in concepts to what we call SD sequential constraints. Such constraints are the direct result of the logic of the business process the system purports to support. Such processes could be specified by life-cycle models. Use-Case Maps (UCMs) [62] are also one of the notations which bears some similarities to UML activity diagrams. The UCM notation aims to link behavior and structure in an explicit and visual way. UCM paths are architectural entities that describe causal relationships between responsibilities which are bound to underlying organizational structure of components. UCM paths represent scenarios that intend to bridge the gap between requirements (use cases) and detailed design [62]. Allen’s interval temporal logic [19] is also one of the models proposed for modeling temporal constraints among a group of objects. This temporal logic was used by Zhang and Cheung in [14] to model the temporal constraints among objects in multimedia presentations. Having modeled these temporal constraints, the authors presented a technique to stress test the CPU load of a multimedia system using linear programming optimization technique.
52 Petri-nets [18] can also be used to model sequential constraints among SDs. For example, Zhang and Cheung [14] model the flow and concurrency control of multimedia objects using Petri-nets. The advantage of Petri-nets is that it a well-founded formal notation that has been widely used for the modeling of dynamic behavior. User
Loan
Item
Add User
Title
Library
Add Title
Monitor System
Add Item
Remove Item
Remove Title
Borrow Loan Copy
Collect Fine
Renew Loan
Return Loan Copy
Remove User
Figure 15- Use Case Sequential Constraints for the Librarian actor (adopted from [60]). In the context of UML and SDs, there have also been techniques and representations to model and formalize constraints among SD, [60] and [63] for instance. When modeling the behavior of a system, a SD is usually modeled to realize a particular UML UC. Briand and Labiche [60] report that when planning test cases for UCs, all possible execution sequences for UCs have to be identified. In order to do that, they represent the sequential dependencies of UCs as an activity diagram in which vertices are UCs and
53 edges are sequential dependencies between UCs. An edge between two UCs (from a tail UC to a head UC) specifies that the tail UC must be executed in order for the head UC to be executed, but the tail UC may be executed without any execution of the head UC. In addition, specific situations require that several UCs be executed independently (without any sequential dependencies between them) for another UC to be executed, or after the execution of this other UC. This is modeled by join and fork synchronization bars in the activity diagram, respectively. The authors illustrated the technique on a library system: Figure 15 shows the UC sequential constraints for the Librarian actor (parameters of the UCs such as a title_id for AddTitle are not shown for clarity). Nebut et al. [63] propose a contract language for functional requirements expressed as parameterized use cases. They also provide a method, a formal model and a prototype tool to automatically derive both functional and robustness test cases from the parameterized use cases enhanced with contracts. In this technique, pre- and postconditions (i.e., logical expressions) are attached as UML notes to each use case in the use case diagram. The sequential constraints among SDs can then be deduced from the set of contracts: e.g., if the postcondition of use case A implies the precondition of use case B then sequence A-B is legal. The OMG introduced a new UML diagram in UML 2.0, namely Interaction Overview Diagram (IOD) (Section 14.4 of [10]). IODs “define interactions through a variant of activity diagrams in a way that promotes overview of the control flow” [10]. IODs are specializations of Activity Diagrams (AD) where object nodes are either Interactions or InteractionOccurrences. Recall that following the UML 2.0 terminology, a sequence diagram is an Interaction and referring to an existing sequence diagram is an
54 InteractionOccurrence. In other words, an IOD is used to show how flows of executions of sequence diagrams. IODs are similar to the activity diagram notation suggested in [60] for use case sequential constraints, except that in an IOD, the designer can use powerful Activity Diagram notations such as conditions and loops. As an example, the IOD of an ATM system is depicted in Figure 16. The IOD is composed of interaction occurrences which refer to specific SDs (Insert Card, Login, Display Menu, etc.). The flow of control between interaction occurrences is modeled using AD flows. The control can take on different paths as modeled by decision nodes. For example, if only login is successful, the interaction occurrence Display Menu is invoked.
ref Insert Card
ref Login
ref
[num_retries=3]
[choice==Logout]
Hold Card
[login unsuccessful && num_retriesincludes(flow:ControlFlow| 5 getCCFG(interFrag).node->exits(an:ActivityNode| 6 an.inFlow->includes(Utility::Util.getFirstMessage 7 (interFrag).sendEvent) and flow.target=an 8 ) 9 ) 10 ) 11 )
The CCFG of each interaction fragment is checked to have an initial node (lines 1-2) with specific characteristics. There should be a control flow from the initial node to the activity node having the sendEvent of the first message of the interaction fragment in its inflow (lines 4-7). To reduce the complexity of our consistency rules, we have defined several utility functions inside a utility class Util, such as getCCFG() and getFirstMessage(), as they are used in the above rule. getCCFG() returns the CCFG::Activity instance associated with an instance of SD::InteractionFragment. getFirstMessage() returns the first message of a given interaction fragment according to the ordering provided by its GeneralOrdering. GeneralOrdering is the SDs mechanism to order messages. More details are provided in [59]. Example Figure 31-(a) shows part of the CCFG instance that satisfies the above consistency rule based on Figure 27. The corresponding part of the resulting CCFG is represented in Figure 31-(b). Executable node enA corresponds to the message A (getAsynchProcessor)
81 in Figure 27. enAse is the sendEvent MessageEnd of the message A. enAse is already in the inflow of node enA because of the rule #3. Furthermore, getFirstMessage(ccfg) returns message A, and in this way, the appropriate control flow connection between the ccfg‘s initial node and node enA is checked to exist. ccfg:Activity
A:SD::Message message
1
1 in:InitialNode
in:InitialNode
enA:ExecutableNode target
source outgoing
ccfg=getCCFG(AsynchronousRequestProcessing)
flow:ControlFlow
enA.sendEvent incoming
enAse:SD::MessageEnd
flow:ControlFlow
enA:ExecutableNode inflow
enA.message=A
(a)
(b)
Figure 31-(a)-Part of the CCFG instance ccfg mapped from the SD in Figure 27, satisfying the consistency rule #2. (b)-Part of the CCFG, corresponding to the instance shown in (a). 6.1.4.2 SynchCall/SynchSignalÆCallNode This rule maps synchronous (call or signal) messages of a SD to call nodes of a CCFG. (These messages are identified thanks to enumeration values synchCall and synchSignal of message attribute messageSort.) OCL Mapping
1 SD::Message.allInstances->forAll(m:Message| 2 (m.messageSort=SD::MessageSort.synchCall) or 3 (m.messageSort=SD::MessageSort.synchSignal) 4 implies 5 CCFG::CallNode.allInstances->exits(cn:CallNode| 6 cn.message=m and
82 -- check object partition 7
cn.inPartition= Utility::Util.getObjectPartition( m.receiveEvent.covered.connectable_element_name) and -- make sure cn is prepared for control flow (edge) connections -- m.SendEvent/m.ReceiveEvent should be in inFlow/outFlow of cn
8 9 10 11 12 )
cn.inFlow->includes(m.sendEvent) and cn.outFlow->includes(m.receiveEvent) and Utility::Util.getCCFG(m.interaction).node->includes(cn) )
The synchCall and synchSignal messages of a SD are selected in lines 1-3. The existence of a corresponding call node c is checked in lines 5-10. The call node cn’s message association value should be m (line 6), its object partition should be lifeline of message m (line 7), and its inflow and outflow sets should include only m’s send and receive events, respectively (lines 8-9). These inflow and outflow information are needed since the control flow consistency rule (#5) will use them to connect nodes to each other to form the control flow. Line 10 makes sure that node cn is a part of the CCFG corresponding to interaction containing message m. getObjectPartition() is another utility function, which returns the object partition instance associated with a lifeline (using consistency rule #6). Example Figure 32-(a) shows part of the CCFG instance corresponding to message A in Figure 27 that satisfies the consistency rule #3. The corresponding part of the resulting CCFG is represented in Figure 32-(b). Call node cn corresponds to message A in Figure 27. Since the receiver lifeline of message A is pf:ProcessorFactory, the inPartition association of cn corresponds to ObjectPartition instance op which is associated with object and class names pf and ProcessorFactory, respectively.
83 “pf”:NamedElement
ccfg:Activity
objectName
1
1 op:ObjectPartition
inPartition
ccfg=getCCFG( AsynchronousRequestProcessing) op:ObjectPartition
cn:CallNode
inFlow
className “ProcessorFactory” :NamedElement
A:SD::Message message
A.sendEvent: SD::MessageEnd
outFlow A.receiveEvent: SD::MessageEnd
A.sendEvent cn:CallNode
cn.message=A
A.receiveEvent
(a)
(b)
Figure 32-(a):Part of the CCFG instance ccfg mapped from the SD in Figure 27, satisfying the consistency rule #3. (b): Part of the CCFG, corresponding to the instance shown in (a). 6.1.5 Concurrent Control Flow Paths The concept of Concurrent Control Flow Paths (CCFPs) is similar to the conventional Control Flow Paths (CFPs), except that they consider concurrent control flows as they are derived from CCFGs [50, 59]. We presented a grammar in [50, 59] to derive all different CCFPs of a CCFG. For example, by using such grammar, some of the CCFPs of the CCFG in Figure 30 can be derived as shown in Figure 33. The symbol ρ will be used in the rest of this article to refer to CCFPs. ⎛ ⎛ ⎛ ⎞⎞ ⎛ JK ⎞ ⎞ ⎜ DE ⎜⎜ ⎟⎟ ⎟ ⎜ DE ⎜⎜ ⎟⎟ ⎟ ρ = ABC 2 ⎜ ⎝ ⎠⎟ ⎝ ⎠⎟ ⎜ FGHI ⎟ ⎜ FGHI ⎟ ⎝ ⎠ ⎝ ⎠ ⎛ ⎛ ⎛ ( JK )3 ⎞ ⎞ ⎛ ( JK )2 ⎞ ⎞ ⎜ ⎜ DE ⎜ ⎜ ⎟⎟ ⎟⎟ ⎟⎟ ⎟ ⎟ ρ 4 = ABC ⎜ DE ⎜ ρ3 = ABC ⎜ ⎜⎝ ⎝ ⎠ ⎠ ⎜ FGHI ⎟ ⎜ FGHI ⎟ ⎝ ⎠ ⎝ ⎠
ρ1 = ABC ⎜
Figure 33-CCFPs of the CCFG in Figure 30.
84 Four CCFPs for the CCFG in Figure 30 are due to the decision node (corresponding to a loop) in the CCFG. According to the grammar of CCFPs (Equation 1 of [50, 59]), a loop can either be bypassed (ε) – if possible, taken only once, a representative or average number, and a maximum number of times. These possibilities have derived the four CCFPs: ρ1, ρ2, ρ3 and ρ4. The loop is bypassed in ρ1, taken once in ρ2, repeated twice in
ρ3, and a maximum number (m) of times in ρ4. Each CCFP is made of several message nodes of a CCFG. Each message node corresponds to a message in the corresponding SD of the CCFG. In the rest of this article, we will refer to CCFP messages and nodes interchangeably. 6.2 Incorporating Distribution and Timing Information in CCFPs The discussions in [50, 59] about CCFPs described generic CCFPs in a sense that they can be used to analyze control flow of SDs with distributed or non-distributed messages. In the current context, we consider SDs with distributed messages and we saw in Section 5.1 that the node on which a SD object is deployed can be modeled using node stereotype. Since only distributed messages of a SD are of interest to our testing technique, therefore we need to incorporate the distribution data of messages inside CCFPs. As the sender/receiver objects and nodes of a message are already modeled in SDs, we can easily access those information from a CCFP, which is a set of messages. Furthermore, as discussed in Section 5.1.1, we assumed that timing information of messages in a SD are modeled using the RTstart and RTend tagged values of the UMLSPT profile [12].We can also easily access such information of each message in a CCFP.
85 Following the above discussion, we can derive all the above information along with message signature and returns list of messages from SDs during the CFA phase. To facilitate our mathematical relations in the next sections, we consider the following format for the call and reply messages of each CCFG and CCFP. 6.3 Formalizing Messages In order to precisely define how we perform traffic analysis of SDs, we formally define SD messages. Similar to the tabular representation of messages, proposed by UML 2.0 [10], each message annotated with timing information (using the UML-SPT profile [12]) can be represented as a tuple: message=(sender, receiver, methodOrSignalName, parameterList, returnList, startTime, endTime, msgType) where •
sender denotes the sender of the message and is itself a tuple in the form sender=(object, class, node), where:
•
o
object is the object (instance) name of the sender.
o
class is the class name of the sender.
o
node is where the sender object is deployed.
receiver denotes the receiver of the message and is itself a tuple in the same form as sender.
•
methodOrSignalName is the name of the method or signal on the message.
•
parameterList is the list of parameters for call messages. parameterList is a sequence in the form parameterList=,
86 where pi is the i-th parameter with class type Ci and in/out determines the kind of parameter pi. For example if the message is m(o1:C1, o2:C2), then the ordered parameters set will be parameterList=. If the method call has no parameter, this set will be empty. •
returnList is the list of return values on reply messages. It is empty in other types of messages. UML 2.0 assumes that there may be several return values by a reply message.
We
show
returnList
in
the
form
of
a
sequence
returnList=, where vali is the return values for variable vari with type Ci. •
startTime is the start time of the message (modeled by UML-SPT profile’s RTstart tagged value).
•
endTime is the end time of the message (modeled by UML-SPT profile’s RTend tagged value).
•
msgType is a field to distinguish between signal, call and reply messages. Although the messageSort attribute2 of each message in the UML metamodel can be used to distinguish signal and call messages, the metamodel does not provide a
2
The messageSort attribute of a message specifies the type of communication reflected
by the message [10] Object Management Group (OMG), "UML 2.0 Superstructure Specification," 2005., and can be any of these values: synchCall (synchronous call), synchSignal (synchronous signal), asynchCall, or asynchSignal
87 built-in way to separate call and reply messages. Further explanations on this and an approach to distinguish between call and reply messages can be found in [50]. 6.4 Distributed CCFP Distributed CCFP is a CCFP where CCFP messages (call or reply) are distributed. A CCFP message is distributed if its sender and receiver are located in two different nodes. Formally, using the definitions of call and reply node from Section 6.2 a CCFP message msg is distributed if: msg.sender.node ≠ msg.receiver.node where msg can be either a call or a reply message. In other words, a distributed CCFP message is one whose corresponding SD message goes to a different receiver node than its sender node. Similarly, Distributed CCFP (DCCFP) is a CCFP that only includes distributed CCFP messages. A DCCFP is built from a given CCFP ρ by removing all local messages and keeping the distributed ones. As an example, let us assume the CCFPs given in Figure 33. In order to derive their DCCFPs, we should first judge each messages as local or distributed. According to the corresponding SD (Figure 27), all the messages except the messages A and B are distributed. Therefore, in the CCFG of Figure 30, only control nodes A and B are local, and the rest are distributed. Hence, the DCCFPs corresponding to the CCFPs given in Figure 33 are shown in Figure 34.
88 ⎛ ⎛ ⎛ ⎞⎞ ⎛ JK ⎞ ⎞ ⎜ DE ⎜⎜ ⎟⎟ ⎟ ⎜ DE ⎜⎜ ⎟⎟ ⎟ DCCFP( ρ1 ) = C ⎜ , DCCFP ρ ( ) = C 2 ⎜ ⎝ ⎠⎟ ⎝ ⎠⎟ ⎜ FGHI ⎟ ⎜ FGHI ⎟ ⎝ ⎠ ⎝ ⎠ ⎛ ⎛ ⎛ ( JK ) 2 ⎞ ⎞ ⎛ ( JK )3 ⎞ ⎞ ⎜ DE ⎜ ⎜ ⎟⎟ ⎜ ⎟⎟ ⎜ ⎟ ⎟ , DCCFP( ρ 4 ) = C ⎜ DE ⎜ ⎟⎟ DCCFP( ρ 3 ) = C ⎜ ⎝ ⎠ ⎝ ⎠ ⎜ FGHI ⎟ ⎜ FGHI ⎟ ⎝ ⎠ ⎝ ⎠
Figure 34- DCCFPs of the CCFPs in Figure 33. 6.5 Timed Inter-Node and Inter-Network Representations of DCCFPs In this section, we provide a timed inter-node (and inter-network) representation of DCCFPs. This representation can help to visualize the behavior of DCCFPs with respect to time over the system nodes and networks. This will help to better understand our discussions in the remainder of this article. UML 2.0 introduces a new interaction diagram called Timing Diagrams (Section 14.4 of [10]). As defined by UML 2.0: “Timing Diagrams are used to show interactions when a primary purpose of the diagram is to reason about time. Timing diagrams focus on conditions changing within and among lifelines along a linear time axis.” We use the basic concepts of UML 2.0 timing diagrams and propose a model for timed inter-node and inter-network representations of DCCFPs. These two representations of a DCCFP can be useful to represent a timeline view of the flow and occurrence of distributed messages by a DCCFP in node and network levels. These representations are 2dimentioanl charts where the X-axis is a linear time axis and the Y-axis is the set of all nodes referenced at least once by the control nodes of a given DCCFP. For example, let us consider the SD of Figure 27 and DCCFP(ρ2) in Figure 34. Timed inter-node representation of DCCFP(ρ2) in shown in Figure 35, where the message ends
89 correspond to the type of corresponding messages (synchronous/asynchronous call or reply) in the SD. Let us also assume that the start and end times of all control nodes (A…K) are given using UML-SPT profile stereotypes (Section 5.1.1) with the values as shown. In this representation, the X-axis represents time and the Y-axis lists the nodes of
n3
H
E
n2
C
D
n1 0
1
2
3
4
5
6
7
8
9
F
I
G
nodes
the DCCFP messages.
10 11 12 13 14 15 16 17 18 19 20
time (x100 ms)
Figure 35-Timed inter-node representation of DCCFP(ρ2) in Figure 34. Suppose the NIG of this system is as the one shown in Figure 36. The inter-network representation of the DCCFP(ρ2) can be derived using the node information in SD, the inter-node representation (Figure 35) and the system NIG. System Network
Network1
n1
...
Network2
n2
...
Network3
n3
...
Figure 36-A simple system NIG. The inter-network representation of the DCCFP(ρ2) is drawn in Figure 37. Start and end networks of each message in this representation are derived by finding the networks where the message’s sender and receiver nodes are members. For example, the sender
90 and receiver nodes of message (call node) C are nodes n1 and n2, which are members of Network1 and Network2, respectively. In addition to the traffic imposed on networks they start and end, messages like C have an implicit traffic on networks that are not their immediate parent in NIG, but are in the network paths from their start to end nodes. For example, C entails an implicit traffic on SystemNetwork in addition to Network1 and Network2. Other cases like this can also be identified from NIG.
implicit traffic
C
F
G
Network3
E
H
I
G
D
F
Network2 C
networks
System Network
Network1 0
1
2
3
4
5
6
7
8
9 10 11 12 13 14 15 16 17 18 19
time (x100 ms)
Figure 37-Timed inter-network representation of a DCCFP.
20
91
Chapter 7
CONSIDERING INTER-SD CONSTRAINTS
As discussed in Section 5.3, executing any arbitrary sequence of use cases (and thus their corresponding SDs) in a SUT might not be always valid or possible. This might be due to the constraints enforced by the business logic of a SUT on the sequence (order) of SDs and also the conditions that have to be satisfied before a particular SD can be executed. Modified Interaction Overview Diagrams (MIOD) were proposed in Section 5.3 to model sequential and conditional inter-SD constraints. We discussed how such constraints can be modeled by a MIOD. As we will discuss in Chapter 9, our stress test technique will identify the most datacentric messages of each SD and will try to either run SDs concurrently or will run a sequence of SDs which impose the maximum amount of network traffic. However, test requirements should comply with the inter-SD constraints. In the following sections, we propose two methods to consider inter-SD constraints in our stress testing context, assuming that a MIOD is given. The method in Section 7.1 will be used to derive the Independent-SD Sets (ISDSs) in a SUT. An ISDS is a set of SDs, in
92 which any two SDs are independent, thus the entire set can be run concurrently. In other words, there are no inter-SD sequential constraints between any two of the SDs in an ISDS to prevent from doing so. Our stress test technique in Chapter 9 will make use of ISDS by calculating the maximum traffic of each ISDS by adding the maximum traffic of its SDs. Then, among all ISDS of a MIOD, the ISDS with maximum traffic will be chosen as the ISDS which entails the maximum stress. Then after, the SDs of the chosen ISDS will be scheduled in a way to maximize the instant traffic in a particular time instant. The method proposed in Section 7.2 will be used to derive the Concurrent SD Flow Paths (CSDFP) and CCFP/DCCFP Sequences (CCFPS/DCCFPS). Similar to the concept of CCFP, a CSDFP is a path from a MIOD’s start node to a final node. The CSDFPs of a MIOD specify the allowed sequences of SDs in a system. According to this definition, any sequence of SD in a SUT which is not a CSDFP is not allowed to be executed. On the other hand, we defined CCFP and DCCFP in Chapter 6 and saw that each SD can have one or more such paths. We define CCFP/DCCFP Sequences (CCFPS/DCCFPS) as the sequences of CCFPs/DCCFPs which are built from a CSDFP. Further explanations are provided in Section 7.2. A variation of our stress test technique in Chapter 9 will make use of CSDFP by calculating the maximum traffic of each CSDFP. Then, among all CSDFPs of a MIOD, the CSDFP with maximum traffic will be chosen as the CSDFP which entails the maximum stress.
93 7.1 Independent-SD Sets An Independent-SD Set (ISDS) is a set of SDs that can be executed concurrently, i.e. there are no sequential constraints between any two of the SDs in the set to prevent it. Assuming that a MIOD is given, we propose a technique in this section to find all ISDSs of the MIOD. As an example, let us consider the MIOD of a library system as shown in Figure 38. This MIOD is the completed version3 of the activity diagram shown in [60]. For brevity, the SDs are labeled by capital letters from A to O. The MIOD is modeled using the use case diagram given in Appendix A of [60] and some typical business logic assumptions of the library system. Borrower User
Librarian
Reservation
Title
User
Loan
Item
E
Title
F
G
Add User A
Add Title
Monitor System
H
B
Search User
Library
Add Item Find Title I
J Remove Item
Borrow Loan Copy C L
Make Reservation
M
Collect Fine
D
K Remove Title
Renew Loan [num_of_renewalssize() = self.isds.sd->size()
1
1* 1..* *
sd sd 1 * dccfp
1
An instance:
-End4 -End3 gene
Gene
Gene -startTime: RTtimeValue
(DCCFP1,2, (1, ‘2ms’))
-End3
(DCCFP2,2, (6, ‘9ms’))
Chromosome
-End4
* DCCFP
Gene
* 0...1
context Gene: inv self.selectedDCCFP.sd=sd
selectedDCCFP (a)
(b)
Figure 70-(a): Metamodel of chromosomes and genes in our GA algorithm. (b): Part of an instance of the metamodel. Each Gene is associated with a SD. Furthermore, it has an association (selectedDCCFP) to zero (if no DCCFP is chosen) or one DCCFP, and has an attribute: startTime, which is the time value to trigger dccfp, and is of type RTtimeValue (defined in the UML-SPT). Each DCCFP belongs to a SD, whereas each SD can have several DCCFPs and has an attribute: numOfMultipleSDInstances, which is the number of multiple SD instances which are allowed to be triggered concurrently (Section 5.4). Furthermore, Each SD can
170 be a member of several ISDSs. Arrival pattern information of SDs is stored in instances of a class ArrivalPattern (attributes of such a class can be easily defined based on the discussions in Section 10.1, such as type and AP parameters), and are accessible by the ap association. Each ISDS can have one or more SDs. Finally, a SUT (model) has one or more ISDSs. Recall that we are optimizing traffic at a given instant and what matters is thus the number of SDs that can be triggered concurrently. We therefore do not need to model sequential and conditional constraints. An example of a chromosome and a gene is illustrated in Figure 70-(b), which complies with the metamodel in Figure 70-(a). The chromosome is composed of two genes, since it is assumed that the SUT has two SDs: SD1 and SD2. DCCFP1,2 and DCCFP2,2 are selected DCCFPs of SD1 and SD2, respectively. The genes indicate that the DCCFPs’ start times are 2 ms and 9 ms, respectively. 10.7.1.2 Length The length of chromosomes, i.e., the number of genes in the chromosomes, is fixed and is equal to the number of SDs in a SUT. This is due to the fact that each gene of a chromosome corresponds to a SD, and we have a fixed number of SDs per SUT. Furthermore, as discussed in Section 10.7.1.1, if no DCCFP is selected from a SD (because the SD does not have traffic over a particular network, for example), the selected gene of a Gene is represented as null (the reasons for have 0..1 multiplicity on the selectedDCCFP association). Therefore, the chromosome length remains the same at all times.
171 10.7.2 Constraints Inter-SD and arrival pattern constraints should be satisfied when generating new chromosomes from parents, otherwise, GA backtracking procedures [87] should be used. Backtracking, however, has its drawbacks: it is deemed expensive because time consuming. Some GA tools incorporate backtracking while others do not. To allow for generality, we assume no backtracking methodology is available. Therefore, we have to ensure that the GA operators always produce chromosomes which satisfy the GA’s constraints. In order to do so, we formally express inter-SD and arrival pattern constraints in the context of our GA. 10.7.2.1 Constraint #1: Inter-SD constraints We incorporated inter-SD constraints in ISDSs (Chapter 7). A set of DCCFPs are allowed to execute concurrently in a SUT only if their corresponding SDs are members of an ISDS. As discussed in Section 10.7.1.1, each chromosome is a sequence of genes, where each gene is associated with zero or one DCCFP. Therefore, a chromosome satisfies Constraint #1 only if the SDs of DCCFPs corresponding to its genes are members of a same ISDS. In other words, each chromosome corresponds to one ISDS. We can formulate the above constraint as a class invariant on class Chromosome (Figure 70-(a)) as presented in Figure 71. context Chromosome inv: self.gene.selectedDCCFP.sd.isds->asSet->size=1
Figure 71- Constraint #1 of the GA (an OCL expression).
172 10.7.2.2 Constraint #2: Arrival pattern constraints Given a chromosome, the OCL function in Figure 72 can be used to determine if the chromosome (the scheduling of its genes) satisfies the Arrival Pattern Constraints (APC) of SDs. The function IsAPCSatisfiedByAChromosome(c :Chromosome) returns true if all genes of the chromosome satisfy the APCs. The OCL function makes use of function IsAPCSatisfied(startTime, AP), defined in Section 10.2. 1 2 3
IsAPCSatisfiedByAChromosome(c:Chromosome) post: result= if c.gene->exits(g| g.selectedDCCFP.notEmpty and not IsAPCSatisfied(g.startTime, g.sd.ap) then
4 5 6 7
false else true endif
Figure 72-Constraint #2 of the GA (an OCL function). 10.7.3 Initial Population Determining the population size of a GA is challenging [85]. A small population size will cause the GA to quickly converge on a local minimum because it insufficiently samples the search space. A large population, on the other hand, causes the GA to run longer in search for an optimal solution. Haupt and Haupt in [87] list a variety of works that suggests adequate population sizes. The authors reveal that the work of De Jong [92] suggests a population size ranging from 50 to 100 chromosomes. Grefenstette et al. [93] recommend a range between 30 and 80, while Schaffer and his colleagues [94] suggest a smaller population size, between 20 and 30.
173 We choose 80 as the population size as it is consistent with most of experimental results. The GA initial population generation process should ensure that the two constraints of Section 10.7.2 are met. The pseudo-code to generate the initial set of chromosomes is presented in Figure 73. As indicated by the constraint #1 (Section 10.7.2.1), each chromosome corresponds to an ISDS. Therefore, line 1 of the pseudocode chooses a random ISDS and the initialization algorithm continues with the selected ISDS to create an initial chromosome. Note that to generate our GA’s initial population, CreateAChromosome() is 80 times. Function CreateAChromosome(): Chromosome c: Chromosome 1
ISDS=a random ISDS in the set of ISDSs // selecting genes (DCCFPs)
2
For all SDi∈ISDS do
3
c. genei.selectedDCCFP= a random DCCFP from SDi
4
c. genei.sd = SDi
5
For all SDi∉ISDS do
6
c. genei=null
7
c. genei.sd = SDi // initial scheduling of genes (DCCFPs)
8
Intersection=ATS(SD1) ∩ ATS(SD2) ∩… ∩ATS(SDi), for all SDi∈ISDS
9
If Intersection≠φ then
10
Choose a random time instant tschedule in Intersection // schedule all genes’ start time to tschedule
11
For all c. genei ≠null c. genei.startTime= tschedule
12 13
Else // Intersection=φ, SDs of ISDS do not have overlapping start times // schedule each gene with a random time in the ATS of its SD
14
For all c. genei ≠null do c. genei.startTime= A random time instant ti in ATS(SDi)
15 16
End If
17
Return c
Figure 73-Pseudo-code to generate a chromosome for the GA’s initial population.
174 For each SD in the ISDS selected in line 1, lines 2-4 choose a random DCCFP and assign it to the corresponding gene (i.e. genei corresponds to SDi). Other genes of the chromosome (those not belonging to the selected ISDS) are set to null (lines 5-7). An initial scheduling is done on genes in lines 8-16. The idea is to schedule the DCCFPs in such a way that the chances that DCCFPs’ schedules overlap are maximized. This is done by first calculating the intersection of ATSs for SDs in the selected ISDS (line 8), using the intersection operator described in Section 10.2. If the intersection set is not null (meaning that the ATSs have at least one overlapping time instant), a random time instant is selected from the intersection set (line 10). All DCCFPs of the genes are then scheduled to this time instant (lines 11-12). If the intersection set is null, it means that the ATSs do not have any overlapping time instant. In such a case, the DCCFP of every gene is scheduled differently, by scheduling it to a random time instant in the ATS corresponding to its SD (lines 14-15). Following the algorithm in Figure 73, we ensure the initial population of chromosomes complies with both constraints of Section 10.7.2. In the case when the intersection of SD ATSs is null, one might wonder whether there are still any possibilities to run SDs concurrently to have maximum stress. The answer to this question is twofold: •
Although the ATS intersection of all SDs in the selected ISDS is null, a subset of SDs might still have a non-null ATS intersection. Triggering these SD concurrently can lead to traffic faults. For example, consider the timing diagram in Figure 74, where the ATS intersection of three SDs (SD1 …SD3) is null. Although there is no single time instant, when the three SDs can be triggered concurrently, a subset of them (SD1 and SD2 ) have a non-empty ATS intersection, which allow them to be triggered
175 concurrently. This situation can be made possible in a chromosome by our mutation operator (Section 10.7.6.2), since as we will discuss, our mutation operator will shift each SD in its ATSs to create a new offspring. •
Another situation when the high stressing messages of a set of SDs with empty ATS intersection might be triggered is when the execution of a SD is long enough such that it spans over the ATS intersection of other SDs. For example, SD3 in Figure 74 has been triggered in one of its allowed times and continues to the ATS intersection of SD1 and SD2. In such a case, messages from all three SDs overlap (in the time domain) and thus may trigger high stress scenarios. Such a situation can also be made possible by our mutation operator (Section 10.7.6.2). SD3 ATS of a SD
SD3
time SD2
SD2
Execution of SDi
SDi
time SD1
SD1
time
Figure 74-An example where the ATS intersection of all SDs is null, but they can overlap. 10.7.4 Determining a Maximum Search Time One important issue in our GA design is the range of the random numbers chosen from the ATS of a SD with an arrival pattern. As discussed in Section 10.3, the number of ATIs or ATPs in some types of APs (e.g. periodic, bounded) can be infinite. Therefore, choosing a random value from such an ATS can yield very large values, thus creating implementation problems.
176 Another direct impact of such unboundedness on our GA is that it would significantly decrease the probability that all (or a subset) of start times of DCCFPs (corresponding to the genes of a chromosome) overlap or be close to each other. If the maximum range when generating a set of random numbers is infinity, the probability that all (or a subset) of the generated numbers are relatively close to each other is very small. Thus, to eliminate such problems, we introduce a solution: GA’s Maximum Search Time. This maximum search time is essentially an integer value (in time units) which enforces an upper bound on the selection of random values for start times of DCCFPs, chosen from an ATS. The GA maximum search time will be used in our GA operators (Section 10.7.6) to limit the maximum ranges of generated random time values. Different values of Maximum Search Time (MST) for a specific run of our GA might produce different results. For example, if the search range is too limited (small maximum search time), not all ATIs and ATPs in all ATSs will be exercised. On the contrary, if the range is too large (compared to maximum values in ATSs), it will take a longer time for the GA to converge to a maximum plateau, since the selection of random start times for DCCFPs will be sparse and the GA will have to iterate through more generations to settle on a stable maximum plateau (in which start times are relatively close to each other). The impact of MST on exercising the time domain is illustrated in Figure 75 using an example, where the ATSs of three APs (a periodic, a bounded and a bursty one) are depicted. Four maximum search times (MSTi) have been arbitrarily chosen. The search range specified by MST1 (Search Range1) is not a suitable one since only time values in the first ATI of the bounded ATS will be chosen thus preventing the GA from searching all possible start times in the ATS range of the depicted bounded AP. This will limit the
177 search space, thus reducing the chances of finding the most stressful situations. Following a similar reasoning, the search range specified by MST2 (Search Range2) is not a suitable one either. MST3 and MST4 specify ranges in which a complete search over the possible ATS values can be performed. Comparing the last two, the latter does not provide any advantage in terms of completeness of the search range over the former, while at the same time causing a slower convergence of the GA. Therefore, MST3 is a preferable maximum search time over MST4. Note that the ATS of the bursty AP in Figure 75 does not play any role in determining a suitable maximum search time, since by having an unrestricted ATS, regardless of the choice of such a MST, any start time can be chosen for a bursty AP. Search Range4 Search Range3 Search Range2 Search Range1 A Periodic AP A bounded AP A bursty AP MST1
MST2
MST3
MST4 MST: Max Search Time
Figure 75-Impact of maximum search time on exercising the time domain. As we saw in the above example, a suitable maximum search time depends on the occurrence and intersections of different ATSs. We discuss below how a suitable maximum search time can be estimated for a set of ATSs based on a set of heuristics. In order to do this, we group the types of arrival patterns (AP) into two groups: •
Bounded Arrival Patterns: APs which result in ATSs where the number of ATIs or ATPs is finite. Only irregular APs match this description.
178 •
Unbounded Arrival Patterns: APs which result in ATSs where the number of ATIs or ATPs is infinite. With this definition, periodic, bounded, unbounded, and bursty APs are unbounded.
If all APs are irregular, then a suitable MST (MSTsuitable) will be the maximum of all latest irregular arrival times in all ATSs. For example, the ATSs of three irregular APs are depicted in Figure 76. A MSTsuitable will be the last arrival time of the third AP (as depicted), which has the maximum time value. This maximum search time will allow the GA to effectively search in the time domain, considering all possible start times from all APs.
Three irregular APs
A suitable maximum search time
Figure 76- The ATSs of three irregular APs. If APs are infinite, the occurrence and intersection of different ATIs in the APs should be taken into account. Since only periodic, irregular, and bounded APs have discrete ATSs (Section 10.3), we only consider them in finding a suitable maximum search time. Unrestricted APs (bursty and unbounded) do not impose any restrictions on the selection of a suitable maximum search time, since any time value is acceptable by a bursty or an unbounded AP. We present in Table 6 a set of heuristics to identify a MSTsuitable based on a given set of periodic, irregular, and bounded APs. In the heuristics, ap.type denotes the type of an AP, e.g., ‘bounded’, ‘periodic’.
179 #
Heuristics
1
MSTsuitable ≥
Rationale max
( ap1 .maxATP ,L , apn .maxATP)
∀api |api .type = 'irregular'
This heuristic will allow the GA to effectively search in the time domain, considering all possible start times from all irregular APs.
2
MSTsuitable ≥
max
( ap1 .URSP ,L , apn .URSP )
∀api |api .type = 'bounded'
This heuristic will provide a full search coverage on all bounded APs simultaneously.
3
MSTsuitable ≥
( ap1 . period ,L , apn . period ) +
The time range around this LCD value can
( ap1 .deviation ,L , apn .deviation)
yield schedules when all the periodic SDs
LCD
∀api |api .type = 'periodic'
max
∀api |api .type = 'periodic'
can start simultaneously. This heuristic can also be used when generating the initial GA population to set start times close to this LCD value which, in turn, can potentially yield stress test schedules with high ISTOF values.
Table 6-A set of heuristics to identify a suitable MST (MSTsuitable). Heuristic #1 denotes that a MSTsuitable should be greater than the maximum value among all maximum ATPs of irregular APs. The rationale beyond this heuristic is the same as the case when all APs of a TM are irregular (discussed above). ap.maxATP denotes the maximum ATP of an irregular AP and can be calculated using the formula in Equation 7. ⎧atp | atp max ∈ ap .ATS ∧ ∀atp ∈ ap .ATS : atp max > atp ; if ap .type =' irregular' ∀ap ∈ AP : ap .maxATP = ⎨ max ; else ⎩undefined
Equation 7-A formula to calculate the maximum ATP (maxATP) of an irregular AP. Heuristic #2 is meant to provide a full search coverage on all bounded APs simultaneously. Recall from Section 10.3 that every bounded ATS has an ATI whose end time is infinity. Furthermore, all time instants after the start time of such an ATI are accepted arrival times. If the MST value is chosen to be greater than all such start times
180 among all bounded APs, the GA will be able to have a full search coverage on all of the APs, and thus, maximizing the chances of finding a test schedule with high stress value. To better formalize heuristic #2, we refer to such a start time as the bounded AP’s Unbounded Range Starting Point (URSP). The URSP of a bounded AP can be calculated using the formula in Equation 8, given the ATIs of the AP. ⎧lastATIsta rt | ( lastATIsta rt ,' null' ) ∈ ap .ATS ∀ap ∈ AP : ap .URSP = ⎨ ⎩undefined
; if ap .type =' bounded' ; else
Equation 8-A formula to calculate the Unbounded Range Starting Point (URSP) of a bounded AP, given the ATIs of the AP. For example, the URSP of the bounded APs in Figure 77 are denoted as URSPi. If the minimum and maximum inter-arrival times (minIAT and maxIAT) of a bounded AP are given, the formula in Equation 9 can be used to calculate the value of the URSP. The proof of this formula is given in Appendix B. ⎧⎡ minIAT ⎤ ⎪⎢ .minIAT ∀ap ∈ AP : ap.URSP = ⎨⎢ maxIAT − minIAT ⎥⎥ ⎪⎩undefined
; if ap.type =' bounded' ; else
Equation 9-A formula to calculate the Unbounded Range Starting Point (URSP) of a bounded AP, given the minimum and maximum inter-arrival times (minIAT and maxIAT) of the AP. Heuristic #3 is meant to provide a time range when all the periodic SDs can be triggered simultaneously or close-enough to each other. The Least Common Denominator (LCD) value of all the period values of the periodic APs provides one such a time range. The time range around this LCD value can yield schedules with potential high stress values.
181 The maximum value of the periodic APs’ deviations is also included in the heuristic #3 to increase the chances of finding a potential schedule with a high stress value. A MSTsuitable value should be calculated by considering all three heuristics in Table 6, i.e., a MSTsuitable is equal to the maximum value among the three right-hand side in the three ≥ inequalities. To better explain the above set of heuristics, an example with three irregular, three periodic, and three bounded APs is shown in Figure 77 and the process of deriving a MSTsuitable for this particular example is described next. Maximum of maxATP’s for all irregular APs
A suitable MST
Irregular APs
URSPmax ... (‘bounded’, (minIAT1, ms), (maxIAT1, ms))
URSP1
Bounded APs
... (‘bounded’, (minIAT2, ms), (maxIAT2, ms))
URSP2 ...
(‘bounded’, (minIAT3, ms), (maxIAT3, ms))
URSP3 .
(‘periodic’, (period1, ms), (devi, ms)) Periodic APs
... (‘periodic’, (period2, ms), (dev2, ms)) ... (‘periodic’, (period3, ms), (dev3, ms))
LCD (Least Common Denominator) of periodi’s
Figure 77-Illustration showing the heuristic of choosing a suitable maximum search time. The maximum value of maxATP’s for the three irregular APs is shown. Heuristic #1 denotes that a MSTsuitable should be greater than this value.
182 The URSP of each bounded AP has been calculated using the formula in Equation 9 based on the minIATi and maxIATi of each AP, and is denoted as URSPi. The maximum value among all URSPi’s is referred to as URSPmax. Heuristic #2 denotes that a MSTsuitable should be greater than this value. Finally, the LCD of the period values of the periodic APs is calculated based on the values of periodi and is shown. Heuristic #3 denotes that a MSTsuitable should be greater than the sum of this value and the greatest deviation value among all periodic APs. A MSTsuitable (shown by a bold line) is the smallest time value which satisfies the above three heuristics. 10.7.5 Objective (Fitness) Function Optimization problems aim at searching for a solution within the search space of the problem such that an objective function is minimized or maximized [85]. In other words, the objective function can aim at either minimizing the value of chromosomes or maximizing them. The objective function of a GA measures the fitness of a chromosome. Recall from Section 10.4 that our optimization problem is defined as follows: What selection and what schedule of DCCFPs maximize the traffic on a specified network or node (at a specified time instant)? Recall from Section 10.2 that we only apply our GA-based technique to instant test objectives. Therefore, let us refer to the objective function in this section as Instant Stress Test Objective Function (ISTOF). The ISTOF should measure the maximum instant traffic entailed by a schedule of DCCFPs, specified by a chromosome. Using the network formalism in Chapter 8, we define ISTOF in Equation 10.
183 Note that what we define below as the ISTOF formula is only for the stress test objective: location=network, direction=none, and type=data traffic. Other values for these parameters would lead to a different ISTOF measure by simply using other distributed traffic usage functions from the set of functions defined in Section 8.5. ISTOF : Chromosome → Re al ∀c ∈ Chromosome : ISTOF ( c ) =
max
∀t ∈SearchRange
∑ NetInstDT ( g .dccfp ,net ,t ) × g.numOfMultipleSDInstances
∀g ∈c . gene
SearchRange = [ min ( g .startTime ), max (g .startTime + Length( g .dccfp )) ] ∀g ∈c , gene
∀g ∈c . gene
Equation 10- Instant Stress Test Objective Function (ISTOF). The first line of Equation 10 indicates that the input and output domains of ISTOF are chromosomes and real numbers. c.Length(dccfp) is a function to calculate the time duration of a DCCFP (modeled in the corresponding SD using the UML-SPT taggedvalues). Such a calculation can be done as follows: Length( ρij ) =
max
(m.end )
∀m∈CCFP( ρ ij )
net is the given network to stress test. NetInsDT is the distributed traffic usage function to measure the instant data traffic in a network (Section 8.5.2.1). The value of NetInsDT is multiplied by the gene’s numOfMultipleSDInstances value. When multiple instances of a DCCFP are triggered at the same time, the entailed traffic at each time instant is proportional to the number of instances. The heuristic underlying the ISTOF formula is that it tries to find the maximum instant data traffic considering all genes in a chromosome. The search is done in a predetermined time range. The starting point of the search is the minimum startTime (the start time of the earliest DCCFP), and the ending point of the range is the end time of the latest
184 DCCFP, which is calculated by taking maximum values among start times plus DCCFP lengths. To better illustrate the idea behind ISTOF, let us discuss how ISTOF for the chromosome in Figure 70-(b) is calculated. The calculation process is shown in Figure 78. The chromosome contains two genes, which correspond to DCCFP1,2 and DCCFP2,2. The search range is [2ms, 20ms]. ISTOF sums the NetInsDT values in this range and finds the maximum value. The output value of ISTOF is 110 KB. A chromosome
Search range
DT (in KB)
NetInsDT(DCCFP1,2, SystemNetwork, t)
Gene
Gene
(DCCFP1,2, 2ms)
(DCCFP2,2, 9ms)
90 90 0 20 0
0
0
30 30 30
0
40 40 40 40
ISTOF
80 80 0
0
40 40 40
DT (in KB)
DT (in KB)
ISTOF=110 NetInsDT(DCCFP2,2, SystemNetwork, t)
0 20 20
0
1
2
3
4
5
6
7
8
9 10 11 12 13 14 15 16 17 18 19 20
110 110
90 90 0 20 0
0 2
t (ms)
3
4
5
6
7
0 8
30
80 80 80 0
40 20 20 0
9 10 11 12 13 14 15 16 17 18 19 20 t (ms)
Figure 78-Computing the Instant Stress Test Objective Function (ISTOF) value of a chromosome. 10.7.6 Operators Operators enable GAs to explore a solution space [87] and must therefore be formulated in such a way that they efficiently and exhaustively explore it. If the application of an operator yields a chromosome which violates at least one of the GA’s constraints, the operation is repeated to generate another chromosome. This is an alternative to GA backtracking and is done inside each operator, i.e., each operator generates temporary children first and checks if they do not violate any constraints (Section 10.7.2). If the
185 temporary children satisfy all the constraints, they are returned as the results of the operator. Otherwise, the operation is repeated. Furthermore, operators should be formulated such that they explore the whole solution space. We define the crossover and mutation operators next. 10.7.6.1 Crossover Operator Crossover operators aim at passing on desirable traits or genes from generation to generation [87]. Varieties of crossover operators exist, such as sexual, asexual and multiparent. The former uses two parents to pass traits to two resulting children. Asexual crossover involves only one parent. Multi-parent crossover combines the genetic makeup of three or more parents when producing offsprings. Different GA applications call for different types of crossover operators. We employ the most common of these operators: sexual crossover. The general idea behind sexual crossover is to divide both parent chromosomes into two or more fragments and create two new children by mixing the fragments [87]. Pawlowsky dubs this n-point crossover [95]. In n-point crossover, the two parent chromosomes are aligned and cut into n+1 fragments at the same places. Once the division points are identified in the parents, two new children are created by alternating the genes of the parents [95]. In our application, since each gene corresponds to a SD, we consider the fragmentation policy to be on each gene, making the size of each fragment to be one gene. Therefore, assuming n is the number of genes, the resulting crossover operator (using Pawlosky’s terminology [95]) is (n-1)-point, and is denoted nPointCrossover. In our application, the
186 mixing of the fragments is additionally subject to a number of constraints (Section 10.7.2): A newly generated chromosome should satisfy the inter-SD and arrival pattern constraints. We ensure this by designing the GA operators in a way that they would never generate an offspring violating a constraint. Whether the alternation process of the nPointCrossover operator starts from the first gene of one parent or the other is determined by a 50% probability. To further introduce an element of randomness, we alternate the genes of the parents with a 50% probability, hence
implementing
a
second
crossover
operator,
nPointProbCrossover.
In
nPointCrossover, the resulting children have genes that alternate between the parents. In nPointProbCrossover, the same alternation pattern occurs as nPointCrossover, but instead of always inheriting a fragment from a parent, children inherit fragments with a probability of 50%. It is important to note that, for both crossover versions, if the set of genes (their corresponding SDs) do not belong to an ISDS, constraint #1 (Section 10.7.2.1) will be violated. In such a case, we do not commit the changes and search for different parent chromosomes (by applying the operator again). Regarding constraint #2 (Section 10.7.2.2), note that since the parents are assumed to satisfy the arrival pattern constraint, and the crossover operators do not change the start times of genes’ DCCFPs, the child chromosomes are certain to satisfy such constraint. The start times of DCCFPs will be changed (mutated) by our mutation operator (described in the next section) and the arrival pattern constraint will be checked when applying that operator. An activity diagram for depicting the crossover operators is shown in Figure 79. Note that the crossover operator function in the diagram can be any of the two
187 nPointCrossover or nPointProbCrossover operators (specified by the operator type, given as a parameter to the activity diagram). Crossover Operator Discard
[not constraint 1] Parent 1
Remove Parent 1
[constraint 1]
Child 1 Add to the Population
Crossover Operator Function Parent 2
Child 2 [not constraint 1]
Crossover operator type {nPointCrossover, nPointProbCrossover}
[constraint 1] Remove Parent 2
Discard
Figure 79-Crossover operators. Let us consider the example in Figure 80 to see how our two crossover operators work. The number of genes in each parent chromosome is five (assuming that there are five SDs in the SUT). Assume that SD numbering is the same as gene numbering and ISDS1={SD1, SD3, SD4, SD5}. Parent 1 has genes corresponding to DCCFPs in {SD1, SD4, SD5}⊂ ISDS1. Parent 2’s genes are DCCFPs in {SD1, SD3, SD4}⊂ISDS1. The results of applying nPointProbCrossover and nPointCrossover are shown in Figure 80. In nPointCrossover, the fragments of Parent 1 and Parent 2 are alternately interchanged. Using the same example for nPointProbCrossover, one possible outcome appears in Figure 80-(c). Bold genes indicate the fragments interchanged by nPointProbCrossover. All four generated children conform to constraint #1, i.e., the SD corresponding to their genes belong to one ISDS (ISDS1), as well as constraint #2..
188 The advantages of nPointProbCrossover are twofold. It introduces further randomness in the crossover operation. By doing so, it allows further exploration of the solution space. However, nPointProbCrossover has its disadvantages: the resulting children may be replicas of the parents, with no alteration occurring. This is never the case with nPointCrossover; resulting children are always genetically distinct from their parents. Parent 1
(p1,1, 3ms)
null
null
(p4,1, 4ms)
(p5,2, 7ms)
Parent 2
(p1,2, 2ms)
null
(p3,4, 5ms)
(p4,2, 6ms)
null
(a)
nPointCrossover
nPointProbCrossover
Child 1
(p1,1, 3ms)
null
null
(p4,2, 6ms)
(p5,2, 7ms)
Child 1
(p1,2, 2ms)
null
null
(p4,1, 4ms)
null
Child 2
(p1,2, 2ms)
null
(p3,4, 5ms)
(p4,1, 4ms)
null
Child 2
(p1,1, 3ms)
null
(p3,4, 5ms)
(p4,2, 6ms)
(p5,2, 7ms)
(b)
(c)
Figure 80-Two example uses of the crossover operators. Crossover rates are critical. A crossover rate is the percentage of chromosomes in a population being selected for a crossover operation. If the crossover rates are too high, desirable genes will not be able to accumulate within a single chromosome whereas if the rates are too low, the search space will not be fully explored [87]. De Jong [92] concluded that a desirable crossover rate should be about 60%. Grefenstette et al. [93] built on De Jong’s work and found that crossover rates should range between 45% and 95%. Consistent with the findings of De Jong and Grefenstette, we apply a crossover rate of 70%. 10.7.6.2 Mutation Operator Mutation aims at altering the population to ensure that the GA avoids being caught in local optima. The process of mutation proceeds as follows: a gene is randomly chosen for
189 mutation, the gene is mutated, and the resulting chromosome is evaluated for its new fitness. We define three mutation operators that (1) mutate a non-null gene (a gene with an already assigned DCCFP) in a chromosome by altering either its DCCFP, (2) mutate the start time of a non-null gene, or (3) mutate the entire chromosome by assigning another ISDS to it (i.e., assign to each gene of the chromosome to mutate a randomly selected DCCFP from the corresponding SD of a randomly selected ISDS and a start time from the ATS of that SD in a range up to GA’s maximum search time). The mutation operators are referred to as DCCFPMutation, startTimeMutation, and ISDSMutation, respectively. The idea behind the DCCFPMutation operator is to choose different DCCFPs of the SD, corresponding to a gene. The idea behind the startTimeMutation operator is to move DCCFP executions along the time axis. The aim of the operators is to find the optimal DCCFPs and start times at which instant traffic of the selected genes (DCCFPs) is maximized. This is done in such a way that the constraints we defined on the chromosomes are met (Section 10.7.2). Since the mutation operators alter non-null genes only, they do not change the set of SDs corresponding to a chromosome, thus ensuring that constraint #1 is satisfied (the set of SDs will still belong to the same ISDS). However, start times are changed by the mutation operator startTimeMutation, resulting in a possible violation of constraint #2. The output of the DCCFPMutation operator will always adhere to constraint #2, since the start times are unchanged by the operator. One way of making sure that a generated chromosome by the startTimeMutation operator satisfies the arrival pattern constraints is to set the new start times to a random value in the range of accepted arrival time values of
190 a SD, i.e., Accepted Time Sets (ATS) – (Section 10.2). Therefore, we design the startTimeMutation operator in such a way that the altered start times are always among the accepted one. In other words, there will be no need to backtrack in this case. The above descriptions of the three mutation operators can be illustrated as two activity diagrams in Figure 81 to Figure 83, respectively. Note that the manipulations used in these two figures are in the chromosome and genes metamodel domain (Figure 70). For example, g.selectedDCCFP denotes the DCCFP assigned to a gene. ATS(sd) return the ATS of SD sd. Mutation rates are critical. Mutation rate is the percentage of chromosomes in a population being selected for mutation. Throughout the GA literature, various mutation rates have been used. If the rates are too high, too many good genes of a chromosome are mutated and the GA will stall in converging [87]. Back [96] enumerates some of the more common mutation rates used. The author states that De Jong [92] suggests a mutation rate of 0.001, Grefenstette [93] suggests a rate of 0.01, while Schaffer et al. [94] formulated the expression 1.75 / λ length (where λ denotes the population size and length is the length of chromosomes) for the mutation rate. Mühlenbein [97] suggests a mutation rate defined by 1/length. Smith and Fogarty [98] show that, of the common mutation rates, those that take the length of the chromosome and population size into consideration perform significantly better than those that do not. Based on these findings, we apply the mutation rate suggested by Schaffer et al.: 1.75 / λ length .
191 DCCFPMutation Operator
DCCFP sets of SDs
A randomly chosen chromosome c
Choose a random gene
Replace g.selectedDCCFP with a randomly selected DCCFP from g.sd
New chromosome c’
A randomly chosen gene g of chromosome c
Figure 81- DCCFPMutation operator. startTimeMutation Operator
DCCFP sets of SDs
A randomly chosen chromosome c
Choose a random gene
Replace g.startTime with a randomly selected start time from ATS(g.sd), in a range up to GA’s MST (Maximum Search Time)
New chromosome c’
A randomly chosen gene g of chromosome c
Figure 82- startTimeMutation operator. ISDSMutation Operator A randomly chosen ISDS isds
A randomly chosen chromosome c
Assign to each gene of c a randomly selected DCCFP from the corresponding SD of isds and a start time from the ATS of that SD in a range up to GA’s MST (Maximum Search Time)
New chromosome c’
Figure 83- ISDSMutation operator. 10.8 Interval Stress Test Strategies accounting for Arrival Patterns As discussed in Section 10.5, interval stress test strategies need to account for the ATSs of SDs with arrival patterns. For such SDs, the earliest time points in their ATSs are
192 considered (to cause the most stressful situation, that is the shortest overall SDs execution). Therefore, no complicated global search (such as the GA used for the instant stress strategies) is required in this case. The time length of CSDFPs will increase in such a case, compared to the case when there is no SD in a CSDFP with arrival patterns (refer to Figure 68-(c) and Figure 68-(d) as an example). We present an pseudo-code in Algorithm 2, referred to as APStressNetIntDT, which takes into account arrival patterns.
193
Find the DCCFP of each SD with maximum unit data traffic
1.
1.1.
For each SDi 1.1.1. For each DCCFP ρij of SDi // Finding maximum stress message of each DCCFP Calculate Unit Data Traffic (UDT) of ρij, using: NetUDT ( ρ ij , net ) =
∑ (NetInsDT ( ρ t
ij
, net ,t ))
Duration( ρ ij )
where Duration( ρ ij ) is the time length of DCCFP ρij and can be calculated as: Duration( ρ ij ) =
where
max
(m.end )
∀m∈CCFP ( ρ ij )
CCFP ( ρ ij )
is the CCFP corresponding to DCCFP ρij.
1.1.1. Among all DCCFPs ρij of SDi, find the one with maximum unit data traffic MaxNetPerDTDCCFP( SDi , net ) = ρ i max
∀ρ i max , ρ ij ∈ DCCFP( SDi ) : NetUDT ( ρ i max , net ) ≥ NetUDT ( ρ i max , net )
If no DCCFP in SDi is found with the above criteria, the function returns null. 2.
Choose a CSDFP (Concurrent SD Flow Path) with maximum stress: // Inter-SD constraints are
considered here 2.2
For each CSDFPi // Calculate each CSDFP’s Unit Data Traffic (UDT) NetUDT ( CSDFPi , net ) =
∑ ∑ NetInsDT ( MaxNetPerDTDCCFP( SD , net ),net ,t )
∀SD∈CSDFPi ∀t
minAPDuration(BuildDCCFPS (CSDFPi , MaxNetIntDT , net ))
where minAPDuration is an extended version of the function Duration (presented in Section 7.2.3) that calculates the minimum time length of a DCCFPS (DCCFP Sequence) given the arrival pattern of its SDs. Arrival pattern constraints are considered in this step, affecting the length of DCCFPSs, and hence helping the algorithm to find the DCCFPS with highest stress per time unit. BuildDCCFPS is function that builds a DCCFPS from the given CSDFPi using the given criteria: MaxNetIntDTDCCFP , net .
2.2
Among all CSDFPs, find the sequences with maximum NetUDT ( CSDFPi , net ) and return it as
output (CSDFPmax)
Algorithm 2-Derivation of interval stress test requirements for data traffic on a given network, considering arrival patterns (APStressNetIntDT).
194 In the algorithm, minAPDuration(aDCCFPS), in Step 2.1, is a variation of function Duration (presented in Section 7.2.3) that calculates the minimum time length of a DCCFPS (DCCFP Sequence) given the arrival pattern of its SDs. Arrival pattern constraints are accounted for in this step, affecting the length of DCCFPSs, and hence helping the algorithm to find the DCCFPS with highest stress per time unit. BuildDCCFPS is a function that builds a DCCFPS from the given CSDFPi using the given criteria
MaxNetIntD TDCCFP , net .
The pseudo-code of minAPDuration() is shown in
Algorithm 3 which is very similar to that of Duration(), presented in Section 7.2.3. The only difference is how the duration of an atomic CCFPS is calculated. The illustration in Figure 84 shows the impact of arrival patterns in the actual duration of a CCFP. On the left-hand side of this figure, the duration of a CCFP has been calculated using Duration, since the CCFP’s corresponding SD does not have an arrival pattern. Conversely, the right-hand side of the figure shows the case when the corresponding SD of a CCFP has an arrival pattern. The ATIs of the arrival pattern are depicted. In this case, the actual duration of the CCFP has been calculated using minAPDuration, which is the summation of the CCFP’s duration plus the minimum arrival time of the corresponding SD, based on its arrival pattern. The idea is formalized in the calculation of the function earliestAT (arrival time) in Equation 11 which calculates the earliest arrival time of a SD given its arrival pattern. If a SD does not have an arrival pattern, earliestAT returns 0, meaning that the SD can start immediately, given that its sequential/conditional SD constraints are satisfied.
195 Duration(ccfp)
minAPDuration(ccfp)
ccfp
ATIs of SD AP
ccfp time (ms)
Without arrival patterns
With arrival patterns
time (ms)
earliestAT(SD AP)
Figure 84-Impact of arrival patterns on the duration of a CCFP. 1. Function minAPDuration(ccfps: CCFPS): integer 2.
if ccfps is atomic (only made of one CCFP)
3.
return max (m.endTime ) + earliestAT ( SD ) | ccfp = the only CCFP of ccfps ccfps ∀m∈ccfps
4.
else if ccfps is the serial concatenation of several CCFPSs (i.e., ccfps = ccfps1 L ccfps n ) return minAPDuration (ccfps1)+…+ minAPDuration (ccfpsn)
5. 6.
else if ccfps is the concurrent combination of several CCFPSs (i.e.,
7.
⎛ ccfps1 ⎞ ⎜ ⎟) ccfps = ⎜ L ⎟ ⎜ ccfps ⎟ n⎠ ⎝
return max(minAPDuration (ccfps1),…, minAPDuration (ccfpsn))
8. End Function
Algorithm 3-Calculating the minimum duration of a Concurrent Control Flow Path Sequence (CCFPS), accounting for arrival patterns. ⎧ min ( atp) ; if SD has an arrival pattern earliestAT ( SD) = ⎨∀atp∈ATS( SD ) ; else ⎩0
Equation 11- Function returning the earliest arrival time of a SD based on its arrival pattern. For example, let us calculate the duration of the following CCFPS: ⎛ ρ2 ⎞ CCFPS = ρ1 ⎜⎜ ⎟⎟ ρ 4 ⎝ ρ3 ⎠
196 where each ρi is a CCFP of SDi. Assume the duration of each of the individual CCFPs and arrival patterns of their corresponding SDs are given as in Table 7. Following the analysis in Section 10.2 and 10.3, we first compute the Accepted Time Sets (ATS) of the SDs. The result of earliestAT(SD) for each SD is also shown. For example, since the AP of SD1 is bursty, its earliest arrival time can be 0ms. CCFP
Duration
SD
Arrival Pattern
earliestAT(SD)
CCFP1
2800 ms
SD1
(‘bursty’, (500, ms), 2)
0ms
CCFP2
1300 ms
SD2
No arrival pattern
0ms
CCFP3
1000 ms
SD3
(‘periodic’, (500, ms), (100, ms))
400ms
CCFP4
1000 ms
SD4
(‘bounded’, (500, ms), (600, ms))
500ms
(a)
(b)
Table 7-(a): Durations of several CCFPs. (b): Arrival patterns of several SDs. The call tree of the recursive algorithm minAPDuration applied to CCFPS is shown in Figure 85. Since CCFPS1 is a serial concatenation of three CCFPSs itself, three recursive calls are made, whose results will be summed upon return. One of these CCFPSs ( ⎛⎜ ρ 2 ⎞⎟ ), ⎜ρ ⎟ ⎝ 3⎠
is the concurrent combination of two CCFPs, therefore the maximum value of their durations
are
returned
as
the
durations
minAPDuration(ρ3)=1000+400=1400ms.
of
this
CCFPS.
For
example
197 ⎛⎛ ⎛ ρ ⎞ ⎞⎞ minAPDuration⎜ ⎜⎜ ρ1 ⎜⎜ 2 ⎟⎟ ρ 4 ⎟⎟ ⎟ ⎜ ⎝ ρ3 ⎠ ⎟ ⎠⎠ 5700 ms ⎝⎝ +
minAPDuration(ρ1 ) 2800 ms
+
⎛⎛ ρ ⎞⎞ minAPDuration⎜⎜ ⎜⎜ 2 ⎟⎟ ⎟⎟ ⎝ ⎝ ρ3 ⎠ ⎠ 1400 ms
minAPDuration(ρ 4 ) 1500 ms
max
minAPDuration(ρ 2 ) 1300 ms
minAPDuration(ρ 3 ) 1400 ms
Figure 85-Call tree of the recursive algorithm minAPDuration applied to a CCFPS. 10.9 Impacts of Uncertainty in Timing Information on our Stress Test Methodology We discussed the possible uncertainty in timing information (execution times of messages) in Section 5.1.1.2. Now that we already presented the simpler version of our stress test methodology (Time-Shifting Stress Test Technique) in the earlier sections of the current chapter, we can now discuss the impacts of uncertainty in timing information on TSSTT. Since each of our instant and interval stress test strategies consider time differently (the former focuses on time instants and the latter on time intervals), the impacts of time uncertainty are likely to be different on each of the two strategies, as described next. Recall the heuristics of our instant stress test strategy (Section 9.2), where the shifting (scheduling) of CCFPs along the time axis is performed such that the instant traffic (on a specific network) is maximized. Referring to Figure 56 as an example showing our stress test heuristics, it can be observed that if the start and/or end times of any message are changed (an effect of uncertainty in timing information), the output stress test requirements might change dramatically. Such an impact (in an optimal output) is
198 specially great if there are uncertainties in timing information of maximum stressing message(s) of DCCFPs. Such uncertainties will most probably change the output test requirement by shifting an involved DCCFP along time axis or by entirely changing the ISDS associated with the test requirement. Investigating the impacts of uncertainty in timing information on outputs of our stress test methodology can actually be performed by adopting sensitivity analysis8 theories from the optimization field. Based on the above discussions, we expect that our optimization problem (stress test methodology) is quite sensitive to uncertainty in timing information. Informally, it can be stated as the average variance (as a measure of uncertainty) in timing information in a SUT increases, the preciseness of the output stress test requirements generated by our methodology decreases. The preciseness of a test requirement in this context corresponds to the certainty by which executing test cases corresponding to that test requirement will maximize traffic on a given network (or a node). The formal (mathematical) sensitivity analysis of the impacts of uncertainty in timing information on our stress test methodology would require more discussions that, due to space shortage and our project boundaries, we leave to future works.
8
A procedure to determine the sensitivity of the optimal result of an optimization
problem to changes in its parameters (e.g. constraints and coefficients). If a small change in a parameter results in relatively large changes in the optimal result, the problem is said to be sensitive to that parameter.
199 One possible ad-hoc idea to help our stress test methodology cope with uncertainty in timing information is to focus on the middle time-unit portion of maximum stressing messages (whenever it exists) when attempting to build a stress test schedule. To better express this idea, consider Figure 56-(c) where the first portions of four maximum stressing messages (in the four DCCFPs) are considered to build a stress test schedule. Furthermore, assume that there is uncertainty on the start and end times of the only call message of DCCFP3. The above idea suggests to slightly change the stress test schedule so that the middle portion of DCCFP3 (from 4 to 5 ms in Figure 56-(b)) is triggered on the maximum stress time instant. The heuristic behind the above ad-hoc idea is that: if the start or the end time of the only call message of DCCFP3 slightly differs (less than a 1 ms) at test runtime, the hope is that the stress test can still maximize the amount of traffic. Of course, the success of such slight changes in DCCFP schedules of a stress test requirement in coping with uncertainty in timing information is dependent on several factors, such as: (1) the levels of timing uncertainty, i.e. low chances of highest possible traffic if there are high levels of uncertainty in the durations of the involved messages, (2) the time durations of the involved messages, i.e., low chances of highest possible traffic if the durations of the involved messages are relatively short. 10.10 Wait-Notify Stress Test Technique Recall from Section 5.1.1.3 where we discussed messages with unpredictable execution times (or start/end times). After using different schedulability analysis techniques to estimate execution times of messages in a SUT, there might still be messages whose execution times are unpredictable, or no WCET/BCET can be found for them. Examples
200 of such messages are those with data-intensive parameters whose data sizes can not be estimated by any means in advance. Estimating the execution times of such messages will lead to great amounts of uncertainty in such time values, which might lead to great deals of indeterminism in our stress test methodology and the output test requirements it will generate (Section 10.9). Thus, we will present in the current section a different version of our stress test methodology, referred to as Wait-Notify Stress Test Technique (WNSTT), which can be used to stress test systems with at least one message with unpredictable execution time. The underlying ideas of WNSTT is taken from the barrier scheduling heuristics [21] for finding concurrent bugs in Java programs. To find concurrent bugs, the authors of [21] created interesting interleavings (interesting here means effective at finding bugs) related to a given shared variable by installing thread barriers before and after accessing the variable. The barrier is implemented by using a counting semaphore. The semaphore causes threads to wait just before the shared variable is accessed. When more than one thread is waiting, then the Java statement notifyAll() is used to simultaneously advance the waiting threads. Thus, threads access the variable simultaneously. As a result, the probability of a data race occurring increases and with it the probability of a concurrent bug manifesting. We adopt the barrier scheduling heuristics to devise WNSTT as follows. To increase the chances of manifesting real-time faults, WNSTT intends to generate stress test requirements by installing barriers before messages which entail maximum traffic (among all messages of a DCCFP) on a given network (or a node). The barrier can be implemented by using a counting semaphore. The semaphore causes all DCCFPs (of an
201 ISDS, chosen among all ISDSs such that total instant traffic is maximal) to wait just before each of the involved messages are triggered. When all the DCCFPs (of the chosen ISDS) is waiting, then all the DCCFPs are notified to simultaneously trigger the waiting messages. Thus, all the maximum stressing messages send their instant traffic simultaneously. As a result, the probability of a traffic fault occurring increases and with it the probability of a real-time bug manifesting. The above heuristics of the WNSTT are illustrated with an example in Figure 86. Barriers are installed before messages which entail maximum traffic (among all messages of a DCCFP).
Figure 86-Heuristics of the Wait-Notify Stress Test Technique (WNSTT).
202
Chapter 11
AUTOMATION AND ITS EMPIRICAL ANALYSIS
To improve automation for the two stress test techniques, namely Time-Shifting Stress Test Technique (TSSTT) in Chapter 9, and Genetic Algorithm-based Stress Test Technique (GASTT) in Chapter 10, we implemented a prototype tool, referred to as GARUS (GA-based test Requirement tool for real-time distribUted Systems). Note that GARUS supports both GASTT and TSSTT. Although it is primarily implemented for GASTT, it can be used for TSSTT as well. This is done by simply specifying that none of the SDs of a SUT have arrival patterns. This will be discussed in detail in Section 11.2. We used GAlib [99], an open source C++ library for GAs. An overview of GAlib is presented in Section 11.1. Section 11.2 describes our tool. Section 11.3 reports how we validated the test requirements generated by GARUS and the efficiency and effectiveness of our GA through empirical means. 11.1 GAlib The library used to implement our GA-based tool was GAlib [99]. GAlib was developed by Matthew Wall at the Massachusetts Institute of Technology. GAlib is a library of C++
203 objects. The library includes tools for implementing genetic algorithms to do optimization in any C++ program using any chromosome representation and any genetic operators. The library has been tested on multiple platforms, specifically DOS/Windows, MacOS and UNIX. It can also be used with parallel virtual machines to evolve populations in parallel on multiple CPUs. Figure 87 illustrates the basic GAlib class hierarchies. Only the major classes of the library are shown. For complete class listing, the reader is referred to [99]. GAScalingScheme
GAGeneticAlgorithm
GASelectionScheme
GANoScaling
GASampleGA
GALinearScaling
GASteadyStateGA
GARouletteWheelSelector
GAPowerLawScaling
GAIncrementalGA
GATournamentSelector
GASharing
GADemeGA
GASigmaTruncationScaling
GARankSelector
GAUniformSelector GASRSSelector
GAStatistics
GASUSSelector GAPopulation
GAParameterList
GADSSelector
GAGenome
GABinaryString GA1DBinaryStringGenome
GAList
GATree
GAListGenome
GATreeGenome
GAArray GA1DArrayGenome
GA2DBinaryStringGenome
GA2DArrayGenome
GA3DBinaryStringGenome
GA3DArrayGenome
Figure 87-Basic GAlib class hierarchy (adopted from [99]). GAlib defines many options. It supports four types of genetic algorithms: simple, steady state, incremental and deme. The former three types are described in Appendix A. The deme genetic algorithm evolves multiple populations in parallel using a steady state algorithm. During each population, some individuals are migrated between the populations [99]. GAlib also supports various selection methods for choosing an
204 individual for mutation and crossover. These include rank selection, roulette wheel, tournament, stochastic remainder sampling (SRS), stochastic uniform sampling (SUS) and deterministic sampling (DS). 11.2 GARUS9 GARUS (GA-based test Requirement tool for real-time distribUted Systems) is our prototype tool for deriving stress test requirements. Section 11.2.1 presents the class diagram of GARUS. The overview activity diagram of GARUS is described in Section 11.2.2. The input/output file formats are presented in Section 11.2.3 and Section 11.2.4, respectively. 11.2.1 Class Diagram The simplified class diagram of GARUS is shown in Figure 88. The classes in the class diagram are grouped in three packages: TestModelGenerator, TestModel and GA. To simplify the implementation of GARUS, we assume that a TM has already been built from a given UML model and a set of test parameters by a test model generator (the TestModelGenerator package). The TM is also assumed to be filtered by the given set of test parameters. For example, if test parameters are for a StressTestNetInsDT test strategy
9
The source code of the tool, as well as sample input/output files for several systems
under test, a random input model generator, and the data files for empirical GA validations of the tool are available from the World Wide Web [100]
V.
Garousi,
"GARUS (Genetic Algorithm-based test Requirement tool for real-time distribUted Systems)," in http://squall.sce.carleton.ca/tools/GARUS, 2006..
205 over a network net, all DCCFPs in the CFM and network usage pattern parts of a TM are assumed to have been filtered by that particular network. Thus, we would ideally have a package in GARUS that handles this. However, to simplify the implementation of GARUS, the package is currently bypassed (the filtered TM is built manually from a UML model). The classes in the TestModel package store information about the test model of a SUT. The GA package includes the GA domain-specific classes, which solve the optimization problem and derive stress test requirements. One object of class TestModel and one object of class GASteadyState GA are instantiated at runtime for a SUT. The connection between the two packages is achieved via class DCCFP (in the TestModel package) and class GARUSGene (in the GA package). GARUS TestModelGenerator
UMLModel TestParameters
TestModel
GA TestModel
+getARandomArrivalTime()
arrivalPattern 1
+readTestModel() 1*
minIAT maxIAT ATIs:List
1*
burstyAP
periodicAP
burstIntervalLength maxNumOfArrivals
periodValue deviationValue
1* *
unboundedAP
irregularAP numOfPoints points:List
GAlib::GA1DArrayGenome
+initialize() +evolve()
-End8 -End7 ISDSs
*
ISDS
boundedAP
noAP
GAlib::GAGenome GAlib::GAGeneticAlgorithm
AP
*
GAlib::GASteadyStateGA
-End8 -End7 SDs
1
SD -End8 -End7 DCCFPs
DCCFP 1*
*
GARUSGene DCCFP 0..1
-End8 -End7 NTUPs
NTUP
0..1 time 1
ga -End7
GARUSGenome
-End8 +Initializer() genomes +Mutator() 1 * +Evaluator() * * genes +Comparator() [ordered] +nPointCrossover() -End8 -End7 +nPointProbCrossover()
startTime
UML-SPT::RTtimeValue
Figure 88-Simplified class diagram of GARUS.
206 Abstract class AP in the TestModel package realizes the implementation of arrival patterns. Six subclasses are inherited from class AP, five of which correspond to the five types of arrival patterns (Section 10.1). Objects of type class noAP are associated with SDs which have no arrival patterns. Due to the implementation details, this choice was selected instead of setting the arrivalPattern association of such SDs to null. Function getARandomArrivalTime() is used in the mutation operator of GARUS (Mutation() in class GARUSGenome) and, for each subclass of AP, it returns a random arrival time in the corresponding ATS (Section 10.3) according to the type of arrival pattern. 11.2.2 Activity Diagram The overview activity diagram of GARUS is presented in Figure 89. The test model of a SUT is given in an input file. GARUS reads the test model from the input file and creates an object named tm of type TestModel, initialized with the values from the input test model. Then, an object named ga of type GAlib::SteadyStateGA is created, such that tm is used in the creation of ga’s initial population (Section 10.7.3). Note that object ga has a collection of chromosomes of type GARUSGenome, and each object of type GARUSGenome has an ordered set of genes of type GARUSGene (refer to the class diagram in Figure 88). Furthermore, ga’s parameters (e.g. mutation rate) are set to the values as discussed in Section 10.7. GARUS then evolves ga using the overloaded GA mutator and crossover operators (Section 10.7.6). When the evolution of ga finishes, the best individual (accessible by ga.statistics().bestIndividual())
is saved in the output file (see Section 11.2.4).
207 GARUS (GA-based test Requirement generator for real-time distribUted Systems) Input File Test Model of a SUT
Read the input file into an object of type TestModel
tm:TestModel
Initialize an object of type GASteadyStateGA
Output File Evolve ga
ga.statistics() .bestIndividual()
Stress Test Requirements
ga:GASteadyStateGA
Figure 89-Overview activity diagram of GARUS. 11.2.3 Input File Format The input file provided to GARUS contains the test model (TM) of a SUT. As it was shown in Figure 10, a TM consists a CFM (including DCCFPs), inter-SD constraint (ISDSs) and distributed traffic usage patterns. Referring to Figure 10, stress test parameters are also part of the input. As discussed in Chapter 9, stress test parameters are in fact the type of stress test technique (e.g. StressTestNetInsDT and StressTestNodInIntMT) and a set of parameters specific to the technique (e.g. a node name and a period’s start/end times for the StressTestNodInIntMT stress test technique). Furthermore, as it was discussed in the algorithms and equations in Chapter 8, a test model can be filtered based on different attributes discussed in distributed traffic usage analysis (e.g. location, direction, and period). The input file is in a format to accommodate a filtered TM. For example, if test parameters are for a StressTestNetInsDT test strategy over a network net, all DCCFPs in the CFM and network usage pattern parts of a TM are assumed to have been filtered by that particular network. The input file format consists of several blocks, each specifying
208 different elements of a TM. GARUS input file format is shown using the BNF in Figure 90. The input file format can be best described using an example. An example input file is shown in Figure 91. Different blocks are separated with a gray highlight. The TM starts with a block of two ISDSs ISDS0 and ISDS1 (ISDSsBlock in Figure 90). For example, ISDS0 consists of three SDs: SD0, SD1, and SD2. The second block of the input file shows SDs (SDsBlock in Figure 90). There are five SDs: SD0,…, SD4. Each SD line consists of a SD name, number of concurrent multiple instances allowed, followed by the number of its DCCFPs and their names. For example SD2 has two DCCFPs named p21 and p22. inputFileFormat ::= ISDSsBlock SDsBlock SDAPsBlock DCCFPsBlock ISDSsBlock ::= nISDSs ISDS1 K ISDS nISDSs ISDSi ::= ISDSNamei nSDsInISDSi SDName1 K SDNamenSDsInISDSi SDsBlock ::= nSDs SD1 K SDnSDs SDi ::= SDNamei nMultipleIns tan cesi nDCCFPsInSDi DCCFPName1 K DCCFPNamenDCCFPsInSDi SDAPsBlock ::= SDAP1 K SDAPnSDs SDAPi ::= SDNamei APTypei APParametersi APTypei ::= no _ arrival _ pattern | periodic | bounded | irregular | bursty | unbounded ⎧∈ ⎪ periodValue deviationValue ⎪ i i APParametersi ::= ⎨ ⎪minIATi maxIATi ⎪⎩nArrivalPointsInAPi APoint1 K APoint nArrivalPointsInAPi
; if APTypei ∈ {no _ arrival _ pattern ,bursty ,unbounded } ; if APTypei = periodic ; if APTypei = bounded ; if APTypei = irregular
DCCFPsBlock ::= DCCFP1 K DCCFPnDCCFPs 14444244443 nDCCFPs = ∑ nDCCFPsInSDi ∀SDi
DCCFPi ::= DCCFPNamei nDTUPPsInDCCFPi DTUPP1 K DTUPPnNTUPPsInDCCFPi DTUPPi ::= ( timei valuei ) GAMaxSearchTime
Figure 90-GARUS input file format. The third block shows SD Arrival Pattern (AP) - (SDAPsBlock in Figure 90). Each line in this block consists of a SD name, followed by its AP type and a set of parameters specific to that AP type. For example, SD1 has a periodic arrival pattern. The period and deviation
209 values of this periodic arrival pattern are 4 and 2 units of time. Note that units for all time values in an input file are assumed to be the same, and hence they are not specified. It is up to a user to interpret the unit of time. If the AP of a SD is bounded, the minimum and maximum inter-arrival time (minIAT, maxIAT) are specified. In case when a SD has no arrival pattern (no_arrival_pattern keyword), or it is bursty or unbounded, no additional parameters need to be specified. This is because such APs do not impose any timing constraints in our stress test requirement generation technique. Refer to Sections 10.2 and 10.5 for further details. The next block in an input file is the DCCFPsBlock. The number of DCCFPs in a DCCFPsBlock, is equal to the sum of DCCFPs of all SDs, specified in the SDsBlock. For example, in the example input file in Figure 91, this total is equal to: 5 (SD0) + 3 (SD1) + 2 (SD2) + 1 (SD3) + 4 (SD4)=15. All 15 DCCFPs have been listed, each following by its DTUP (Distributed Traffic Usage Pattern). The format for specifying DTUP of a DCCFP is described next. As discussed in Section 8.5, the DTUP of a DCCFP (with a fixed traffic location, direction and type) is a 2D function where the Y-axis is the traffic value and the X-axis is time. The non-zero values of a DTUP are specified in an input file. Each such value is specified by a pair consisting of the corresponding time and traffic values, and is referred to as a DTUPP (Distributed Traffic Usage Pattern Point). For example, DTUPPs of the DTUP in Figure 92 are: (1, 90), (3, 40), (4, 40), (8, 30), and (12, 50). For example, in the input file in Figure 91, p41 has two DTUPPs: (4, 20) and (7, 4). The “,” symbol between time and traffic values is eliminated in the input file to ease the parsing process.
210 2 ISDS0 3 SD0 SD1 SD2 ISDS1 4 SD0 SD2 SD3 SD4 5 SD0 1 5 p01 p02 p03 p04 p05 SD1 1 3 p11 p12 p13 SD2 1 2 p21 p22 SD3 1 1 p31 SD4 1 4 p41 p42 p43 p44 SD0 periodic 5 0 SD1 periodic 4 2 SD2 bounded 4 5 SD3 no_arrival_pattern SD4 irregular 5 2 3 6 8 9 p01 5 ( 2 10 ) ( 3 5 ) ( 6 7 ) ( 12 20 ) ( 15 9 ) p02 2 ( 1 5 ) ( 4 20 ) p03 3 ( 3 5 ) ( 5 10 ) ( 6 7 ) p04 2 ( 3 9 ) ( 6 35 ) p05 1 ( 5 40 ) p11 2 ( 4 4 ) ( 7 3.4 ) p12 3 ( 1 1 ) ( 2 9 ) ( 5 6 ) p13 5 ( 2 3 ) ( 5 4 ) ( 7 1 ) ( 9 6 ) ( 11 20 ) p21 1 ( 4 30 ) p22 4 ( 2 20 ) ( 3 10 ) ( 7 15 ) ( 9 30 ) p31 3 ( 3 3 ) ( 5 9 ) ( 7 20 ) p41 2 ( 4 20 ) ( 7 4 ) p42 6 ( 2 3 ) ( 5 6 ) ( 8 8 ) ( 10 1 ) ( 12 9 ) ( 15 10 ) p43 5 ( 4 2 ) ( 6 7 ) ( 10 5 ) ( 12 3 ) ( 15 2 ) p44 2 ( 4 32 ) ( 6 10 ) 25
Figure 91-An example input file of GARUS. NetInsDT(p,Network,t)
KB
100 90 40 40 0
1
2
3
4
30 5
6
7 8 t (ms)
50 9 10 11 12 13 14
Figure 92-An example DTUP of a DCCFP. The last piece of information in the input file is a Real value, referred to as GAMaxSearchTime (Section 10.7.4). This value (in time units) specifies the range (from zero) in which the GA tries to search for a best result. The initialization and the mutation operators use this maximum search value to select a random start time for the DCCFP of
211 a gene. For example, the GAMaxSearchTime in the input file in Figure 91 is 25 time units. Therefore, the GA operators in GARUS will choose random seeding times for DCCFPs in the range of [0…25] time units. The higher the GAMaxSearchTime value, the more broad the GA’s search range. However, we expect that higher GAMaxSearchTime values deteriorates our GA’s performance in converging, since the higher the GATimeSearchRange value, the less probable that multiple DCCFPs overlap with each other. A suitable GAMaxSearchTime can be calculated using the two heuristics we presented in Section 10.7.4. However, to allow variability of choices for GAMaxSearchTime in our experimentation, we assume that such a time instant has been calculated by a tester and is given in the input file. 11.2.4 Output File Format GARUS exports the stress test requirements to an output file, whose name is specified in the command line. If no output file name is given by the user, the output is simply printed on the screen. Furthermore, the output file also contains standard GAlib statistics, including the numbers of selections, crossovers, mutations, replacements and genome evaluations since initialization, as well as min, max, mean, and standard deviation of each generation. The main output is the stress test requirements, while GA statistics are just informative values for debugging purposes. The format of stress test requirements in an output file is shown in Figure 93-(a). An example set of stress test requirements is presented in Figure 93-(b), which is generated by GARUS for the input file in Figure 91.
212 SD −−−−−−−
DCCFP −−−−−−−−−−−−−−
start time −−−−−−
SDName1 SelectedDCCFPName1 startTime1 K K K SDNamenSDs SelectedDCCFPNamenSDs startTimenSDs
SD ---SD0 SD1 SD2 SD3 SD4
DCCFP ---p04 p12 p21 none none
ISTOF = a float value Max. stress time = an integer value
ISTOF=74 Max stress time=16
(a)
start time ---------10 14 12
A stress test schedule
(b)
Figure 93-(a): Stress test requirements format in GARUS output file. (b): An example. The first block of the output file is a stress test schedule which, if executed, entails maximum traffic. Each line in the first block of the output file corresponds to a SD of the SUT, and specifies a selected DCCFP with a start time to trigger. For example, Figure 93-(b) indicates that p04 of SD0, p12 of SD1, and p21 of SD2 should be triggered at start times 10, 14 and 12 unit of time, respectively. No DCCFP has been specified to be triggered for SD3 and SD4. This is because a set of stress test requirements corresponds to an ISDS in a SUT, and as shown in Figure 91, the SUT we used for these results has two ISDSs and SD0, SD1 and SD2 are members of one of them. In other words, triggering all SDs SD0 …SD4 is not allowed in this SUT. Note that GARUS never schedules a DCCFP in a start time which is not allowed according to SDs’ arrival patterns. 11.3 Validation of Test Requirements Generated by GARUS Along with a stress test requirement, GARUS also generates a maximum traffic value and a maximum traffic time. The maximum traffic value is in fact the objective function value of the GA’s best individual at the completion of the evolution process. The
213 objective function was described in Section 10.7.4, and was referred to as Instant Stress Test Objective Function (ISTOF). The maximum traffic time is the time instant when the maximum traffic happens. For example the ISTOF value and maximum traffic time for the SUT specified by the input file in Figure 91 are 74 (unit of traffic, e.g. KB) and 16 (unit of time, e.g. ms), respectively. Test requirements generated by GARUS can be validated according to at least six criteria: 1. Satisfaction of ATSs by start times of DCCFPs in the generated stress test requirements (Section 11.3.1): As explained in Section 10.7, each chromosome (including the final best chromosome) should satisfy this constraint, i.e., the start times of each DCCFP in the final best chromosome of the GA should be inside the Accepted Time Set (ATS) of its corresponding SD. 2. Checking ISTOF values (Section 11.3.2): As a heuristic, GAs do not guarantee to yield optimum results, and checking that the ISTOF value of the final best chromosome is the maximum possible traffic value among all interleavings is a NP-hard problem. It is, therefore, not possible to fully check how optimal GA results are. However, simple checks can be done to determine if, for example, GARUS has been able to choose the DCCFP with maximum traffic value among all DCCFPs in a SD. 3. Repeatability of GA results across multiple runs (Section 11.3.3): It is important to assess how stable and reliable the results of the GA will be. To do so, the GA is executed a large number of times and we assess the variability of the average or best chromosome’s fitness value.
214 4. Convergence efficiency across generations towards a maximum (Section 11.3.4): In order to assess the design of the selected mutation and cross-over operators, as well as the chosen chromosome representation, it is useful to look at the speed of convergence towards a maximum fitness plateau [101]. This can be measured, for example, in terms of number of generations required to reach the plateau. This can be easily computed as, for each generation, GAlib statistics provide min, max, mean, and standard deviation values. 5. Impacts of variations in test model size (scalability of the GA) - (Section 11.3.6): Assessing how The GA performance and its repeatability are affected with different test model sizes. 6. Impacts of variations in parameters other than test model size - (Sections 11.3.711.3.9): Assessing how the GA performance and its repeatability are affected when it is applied to different test models with different properties. In the current work, we investigate the impacts of variations in arrival pattern types (Section 11.3.7), arrival pattern parameters (such as periodic arrival pattern period and deviation, and bounded arrival pattern minimum and maximum inter-arrival time values) (Section 11.3.8), and GA maximum search time (Section 11.3.9) on the GA results and on its repeatability aspect, respectively. Using the above six criteria, we analyze the stress test requirements generated by running GARUS on a set of experimental test models, which were designed to test the repeatability and scalability aspects of our GA. We discuss in Section 11.3.5 how we designed the set of the experimental test models, which will be used in the rest of this chapter as a test-bed for our experiments and validations.
215 11.3.1 Satisfaction of ATSs by Start Times of DCCFPs in the Generated Stress Test Requirements We check whether the start times of the DCCFPs in the generated stress test requirements satisfy the ATSs of the corresponding SDs. In order to investigate this, we first derive the ATSs of the SDs in the test model corresponding to the input file in Figure 91. Consistent with discussions in Section 10.3, they are shown in Figure 94. p01 SD0
... 0
1
2
3
4
5
6
7
8
Legend
time ATS of a SD
9 10 11 12 13 14 15 16 17 18 19 20 21 22 23 24 25 26 27 28 29 30
Execution of a DCCFP SD1 0
1
2
3
4
5
6
7
8
...
time
...
time
...
time
DCCFPName
9 10 11 12 13 14 15 16 17 18 19 20 21 22 23 24 25 26 27 28 29 30 p21
SD2 0
1
2
3
4
5
6
7
8
9 10 11 12 13 14 15 16 17 18 19 20 21 22 23 24 25 26 27 28 29 30
p31 SD3 0
1
2
3
4
5
6
7
8
9 10 11 12 13 14 15 16 17 18 19 20 21 22 23 24 25 26 27 28 29 30
p44 SD4
time 0
1
2
3
4
5
6
7
8
9 10 11 12 13 14 15 16 17 18 19 20 21 22 23 24 25 26 27 28 29 30 maximum instant traffic
Figure 94-ATSs of the SDs in the TM in Figure 91, and a stress test schedule generated by GARUS. For example, as SD0 has a periodic AP with period value=5 and zero deviation, its ATS comprises time instants 5, 10, 15 and so on. Since SD3 has no AP, therefore its ATS includes all the time instants from zero to infinity. As an example, the stress test schedule generated by run number 2 in Table 10 has been depicted in Figure 94. This stress test schedule includes p01 from SD0, no DCCFPs from SD1, p21 from SD2, p31 from SD3, and p44 from SD4 to be triggered on time instants 10, 8, 5, and 8, respectively. The time
216 instant when the maximum traffic occurs (time=12) is depicted with a vertical bold line. The ISTOF value at this time is 92 units of network traffic. As it can be seen in Figure 94, the start times of all selected DCCFPs in the stress test schedule reside in the ATSs of the respective SDs. This is explained by the way the initial population of chromosomes is created (Section 10.7.3) and the allowability property of our mutation operator (Section 10.7.6.2). The start time of each DCCFP is always chosen from the ATS of its corresponding SD. This is achieved by building the ATS of each SD according to its type of AP when GARUS initializes a test model. Then, when a random start time is to be chosen for a DCCFP, method getARandomArrivalTime(), which is associated with a SD is invoked on an object from a subclass of the abstract class AP. Refer to Figure 88 for details. 11.3.2 Checking the extent to which ISTOF is maximized As a test to check if GARUS is able to choose the DCCFP with maximum traffic value among all DCCFPs of a SD, we artificially modify DTUPs of the DCCFPs in the test model of Figure 91 such that one DCCFP of each SD gets a much higher peak value in its DTUP. The modified values are shown in bold in Figure 95. For example, the DTUP value of p03 at time=5 was 10, whereas its new value is 500. This value is an order of magnitude larger than all other DTUP values of other DCCFPs in SD0. We then run GARUS with this modified TM for a large number of times and see if the DCCFPs with high DTUP values are part of the output stress test schedule generated by GARUS.
217 We executed GARUS 10 times with this TM, and the 10 schedules generated by GARUS had the format described in Table 8, where x stands for values which changed across different runs. As expected, DCCFPs p21, p31, and p42 were present in all 10 stress test schedules, thus suggesting that GARUS selects the correct DCFFPs. On the other hand, different DCCFPs from SD0 were reported in the output schedules. This can be explained as SD0’s ATS contains specific time points (5, 10, 15, and so on) and p03 (the modified DCCFP) will therefore not be able to have an effect on the maximum possible instant traffic (at time=16 or 17) since its modified DTUP point is at time=5. --DCCFPs p01 5 ( 2 p02 2 ( 1 p03 3 ( 3 p04 2 ( 3 p05 1 ( 5 p11 2 ( 4 p12 3 ( 1 p13 5 ( 2 p21 1 ( 4 p22 4 ( 2 p31 3 ( 3 p41 2 ( 4 p42 6 ( 2 p43 5 ( 4 p44 2 ( 4
10 ) ( 5 )( 4 5 )( 5 9 )( 6 40 ) 4 )( 7 1 )( 2 3 )( 5 300 ) 20 ) ( 3 )( 5 20 ) ( 3 )( 5 2 )( 6 32 ) (
3 5 ) ( 6 7 ) ( 12 20 ) ( 15 9 ) 20 ) 500 ) ( 6 7 ) 35 ) 3.4 ) 900 ) ( 5 6 ) 4 ) ( 7 1 ) ( 9 6 ) ( 11 20 ) 3 9 7 6 7 6
10 ) ( 7 15 ) ( 9 30 ) ) ( 7 700 ) 4 ) ) ( 8 800 ) ( 10 1 ) ( 12 9 ) ( 15 10 ) ) ( 10 5 ) ( 12 3 ) ( 15 2 ) 10 )
Figure 95-Modified DCCFPs of the test model in Figure 91. SD DCCFP Start Time SD0 x x SD1 none SD2 p21 x SD3 p31 x SD4 p42 x ISTOF=1500 or 1520 Max stress time=16 or 17
Table 8-Output format of 10 schedules generated by GARUS.
218 The reason why p12 (from SD1) is not selected in any of the outputs across different runs is that a set of DCCFPs are generated by GARUS as a stress test schedule only if the SDs corresponding to the DCCFPs belong to one ISDS. The set of SDs {SD0, SD1, SD2, SD3, SD4} does not belong to an ISDS. Furthermore, among all ISDSs (ISDS0={SD0, SD1, SD2} and ISDS1={SD0, SD2, SD3, SD4}) of the test model, the maximum instant traffic of ISDS1 has a larger value than that of ISDS0, thus not letting SD1 (and all of its DCCFPs) play a role in the output stress test schedules. 11.3.3 Repeatability of GA Results across Multiple Runs Since GAs are heuristics, their performance and outputs can vary across multiple runs. We refer to such a GA property as repeatability of GA results. This property is investigated by analyzing maximum ISTOF values as they are the fitness values of chromosomes in our GA. We furthermore analyze maximum stress time values as such a time value denotes the time instant when a stress situation actually occurs. Figure 96-(a) depicts the distributions of maximum ISTOF and stress time values for 1000 runs of test model corresponding to the input file in Figure 91. From the ISTOF distribution, we can see that the maximum fitness values for most of the runs are between 60 and 72 units of traffic. Descriptive statistics of the fitness values are shown in Table 9. Average and median values are very close, thus indicating that the distribution is almost symmetric.
Min
Max
Average
Median
Standard Deviation
50
92
66.672
65
6.4
Table 9-Descriptive statistics of the maximum ISTOF values over 1000 runs. Values are in units of data traffic (e.g. KB).
219 ISTOF
Max stress time
ISTOF
Max stress time 60
90
90 50
50
80
80 40
70
40
70
30
30
20
60
60
10
50
20
10
50
(a)
(b)
Figure 96-(a): Histogram of maximum ISTOF and stress time values for 1000 runs of test model corresponding to the input file in Figure 91. (b): Corresponding max stress time values for one of the frequent maximum ISTOF values (72 units of traffic). Such a variation in fitness values across runs is expected when using genetic algorithms on complex optimization problems. However, though the variation above is not negligible, one would expect based on Figure 96-(a) that with a few runs a chromosome with a fitness value close to the maximum would likely be identified. Since each run lasts a few seconds, perhaps a few minutes for very large examples, relying on multiple runs to generate a stress test requirement should not be a practical problem. Corresponding portions of max stress time values for the most frequent maximum ISTOF value (72 units of traffic) have been highlighted in black in Figure 96-(b). As we can see, these maximum stress time values are scattered across the time scale (e.g., from 10 to 60 units of time). This highlights that a single ISTOF value (maximum stress traffic) can happen in different time instants, thus suggesting the search landscape for the GA is
220 rather complex for this type of problem. Thus, a strategy to further explore would be for testing to cover all (or a subset of) such test requirements with maximum ISTOF values in different time instants. Indeed, although their ISTOF value are the same, a SUT’s reaction to different test requirements might vary, since a different DCCFP (and hence set of messages) in a different stress time instant may be triggered. This might in turn lead to uncovering different RT faults in the SUT. 11.3.4 Convergence Efficiency across Generations Another interesting property of the GA is the number of generations required to reach a stable maximum fitness plateau. The distribution of these generation numbers over 1000 runs of test model corresponding to the input file in Figure 91 is shown in Figure 97, where the x-axis is the generation number and the y-axis is the probability of achieving such plateau in a generation number. The minimum, maximum and average values are 20, 91, and 52, respectively. Therefore, we can state that, on the average, 52 generations of the GA are required to converge to the final result (stress test requirement). The variation around this average is limited and no more 100 generations will be required. This number is in line with the experiments reported in the GA literature [87] but is however likely to be dependent on the number and complexity of SDs as well as their ATSs.
221
Probability of acheiving a maximum fitness plateau
0.06 0.05 0.04 0.03 0.02 0.01 0 20
31
41
51
61
71
89
Ge ne ration num be r
Figure 97-Histogram of the generation numbers when a stable maximum fitness plateau is reached in 1000 runs of the test model corresponding to the input file in Figure 91 by GARUS. From the initial to the final populations in the test model corresponding to the input file in Figure 91, the maximum fitness values typically increase by about 80%, which can be considered a large improvement. So, though we cannot guarantee that a GA found the global maximum, we clearly generate test requirements that will significantly stress the system. The variability in the objective function and start times as well as detailed information for the first five runs of the test model corresponding to the input file in Figure 91 are reported in Table 10. We can clearly see from the table that in a single run when the generation number increases, the population converges (i.e. deviation value decreases).
222 For example, in the outputs reports in Table 10, the value of the deviation10 column decreases continuously from 8.95 at generation #0 to 0.00 in generation #80. Also notice the convergence of minimum and mean values towards the maximum (ISTOF) values when the generation number increases.
Run #
Generation #
Mean
Max (ISTOF)
Min
Deviation
Best individual
1
0
36.74
55
30
8.95
SD
DCCFP
start time
10
44.47
58
38
7.04
----
----
----------
20
52.46
61
41
6.44
SD0
p05
25
30
61.14
66
55
5.86
SD1
none
40
67.23
71
61
4.90
SD2
p22
21
50
71.43
79
70
4.21
SD3
p31
23
60
74.62
85
70
3.01
SD4
p42
2
70
82.03
88
72
2.95
80
90.00
90
90
0.00
ISTOF=90
90
90.00
90
90
0.00
Max stress time=30
100
90.00
90
90
0.00
0
36.45
58
30
8.82
SD
DCCFP
start time
10
43.84
60
36
7.13
----
----
----------
20
51.23
65
41
6.97
SD0
p01
10
30
57.82
66
50
5.45
SD1
none
40
64.70
73
59
5.27
SD2
p21
8
50
72.52
76
62
5.04
SD3
p31
5
60
80.50
82
80
3.39
SD4
p44
8
70
81.34
84
80
3.78
80
83.78
86
80
2.58
ISTOF=92
90
91.64
92
80
2.05
Max stress time=12
100
92.00
92
92
0.00
2
10
Deviation of a population in GAlib is defined as the standard deviation of individuals'
objective scores [87] R. L. Haupt and S. E. Haupt, Practical Genetic Algorithms: WileyInterscience, 1998..
223 3
4
5
0
36.93
49
30
7.98
SD
DCCFP
start time
10
45.36
50
39
7.94
----
----
----------
20
54.05
58
44
7.63
SD0
p04
15
30
62.35
68
52
6.93
SD1
none
40
70.01
72
65
3.46
SD2
p22
19
50
73.63
74
72
1.49
SD3
p31
14
60
75.00
75
75
0.00
SD4
p44
9
70
75.00
75
75
0.00
80
75.00
75
75
0.00
ISTOF=75
90
75.00
75
75
0.00
Max stress time=21
100
75.00
75
75
0.00
0
37.03
53
30
8.94
SD
DCCFP
start time
10
45.37
58
37
8.14
----
----
----------
20
55.14
60
43
7.21
SD0
p05
15
30
66.63
69
52
7.08
SD1
none
40
73.29
78
70
6.22
SD2
p22
18
50
79.02
80
72
2.62
SD3
p31
13
60
80.00
80
80
0.00
SD4
p43
9
70
80.00
80
80
0.00
80
80.00
80
80
0.00
ISTOF=80
90
80.00
80
80
0.00
Max stress time=20
100
80.00
80
80
0.00
0
37.54
55
30
8.44
SD
DCCFP
start time
10
45.60
58
39
7.50
----
----
----------
20
54.09
64
48
6.93
SD0
p05
5
30
61.67
66
52
6.32
SD1
none
40
68.42
69
65
2.52
SD2
p21
12
50
70.37
71
70
0.78
SD3
p31
11
60
71.14
72
70
0.99
SD4
p44
6
70
72.00
72
72
0.00
80
72.00
72
72
0.00
ISTOF=72
90
72.00
72
72
0.00
Max stress time=10
100
72.00
72
72
0.00
Table 10-Summary of GARUS results for five runs.
224 11.3.5 Our Strategy for Investigating Variability/Scalability To assess and validate test requirements generated by GARUS, we design a set of different test models (referred to as experimental test models), and execute GARUS with each of them as input. Note that these test models are in the input file format, described in Section 11.2.3.
To ensure variability in the experimental test models, a set of
experimental test models were designed based on the following criteria: •
Test models with variations in test model sizes (Section 11.3.5.3)
•
Test models with variations in SD arrival patterns (Section 11.3.5.4)
•
Test models with variations in the GA’s maximum search time (Section 11.3.5.5)
Since most of the input files containing the test models are large in size, we do not list them in this article. As an example, the contents of one input file corresponding to one of the test model in this section are shown in Appendix B. We discuss next a set of variability parameters, we used in our experiments to incorporate variability in different test models based on the above criteria. 11.3.5.1 Variability Parameters The variability parameters used in our experiments are listed in Table 11, along with their explanations. The parameters are grouped into three groups corresponding to the above three criteria: (1) Test model size, (2) SD arrival patterns, and (3) Maximum search time. We have defined eight parameters under the group of ‘test model size’ to incorporate variability in different sizes perspectives in experimental TMs. Each parameters in this group correspond to a sizes perspective, e.g., number of ISDSs, number of SDs, and
225 minimum number of DCCFPs per SD. For example, a large TM might have many ISDSs (by setting large values for nISDSs), while another large TM can have many DCCFPs per SD (by setting large values for minnDCCFPs and maxnDCCFPs). Parameter Group
Test model size
SD arrival patterns (all parameter values are in time units, except minnAPirregularPoints and maxnAPirregularPoints)
Maximum search time
Parameter
Parameter Explanation
nISDSs
# of ISDSs
nSDs
# of SDs in TM
minISDSsize
min. # of SDs per ISDS
maxISDSsize
max. # of SDs per ISDS
minnDCCFPs
min. # of DCCFPs per SD
maxnDCCFPs
max. # of DCCFPs per SD
minnDTUPPs
min. # of DTUPPs per DCCFP
maxnDTUPPs
min. # of DTUPPs per DCCFP
APtype
type of AP
minAPperiodicPeriod
min. period value
maxAPperiodicPeriod
max. period value
minAPperiodicDeviation
min. deviation value
maxAPperiodicDeviation
max. deviation value
minAPboundedMinIAT
min. value for min. inter-arrival time
maxAPboundedMinIAT
max. value for min. inter-arrival time
minAPboundedMaxIATafterMin
min. distance between maxIAT and minIAT
maxAPboundedMaxIATafterMin
max. distance between maxIAT and minIAT
minnAPirregularPoints
min. # for irregular points
maxnAPirregularPoints
max. # for irregular points
minAPirregularPointsValue
min. time value for irregular points
maxAPirregularPointsValue
max. time value for irregular points
MaximumSearchTime
GA maximum search time
Table 11- Variability parameters for experimental test models. Parameters prefixed with min and max serve as statistical means, which enable us to incorporate statistically-controlled randomness into the sizes of our experimental TMs. For example, we can control the minimum and maximum number of DCCFPs per SD in a TM by minnDCCFPs and maxnDCCFPs parameters. Such a statistical range for number of SDs per ISDSs, DCCFPs per SD, and DTUPPs per DCCFP also conforms to real-
226 world models, where for example, there are not variant number of DCCFPs per SDs in a TM. Our experimental TMs with variations in TM sizes based on the variability parameters are presented in Section 11.3.5.3. The second group of the variability parameters (SD arrival patterns) is designed to incorporate variability in different SD arrival pattern properties of our experimental TMs. All parameter values in this group are in time units, except minnAPirregularPoints and maxnAPirregularPoints. The first parameter in this group (APtype) determines the type of APs to be assigned for the SD of an experimental TM. APtype is of type enumeration with possible values of: •
no_arrival_pattern: All SDs of the TM will have no APs, i.e., any arrival time in test schedules is accepted for all SDs.
•
periodic: All SDs of the TM will have periodic APs. Each AP’s parameters are set to the four *APperiodic* variability parameters.
•
bounded: All SDs of the TM will have bounded APs. Each AP’s parameters are set to the four *APbounded* variability parameters.
•
irregular: All SDs of the TM will have irregular APs. Each AP’s parameters are set to the four *APirregular* variability parameters.
•
mixed: Different SDs of a TM have different arrival patterns. The type of AP for a SD is chosen from (no_arrival_pattern, periodic, bounded, or irregular) with equal probabilities
Parameters with APperiodic, APbounded and APirregular substring are specific to periodic, bounded and irregular APs, respectively, and specify the range of values to be
227 set for specific parameters of these AP. For example, minAPperiodicPeriod, maxAPperiodicPeriod, minAPperiodicDeviation, and maxAPperiodicDeviation specify min./max. period values, and min./max. deviation values for periodic APs of SDs. If they are set to 5ms, 10 ms, 2ms, and 3ms respectively, the following APs might be generated in an experimental TMs: (‘periodic’, (6, ms), (2, ms)), (‘periodic’, (8, ms), (3, ms)), (‘periodic’, (10, ms), (3, ms)), and (‘periodic’, (6, ms), (3, ms)). Our experimental TMs with variations in SD arrival patterns time based on the parameters in the second group are presented in Section 11.3.5.4. The third group of the variability parameters (maximum search time) has only one parameter (MaximumSearchTime) which is designed to incorporate variability in GA maximum search time (Section 10.7.4) of our experimental TMs. Our experimental TMs with variations in maximum search time based on the MaximumSearchTime parameters are presented in Section 11.3.5.5. 11.3.5.2 Random Test Model Generator To facilitate the generation of experimental TMs based on the variability parameters (Section 11.3.5.1), we developed a random test model generator (RandTMGen) in C++. A simplified activity diagram of RandTMGen is shown in Figure 98, where the value for variability parameters are provided as input, and an experimental TM is generated (in input file format of Figure 90).
228 Random Test Model Generator (RandTMGen)
Values for variability parameters
Generate a random test model based on the values for variability parameters (uniform distribution is used.)
A random test model (in input file format)
Figure 98-Simplified activity diagram of our random test model generator. For the pair of parameters specifying min./max. of a feature, e.g. minnDCCFPs and maxnDCCFPs, RandTMGen uses uniform distribution to generate a value in the range of [minnDCCFPs, maxnDCCFPs]. This is a design decision, which can be modified easily, i.e., any other distribution can be used to generate a random value in [minnDCCFPs, maxnDCCFPs]. As an example on how RandTMGen generate a random value in a range, assume minnDCCFPs=3 and maxnDCCFPs=8. In such a case, all the integer values in the range of [3, 8] are chosen by an equal probability to be set for the number of DCCFPs per a SD in a TM. In the following three subsections, we describe the parameters provided to RandTMGen to generate a set of experimental test models to ensure variability in test models as well as the scalability of GARUS. 11.3.5.3 Test Models with Variations in Sizes In order to investigate the performance and size scalability of our GA (implemented in GARUS), six test models with different sizes were generated using RandTMGen as reported in Table 12. The SDs of the each of the above test models were assigned arbitrary (mixed) arrival patterns (no_arrival_pattern, periodic, bounded, or irregular) with equal probabilities.
229 Depending on the selected arrival pattern type for a SD, the AP variability parameters were set as follows.
230
Test Models
tm1
tm2
tm3
tm4
tm5
tm6
(small)
(many ISDSs)
(many SDs in TM)
(many SDs per ISDS)
(many DCCFPs per SD)
(many DTUPs per DCCFP)
Figure 91
Parameters
nISDSs
2
100
10
10
10
2
nSDs
5
50
200
50
10
5
minISDSsize
3
2
2
20
2
2
maxISDSsize
4
5
5
30
5
5
minnDCCFPs
1
1
2
1
10
1
maxnDCCFPs
5
3
5
3
50
5
minnDTUPPs
2
1
1
1
1
50
maxnDTUPPs
6
10
10
10
10
100
Table 12-Experimental test models with different sizes. •
•
Periodic arrival pattern
minAPperiodicPeriod=5
maxAPperiodicPeriod=10
minAPperiodicDeviation=0
maxAPperiodicDeviation=3
Bounded arrival pattern
minAPboundedMinIAT=2
maxAPboundedMinIAT=4
minAPboundedMaxIATafterMin=2
maxAPboundedMaxIATafterMin=5
231 •
Irregular arrival pattern
minnAPirregularPoints=5
maxnAPirregularPoints=15
minAPirregularPointsValue=1
maxAPirregularPointsValue=30
Note that the above value for the AP variability parameters are chosen to be typical values, as our main intention in designing TMs tm1,…, tm6 is to experiment our GA’s behavior and scalability aspect with reaction to different TM sizes. 11.3.5.4 Test Models with Variations in SD Arrival Patterns To investigate the effect of variations in SD arrival patterns in generated test requirements by GARUS, 12 test models were generated using RandTMGen based on two variation strategies as reported in Table 13. The two AP-related variation strategies we followed when generating TMs in this section were: 1. Different-AP-Types: Comparing generated test requirements for TMs with different AP types 2. Same-AP-Different-Parameters: Comparing generated test requirements for TMs with a same AP type, but different AP variability parameters (e.g. maxAPperiodicPeriod, maxAPboundedMinIAT and minnAPirregularPoints). A dash “-“ in a cell of Table 13 indicates that the parameter (corresponding to the cell) does not apply to the corresponding TM. For example, all SDs in tm8 are supposed to be periodic. Therefore, only periodic AP parameters apply to this TM. The following TMsize parameters were used for the test models in Table 13.
232
AP-related variation strategies Different-AP-Types
Same-AP-Different-Parameters
Test Models tm7
tm8
tm9
tm10
tm11
tm12
tm13
tm14
tm15
tm16
tm17
tm18
no_arrival_pattern
periodic
bounded
irregular
mixed
periodic
periodic
periodic
bounded
bounded
irregular
irregular
-
5
-
-
5
5
5
20
-
-
-
-
Parameters
APtype
minAPperiodicPeriod maxAPperiodicPeriod
-
10
-
-
10
5
5
25
-
-
-
-
minAPperiodicDeviation
-
0
-
-
0
1
5
1
-
-
-
-
maxAPperiodicDeviation
-
3
-
-
3
5
5
2
-
-
-
-
minAPboundedMinIAT
-
-
2
-
2
-
-
-
50
2
-
-
maxAPboundedMinIAT
-
-
4
-
4
-
-
-
60
4
-
-
minAPboundedMaxIATafterMin
-
-
2
-
2
-
-
-
2
60
-
-
maxAPboundedMaxIATafterMin
-
-
5
-
5
-
-
-
5
70
-
-
minnAPirregularPoints
-
-
-
5
5
-
-
-
-
-
50
5
maxnAPirregularPoints
-
-
-
15
15
-
-
-
-
-
100
15
minAPirregularPointsValue
-
-
-
1
1
-
-
-
-
-
1
100
maxAPirregularPointsValue
-
-
-
30
30
-
-
-
-
-
30
200
Table 13-Experimental test models with variations in SD arrival patterns. As these parameters denote, the size of TMs tm7, …, tm18 have been chosen to be relatively medium (a typical setting) as our main intention in designing these TMs is to experiment our GA’s behavior and output results with reaction to variations in SD arrival patterns.
nISDSs=10
233
minISDSsize=5
maxISDSsize=10
nSDs=20
minnDCCFPs=2
maxnDCCFPs=5
minnDTUPPs=1
maxnDTUPPs=10
We discuss next our rationale of designing each TM based on the two above variation strategies (Different-APs and Same-AP-Different-Parameters).
Different-AP-Types: The four TMs tm7… tm11 are intended to investigate the impacts of variations in AP types on repeatability and convergence efficiency of the GA outputs. Each of these TMs have different criteria to assign APs to SDs, as discussed in Section 11.3.5.1.
Same-AP-Different-Parameters: Sets of two or more TMs where SDs in each TM have the same AP, but different AP parameters. For example, all SDs in tm12, tm13
and
tm14
have
minAPperiodicPeriod,
periodic
APs,
but
maxAPperiodicPeriod,
have
different
values
for
minAPperiodicDeviation
or
maxAPperiodicDeviation. tm15 and tm16 are our pair of experimental test models with bounded APs. TMs tm17 and tm18 have SDs with irregular APs. Such a variation strategy will enable us to study the impacts of variations in AP parameters on repeatability and convergence efficiency of the GA outputs.
234 11.3.5.5 Test Models with Variations in the GA Maximum Search Time To investigate the effect of variations in maximum search time (Section 10.7.4) on GARUS test requirements by GARUS, we created the following two test models using our random test model generator. As an example, the contents of the input file corresponding to tm20 is shown in Appendix B. •
tm19: SUT components (SDs, DCCFPs, ISDSs, etc.) are the same as tm1, but the MaximumSearchTime is 5 time units instead of 50 in tm1.
•
tm20: SUT components (SDs, DCCFPs, ISDSs, etc.) are the same as tm1, but the MaximumSearchTime is 150 time units instead of 50 in tm1.
11.3.6 Impacts of Test Model Size (Scalability of the GA) We investigate how the GA performance and its repeatability are affected when it is applied to test models with different sizes. We study scalability by analyzing the impact of variations in test model size on the following metrics:
Execution time
Repeatability of maximum ISTOF values
Repeatability of maximum stress time values
Convergence efficiency across generations
11.3.6.1 Impact on Execution Time To investigate the impact of test model size on the execution time of our GA, the average, minimum and maximum execution times over all the 1000 runs, by running GARUS with tm1…tm6 on an 863MHz Intel Pentium III processor with 512MB DRAM memory are
235 reported in Table 14. As we can see in the table, minimums and maximums of the statistics in Table 14 for each test model are relatively close to the corresponding average value. Therefore, we use the average values to discuss the impacts of test model size on execution time of our GA. To better illustrate the differences, the average values are depicted in Figure 99. Test Model
Min
Max
Average
tm1 (small)
46
125
58
62
11.34
743
1,150
1,089
375
44.79
1,015
2,219
1,240
1,171
199.10
tm4 (many SDs per ISDS)
734
1,641
809
782
97.61
tm5 (many DCCFPs per SD)
141
597
263
250
62.83
tm6 (many DTUPs per DCCFP)
734
1,375
820
797
74.74
tm2 (many ISDSs) tm3 (many SDs in TM)
Median
Standard Deviation
Table 14-Execution time statistics of 1000 runs of tm1…tm6. tm1
0
tm4
tm5
tm6
500
tm2
tm3
1000
1500
duration (ms)
Figure 99-Visualization of the average values in Table 14. Average duration of the GA run of test model tm1 (58 ms) is the smallest among all. This is expected since TM tm1 has the smallest size in terms of test model components (ISDSs, SDs, and DCFFPs). tm3 has the highest average execution time among the six TM runs. Durations of tm2, tm6, tm4, and tm5 are next in decreasing order. Based on the above order of execution values, we can make the following observations:
The execution time of the GA is strongly sensitive to an increase in number of SDs in a TM. The more SDs in a TM, the longer a single run of our GA takes
236 (e.g. tm3). This can be explained as the number of genes per chromosome in our GA is the same as the number of SDs in a TM. Thus, as the execution results indicate, the execution time of our GA sharply increases when the number of genes per chromosome increases. Such an increase impacts all functional components of the GA, the two operators (Section 10.7.6) and the fitness evaluator (Section 10.7.5).
As expected, the execution time of our GA is also highly dependent on the number of ISDSs (e.g. tm2). As the number of ISDSs increases, the size of initial population grows, and so does the number of the mutations and crossovers applied in each generation. The number of times the operators are applied is determined by the mutation and crossover rates and the size of initial population.
The execution time of our GA is also dependent on an increase in number of SDs per ISDS (e.g. tm4), as well as an increase in number of DTUPs per DCCFP (e.g. tm6). As the number of SDs per ISDS increases, the number of non-null genes per chromosome will increase. This will, in turn, lead to more mutations and crossovers and an increase in computation for the fitness evaluator. Similarly, an increase in number of DTUPs per DCCFP will lead to an increase in fitness computation time (Section 10.7.5).
The execution time of our GA is not as dependent on an increase in number of DCCFPs per SD (e.g. tm5), when compared to other TM components. This can be explained as there will not be any change in chromosome size, nor in the initial population in that case. Even the frequency of mutations and crossovers will not change. For example, as the mutation operator chooses a random DCCFP among
237 all DCCFPs of a SD, there will be no effect in terms of execution time if the number of DCCFPs per SD increases. The small difference between average durations of tm5 and tm1 in Figure 99 is due to the fact that tm5’s number of SDs is slightly more than that of tm1. 11.3.6.2 Impact on Repeatability of Maximum ISTOF Values To investigate the impact of test model size on the repeatability of maximum ISTOF values generated by our GA, Figure 100 depicts the histograms of maximum ISTOF values for 1000 runs on each of the test models tm1,…,tm6. The corresponding descriptive statistics are shown in Table 15. Average and median values of all distributions are very close, thus indicating that the distributions are almost symmetric. We can see from the ISTOF distributions that the maximum fitness values for most of tm1 runs, for example, are between 60 and 74 units of traffic. Referring to Figure 100, the variations in fitness values across runs is expected when using genetic algorithms on complex optimization problems. However, though the variation above is not negligible, one would expect based on Figure 100 that with a few runs, a chromosome with a fitness value close to the maximum would likely be identified. To discuss the practical implications of multiple runs of GARUS to get a sub-maximum result (stress test requirement) for tm1, we can perform an analysis by using the probability distributions of maximum ISTOF values in the histogram of Figure 100-(a). In the distributions of maximum ISTOF values for , as it can be easily seen in Figure 100(a), 1000 runs of GARUS has generated mainly three groups of outputs: values between 70 and 80 units of traffic (group70 in Figure 100-(a)), [60,70] and [50,60]. Obviously, the
238 goal of using GARUS is to find stress test requirements which have the highest possible ISTOF values. Thus, the strategy is to run GARUS for multiple times and choose a test requirement with the highest ISTOF value across all runs. The practical implication of multiple runs to achieve a test requirement with the highest ISTOF value is to predict the minimum number of times GARUS should be executed to yield an output with an ISTOF value in group70 in Figure 100-(a). By looking into the raw data of the distribution (a), we found out that 425 (of 1000) values in the histogram belong to group70. Thus, in a sample population of 1000 GARUS outputs, the probabilities that an output belongs to group70 is p(group70)=0.425. Thus, to predict the minimum number of times GARUS should be executed to yield an output with an ISTOF value in group70, we can use the following probability formula: p(a test requirement with an ISTOF value in group70 is yielded in a series of n runs of GARUS)= 1 − (1 − p( group70 ))
n −1
p( group70 ) = 1 − ( 0.575 )n−1( 0.425 )
The above probability function is depicted in Figure 101, for n=1…15. Figure 101-(b) depicts a zoom-out of the curve in Figure 101-(a) for n=0…40. For values of n higher than 15, the value of the above function is very close to 1, meaning that one can get a stress test requirement with a ISTOF value in the range [70, 80] in 15 runs. Since each run lasts a few seconds (Section 11.3.6.1), perhaps a few minutes for very large examples, relying on multiple runs to generate a stress test requirement should not be a practical problem.
239 90
300 280 270
80 300
group7
250
70
230 210
60 200
190
50
170
(a)-tm1 (small)
(b)- tm2 (many ISDSs)
(c)- tm3 (many SDs in TM) 500
500
300 400
400
200 300
(d)- tm4 (many SDs per
(e)- tm5 (many DCCFPs
(f)- tm6 (many DTUPs
ISDS)
per SD)
per DCCFP)
Figure 100-Histograms of maximum ISTOF values (y-axis) for 1000 runs of each test model. The y-axis values are in traffic units. Test Model
Min
Max
Average
Median
Standard Deviation
tm1 (small)
65
112
81.66
81
7.0
tm2 (many ISDSs)
171
367
255
260
36.9
tm3 (many SDs in TM)
171
306
220
217
25.2
tm4 (many SDs per ISDS)
299
502
364
360
32.9
tm5 (many DCCFPs per SD)
171
352
230
231
32.2
tm6 (many DTUPs per DCCFP)
333
494
404
406
36.8
Table 15-Descriptive statistics of the maximum ISTOF values for each test model over 1000 runs. Values are in units of data traffic.
240
Probability of at le ast one output in group_70
1 0.9 0.8 0.7 0.6 0.5 0
5
10
15
Numbe r of runs (n)
Figure 101- Probability of the event that at least one test requirement with an ISTOF value in group70 is yielded in a series of n runs of GARUS. We discuss two main observations based on the results shown in Figure 100.
In all of the histograms, despite the fact that the results correspond to 1000 runs of different test models which were designed to test the scalability and repeatability properties of our GA, the maximum ISTOF values of the outputs produced by the GA lie in rather small intervals. For example as shown in Figure 100-(f), the maximum ISTOF values generated for tm6 range in [330…500] units of traffic.
In terms of scalability, histograms in (b), (c), (d), (e), and (f) suggest that the GA can reach a maximum plateau when the size of a specific component (SD, ISDS, DCCFP, etc) of a given TM is very large.
11.3.6.3 Impact on Repeatability of Maximum Stress Time Values To investigate the impact of test model size on the repeatability of maximum stress time values generated by our GA, Figure 102 depicts the histograms of maximum stress time values for 1000 runs on each of test models tm1, …, tm6. The corresponding descriptive
241 statistics are shown in Table 16. We discuss four main observations based on the results shown in Figure 102.
Average and median values of distributions in (d), (e), and (f) are quite close, thus indicating that the distributions are almost symmetric. Conversely, distributions in (a), (b), and (c) are not symmetric. This reveals that for tm4 (d), tm5 (e), and tm6 (f), the GA might produce maximum stress time values with peak values only at some points. For tm1 (a), tm2 (b), and tm3 (c), the GA generated stress time values with low standard deviation. Furthermore, these distributions are skewed towards the minimums. Thus, one has to run the GA many number of times to get a value close to the maximums.
Distributions in (d) and (e) are quite flat. This can be explained as for tm4 (d) tm5 (e), the number of alternatives to yield a best chromosome by the GA is higher than the others. Furthermore, large sets of best chromosomes can yield different maximum stress time values due to the random start times selected from the legal start times of DCCFPs.
The standard deviation value for tm1 (a) is relatively smaller than the other distributions because of the smaller range of maximum ISTOF values in tm1 results.
The standard deviation of distribution (f), tm6, is much higher than the five others. This can be explained by the higher number of DTUPs per DCCFP (50-100) in tm6, compared to the other TMs (1-10). This will, in turn, result in a wider range in the time domain for the GA to search in and find best individuals. As it can be seen in Figure 102, the range of minimum and maximum values in distribution
242 (f), [87, 2128], is much larger than the other five distributions, which is also resulted from the aforementioned property of tm6.
50
600
600
500
500
40
400
400
30
300
300
200
200
100
100
0
0
20 10
(a)-tm1 (small)
(b)-tm2 (many ISDSs) (c)-tm3 (many SDs in TM)
700 600 600
2000
500
500
400
400
300
300 200
200
100
100
0
0
1000
0
(d)-tm4 (many SDs
(e)-tm5 (many
(f)- tm6 (many DTUPs
per ISDS)
DCCFPs per SD)
per DCCFP)
Figure 102-Histograms of maximum stress time values for 1000 runs of each test model. The y-axis values are in time units.
243
Test Model
Min
Max
Average
Median
Standard Deviation
tm1 (small)
6
56
22
20
12
tm2 (many ISDSs)
11
602
103
61
108.8
tm3 (many SDs in TM)
16
618
180
123
135.2
7
655
301
296
147.0
tm5 (many DCCFPs per SD)
19
626
298
289
149.0
tm6 (many DTUPs per DCCFP)
87
2128
937
933
373
tm4 (many SDs per ISDS)
Table 16-Descriptive statistics of the maximum stress time values for each test model over 1000 runs. Values are in time units. 11.3.6.4 Impact on Convergence Efficiency across Generations Another interesting property of the GA to look at is the number of generations required to reach a stable maximum fitness plateau. To investigate the impact of test model size on convergence efficiency across generations in the GA, Figure 103 depicts the histograms of the generation numbers required to reach a stable maximum fitness plateau over 1000 runs of test models tm1, …, tm6. The corresponding descriptive statistics are shown in Table 17. On the average, 49-50 generations of the GA were required to converge to the final result (a stress test requirement) for tm1, …, tm6. We therefore see that the TM size does not affect the convergence efficiency across generations in our GA. The variations around this average in different TMs are limited and no more 100 generations will be required. This number is in line with the experiments reported in the GA literature [87]. As we can see, test model size does not have an impact on
244 convergence efficiency across generations, and the GA is able to reach a stable maximum fitness plateau after about 50 generations on average, independent of test model size. 100
100
100
90
90
90
80
80
80
70
70
70
60
60
50
50
40
40
30
30
60 50 40 30
(a)- tm 1 (small)
20
(b)- tm 2 (many ISDSs)
(c)- tm 3 (many SDs in TM)
100
100
100
90
90
90
80
80
80
70 70
70
60
60
50
50
40
40
30
30
60 50 40
20
30
10
20
(d)- tm 4 (many SDs per (e)- tm 5 (many DCCFPs ISDS)
per SD)
(f)- tm 6 (many DTUPs per DCCFP)
Figure 103- Histograms of the generation numbers when a stable maximum fitness plateau is reached in 1000 runs of each test model.
245
Test Model
Min
Max
Average
Median
Standard Deviation
tm1 (small)
27
98
49
47
10.78
tm2 (many ISDSs)
28
96
50
49
10.44
tm3 (many SDs in TM)
23
97
50
49
10.84
tm4 (many SDs per ISDS)
25
98
49
49
10.63
tm5 (many DCCFPs per SD)
17
96
49
49
11.77
tm6 (many DTUPs per DCCFP)
27
98
50
48
10.74
Table 17-Minimum, maximum and average values of the generation numbers when a stable maximum fitness plateau is reached in 1000 runs of each test model. 11.3.7 Impacts of Arrival Pattern Types The impact of variations in arrival pattern types are investigated by running GARUS with test models tm7…tm11. The results are reported in the following four subsections.
Impact on Execution Time
Impact on Repeatability of Maximum ISTOF Values
Impact on Repeatability of Maximum Stress Time Values
Impact on Convergence Efficiency across Generations
11.3.7.1 Impact on Execution Time We computed the average, minimum and maximum execution times over all the 1000 runs, by running GARUS with test models tm7…tm11 on an 863MHz Intel Pentium III processor with 512MB DRAM memory (Table 18). Minimums and maximums of the statistics in Table 18 for each test model run are relatively close to the corresponding
246 average value. Therefore, we use the average values to discuss the impacts of variations in arrival patterns on execution time. To better illustrate the differences, the average values are depicted in Figure 104. Recall from Section 11.3.5.4 that test models tm7…tm11 have been designed such that they all have the same number of SDs, CCFPs, and DTUPPs (same TM size). Based on the values depicted in Figure 104, the average execution times of the test models tm7…tm11 with the same test model size, but different arrival patterns for SDs, are relatively close to each other (within 100 ms). This indicates that execution time is not strongly dependent on SD arrival patterns in a test model. Furthermore, as we discuss below, the difference in execution times are mainly due to the implementation details of a method of class AP in GARUS.
Test Model
Min
Max
Average
Median
Standard Deviation
tm7 (all SDs with no arrival patterns)
234
593
296
281
51.27
tm8 (all SDs with periodic arrival patterns)
234
625
290
266
50.47
tm9 (all SDs with bounded arrival patterns)
250
594
295
281
53.78
tm10 (all SDs with irregular arrival patterns)
156
344
186
172
29.12
tm11 (SDs with arbitrary arrival patterns)
217
245
231
224
61.23
Table 18-Execution time statistics of 1000 runs of tm7…tm11. tm7
0
tm10
tm11
tm8
tm9
500 duration (ms)
Figure 104-Visualization of the average values in Table 18.
247 The execution times of two of these test models (tm8 and tm9), are slightly higher than those of tm7 and tm10. The difference between the two TM groups (tm8 and tm9 versus tm7 and tm10) can be explained by an implementation detail of GARUS. Function getARandomArrivalTime, a member function of class AP (Figure 88), is overridden in each of AP’s subclasses. The time complexity of this function in noAP and irregularAP classes is O(1), i.e., choosing a random value from a range or an array, respectively. However, the implementation of the function in periodicAP and boundedAP classes required some extra considerations (related to the ATSs of periodic and bounded APs), and thus the time complexities of the function are not constant anymore, but dependent on the specific arrival pattern parameters. The execution time of tm11, in which each SD can have an arbitrary arrival pattern, is placed somehow close to the average value of the other four TMs (tm7, tm8, tm9, and tm10). This is as predicted since the APs of SDs in tm11 are a mix of APs in the other four, thus leading to such an impact in its average execution time. 11.3.7.2 Impact on Repeatability of Maximum ISTOF Values To investigate the impact of variations in arrival pattern types on the repeatability of maximum ISTOF values, Figure 105 depicts the histograms of maximum ISTOF values for 1000 runs on each of the test models tm7,…, tm11. The corresponding descriptive statistics are shown in Table 19. As we can see, there are no big differences among the five distributions. The histogram of maximum ISTOF values for tm8 is the only noticeable difference, in which the distribution is flatter than the four others (with more peaks and valleys). This is perhaps
248 due to the specific ATS properties of periodic arrival patterns (the arrival pattern type of SDs in tm8). Another observation is that the histograms in Figure 105-(a) and Figure 105-(c) are quite similar. Recall from Sections 10.2-10.3 that the ATS of a bounded arrival pattern covers the entire time domain except few time intervals close to zero. Therefore, if the common unconstrained time intervals of a set of bounded arrival patterns are considered, they resemble a set of SD with no arrival patterns. The effect of such a property, thus, shows itself in the two histograms. 400 400 400
400
400
300 300
300
300
.05
.10 .15
Probability
.05
.10 .15
Probability
300
.05 .10 .15 Probability
.05 .10 .15 .20 Probability
(a)- tm7 (all SDs with (b)- tm8 (all SDs with (c)- tm9 (all SDs with (d)- tm10 (all SDs with no arrival patterns)
.05 .10 .15 .20 Probability
(e)- tm11 (SDs with
periodic arrival
bounded arrival
irregular arrival
arbitrary arrival
patterns)
patterns)
patterns)
patterns)
Figure 105-Histograms of maximum ISTOF values for 1000 runs of each test model. The y-axis values are in traffic units.
249
Test Model
Min
Max
Average
Median
Standard Deviation
tm7 (all SDs with no arrival patterns)
240
448
305
304
27.7
tm8 (all SDs with periodic arrival patterns)
216
404
279
279
27.0
tm9 (all SDs with bounded arrival patterns)
232
448
306
304
28.8
tm10 (all SDs with irregular arrival patterns)
234
420
294
289
28.41
tm11 (SDs with arbitrary arrival patterns)
248
459
309
307
25.72
Table 19-Descriptive statistics of the maximum ISTOF values for each test model over 1000 runs. Values are in units of data traffic. 11.3.7.3 Impact on Repeatability of Maximum Stress Time Values To investigate the impact of variations in arrival pattern types on the repeatability of maximum stress time values, Figure 106 depicts the histograms of maximum stress time values for 1000 runs on each of test models tm7,…, tm11. The corresponding descriptive statistics are shown in Table 20. We attempt below to interpret the distributions shown in Figure 106.
Distributions (a) and (c) are skewed towards their minimum values. For example, the mode of (a) is around 70 units of traffic which is closer to 0 (the minimum) than 620 (the maximum). This can be explained based on the early start times of DTUPs in DCCFPs of the fittest GA individual generated for tm7 and tm9. Since the ATS of tm7 is unconstrained and the one for tm9 has only few constrained ATIs, the GA chooses the common start times of maximum stressing DCCFPs as early as possible.
250 600
600
200
600 500
600
500
500
500 400
400
400
400 300
300
300 200 200 100 100
300
100
200
200
100
100
0 .05.10
.20
Probability
(a)- tm7 (all SDs with no arrival patterns)
.02 .04 .06 .08
.05
Probability
(b)- tm8 (all SDs
.15
.25
Probability
(c)- tm9 (all SDs
.05 .10 .15 .20
.05 .10 .15
Probability
Probability
(d)- tm10 (all SDs
with periodic arrival with bounded arrival with irregular arrival patterns)
(e)- tm11 (SDs with arbitrary arrival patterns)
patterns)
patterns)
Figure 106-Histograms of maximum stress time values for 1000 runs of each test model. The y-axis values are in time units. Test Model
Min
Max
Average
Median
Standard Deviation
tm7 (all SDs with no arrival patterns)
12
622
140
119
105.7
tm8 (all SDs with periodic arrival patterns)
58
655
347
346
129.8
tm9 (all SDs with bounded arrival patterns)
33
618
137
118
105.0
tm10 (all SDs with irregular arrival patterns)
22
211
89
66
43.0
tm11 (SDs with arbitrary arrival patterns)
29
669
214
184
157.04
Table 20-Descriptive statistics of the maximum stress time values for each test model over 1000 runs. Values are in time units.
The distribution in (b), corresponding to tm8, is flatter than the others. This can be explained based on the specific ATS properties of periodic arrival patterns (the arrival pattern type of SDs in tm8). The intersection of several periodic ATSs will be a discrete unbounded ATS (refer to Figure 107 for an example). Therefore, given a TM with periodic SDs, the GA might converge to any of the common ATPs in the intersection of all periodic ATSs.
251
Another observation is that the histograms in (a) and (c) are quite similar. Recall from Sections 10.2 and 10.3 that the ATS of a bounded arrival pattern covers the entire time domain except few time intervals close to zero. Therefore, if the common unconstrained time intervals of a set of bounded arrival patterns are considered, they resemble a set of SD with no arrival patterns. Such similarity is visible in the two histograms. ...
ATS 2
...
ATS 3
...
Intersection
ATS 1
Intersection ATS
...
Figure 107- The intersection of several periodic ATSs is a discrete unbounded ATS. 11.3.7.4 Impact on Convergence Efficiency across Generations Regarding the impact of arrival patterns on convergence efficiency across generations in the GA, Figure 108 depicts the histograms of the generation numbers when a stable maximum fitness plateau is reached in 1000 runs of test models tm7,…, tm11. The corresponding descriptive statistics are shown in Table 21. It is interesting to see that, on average, 49-50 generations were required to converge to the final result (a stress test requirement) across all TMs: tm7,…, tm11. The standard deviations variations of the distributions are limited and no more 100 generations are required in all cases. Therefore, variations in arrival pattern types do not have a significant impact on convergence efficiency across generations, and the GA is
252 able to reach a stable maximum fitness plateau after about 50 generations on average, independent of any arrival pattern types. 90
100
100
90
90
80
80
70
70
70
60
60
60
60
50
50
50
50
40
40
30
30
20
20
90 80
40 30
(a)- tm 7 (all SDs with no arrival patterns)
(b)- tm 8 (all SDs
100
80
90
70
80 70 60 50 40
40
30 30
(c)- tm 9 (all SDs
20
(d)- tm 10 (all SDs (e)- tm 11 (SDs with
with periodic arrival with bounded arrival with irregular arrival patterns)
arbitrary arrival
patterns)
patterns)
patterns)
Figure 108- Histograms of the generation numbers when a stable maximum fitness plateau is reached in 1000 runs of each test model. Test Model
Min
Max
Average
Median
Standard Deviation
tm7 (all SDs with no arrival patterns)
30
90
50
48
9.97
tm8 (all SDs with periodic arrival patterns)
28
97
50
49
10.36
tm9 (all SDs with bounded arrival patterns)
30
98
50
49
10.86
tm10 (all SDs with irregular arrival patterns)
27
88
49
48
9.35
tm11 (SDs with arbitrary arrival patterns)
28
96
58
57
11.58
Table 21-Minimum, maximum and average values of the generation numbers when a stable maximum fitness plateau is reached in 1000 runs of each test model. 11.3.8 Impacts of Arrival Pattern Parameters The impact of variations in arrival pattern parameters were investigated by running GARUS on experimental test models in which all SDs were periodic (tm8, tm12, tm13, and tm14), bounded (tm9, tm15 and tm16, or irregular (tm10, tm17 and tm18) (Table 13). The combinations of TMs to investigate in this section were chosen to study the impacts
253 of arrival pattern parameters such the period and deviations values of a periodic AP, and minimum/maximum inter-arrival values of a bounded AP. The results are reported in the following four subsections.
Impact on Execution Time
Impact on Repeatability of Maximum ISTOF Values
Impact on Repeatability of Maximum Stress Time Values
Impact on Convergence Efficiency across Generations
11.3.8.1 Impact on Execution Time We computed the average, minimum and maximum execution times over all the 1000 runs, by running GARUS on test models tm8, tm9, tm10, tm12,…tm18 on an 863MHz Intel Pentium III processor with 512MB DRAM memory (Table 22). Minimums and maximums of the statistics in Table 22 for each test model run are relatively close to the corresponding average value. Therefore, we use the average values to discuss the impacts of variations in arrival patterns on execution time. Based on the execution values in Table 22, we can make the following observations:
The GA execution takes longer time for higher numbers of periodic ATIs in a specific maximum search time. The distribution mean and median values for execution times of tm12 (AP period value=5) and tm13 (AP period value=5) are higher than those of tm8 (AP period values from 5 to 10) and tm14 (AP period value from 20 to 25). This is explained by an implementation detail of GARUS. Function getARandomArrivalTime, a member function of class AP (Figure 88), is overridden in each of AP’s subclasses. The explanations can be made
254 similar to the discussions in Section 11.3.7.1. As the period value of an AP increases, the number of periodic ATIs in a specific maximum search time decreases. This, in turn, reduces the GA’s execution time.
Increasing the minimum inter-arrival time range (from [2,4] in tm9 to [50,60] in tm15) in bounded APs has increased the average (from 590 in tm9 to 667 in tm15) and median execution times (from 562 in tm9 to 657 in tm15). This is explained by formula k = ⎡minIAT ( maxIAT − minIAT )⎤ (proved in Appendix C), where k is the number of ATIs for a bounded AP. Due to the implementation detail in member function getARandomArrivalTime
of class AP (Section 11.3.7.1),
increasing the number of ATIs in a bounded AP will increase execution time. Note that the denominator value in the above formula is the same in both tm9 and tm15, by using the minAPboundedMaxIATafterMin parameter (Table 11), while the nominator value is changed.
Increasing the different between minimum and maximum inter-arrival time range (from [2,5] in tm9 to [60,70] in tm16) in bounded APs has decreased the average (from 667 in tm9to 503 in tm16) and median execution times (from 657 in tm9to 494 in tm16). This is explained again by the above formula and the implementation detail in member function getARandomArrivalTime of class AP (Section 11.3.7.1), whereas decreasing the number of ATIs in a bounded AP will decrease execution time. Note that the nominator value in the above formula is the same in both tm9 and tm16, while the denominator value is changed.
255 Test Model Group
Test Model
Min
Max
Average
Median
Standard Deviation
periodic
tm8
468
1,250
580
532
100.94
tm12
625
1,359
746
703
123.13
tm13
640
1,547
758
703
125.11
tm14
393
1,109
519
556
101.55
tm9
500
1,188
590
562
50.56
tm15
625
890
667
657
22.92
tm16
447
853
503
494
35.50
tm10
312
688
372
344
58.24
tm17
453
1235
582
531
97.77
tm18
500
984
557
532
64.4
bounded
irregular
Table 22-Execution time statistics of 1000 runs of tm8, tm9, tm10, tm12,…tm18. 11.3.8.2 Impact on Repeatability of Maximum ISTOF Values To investigate the impact of variations in arrival pattern parameters on the repeatability of maximum ISTOF values, Figure 109 depicts the histograms of maximum ISTOF values for 1000 runs on each of the test models tm8, tm9, tm10, tm12,…tm18. The corresponding descriptive statistics are shown in Table 23. We discuss three main observations based on the results shown in Figure 109.
Among TMs with all periodic APs (tm8, tm12, tm13, and tm14), tm13 has the highest maximum ISTOF value (500). This is because the APs in tm13 have both period and deviation values of 5, which means that the corresponding ATSs are virtually unconstrained, i.e., all time instants are accepted. This, in turn, lets the GA search the entire time domain and find the best possible
256 stress test schedule. The ATSs of other three TMs (tm8, tm12, and tm14) are constrained and do not include any time instant in the time domain. Test Model Group 500
400
400
400
400
300
periodic
300
300
300 .05
.10 .15
.05 .10 .15 .20
.10 .20 .30 .40
Probability
Probability
Probability
(a)-tm8
(c)- tm13
(b)- tm12
.05 .10.15.20 .25 Probability
(d)- tm14
400
400
bounded
400
300
300
300
.05.10 .15.20 .25
.05 .10 .15
.05 .10 .15 .20
Probability
Probability
Probability
(f)- tm15
(e)-tm9
(g)- tm16
500 400
500
400 400
irregular
300 300
.05 .10 .15 .20 Probability
(h)-tm10
300
.03
.08
.13
Probability
(i)- tm17
.05 .10 .15 .20 Probability
(j)- tm18
Figure 109-Histograms of maximum ISTOF values for 1000 runs of each test model. The y-axis values are in traffic units.
257
Increasing the number of arrival points (from [5,15] in tm10 to [50,100] in tm17) in irregular APs has increased the highest maximum ISTOF value (from 420 in tm10 to 490 in tm17). This is because as the number of arrival points increases, the number of possible stress test requirements increases, and so does the chances of finding a stress test requirement with the highest stress value.
Increasing the location of arrival points (from [1,30] in tm10 to [100,200] in tm18) in irregular APs does not have a significant impact on the distribution of maximum ISTOF values. This is because such a change will only shift (in time domain) the time instant when stress traffic will be entailed (maximum stress time).
Test Model Group
Test Model
periodic
tm8
216
tm12
bounded
irregular
Min
Max
Average
Median
Standard Deviation
404
279
279
27.0
273
476
323
317
26.65
tm13
287
500
331
323
27.8
tm14
240
435
298
296
25.21
tm9
232
448
306
304
28.8
tm15
249
507
306
297
22.29
tm16
260
449
317
310
28.34
tm10
234
420
294
289
28.41
tm17
268
490
348
345
33.58
tm18
262
556
329
330
35.01
Table 23-Descriptive statistics of the distributions in Figure 109.
258 11.3.8.3 Impact on Repeatability of Maximum Stress Time Values To investigate the impact of variations in arrival pattern types on the repeatability of maximum stress time values, Figure 110 depicts the histograms of maximum stress time values for 1000 runs on each of test models tm8, tm9, tm10, tm12,…tm18. The corresponding descriptive statistics are shown in Table 24. We discuss three main observations based on the results shown in Figure 110.
The difference between the mode and other values of the distribution (d) is slightly more than such a difference in distributions (a), (b) or (c). This can be explained as tm14, corresponding to the distribution (d), has relatively high period values ([20-25]) compared to the other three TMs. This, in turn, affects the GA by providing less chances of finding overlaps between different ATSs in a TM. Because of this, the number of such overlaps are maximized in fewer instants in the time domain in tm14 compared to the other three.
Among TMs with bounded AP, distributions (e) and (g) are skewed towards their minimum values, while the values in (f) are distributed almost evenly across the distribution’s range, i.e., the distribution is not skewed neither towards its minimum nor it maximum value. This can be explained by the different values of the Unbounded Range Starting Point (URSP), Section 10.7.4., in the bounded APs of the above three TMs. As shown in Appendix C, the URSP of a bounded AP can be calculated by: URSP = ⎡minIAT ( maxIAT − minIAT )⎤.minIAT . Therefore, the URSP value of tm15 is higher than those of tm9 and tm16, since the range of minIAT in tm15 is higher than those in tm9 and tm16, while the denominator of the above formula are in the same range. For example, considering a bounded AP in tm15 with minIAT=55
259 and maxIAT=58, the URSP will be 1045 units of time. This value is even higher than the maximum search time (500 units of time) set in all the above three TMs. Therefore, there will not be any unconstrained ATI in the ATSs of tm15, and thus the GA will not be able to do an unconstrained search for stress test requirements in time domain. Such a search is possible in tm9 and tm16 because their URSPs will be inside the specified maximum search time. For example, one example URSP for a SD AP in tm9 with minIAT=3 and maxIAT=5 is 6 units of time, which is < 500.
As discussed in the previous subsection, increasing the location of arrival points (from [1,30] in tm10 to [100,200] in tm18) in irregular APs does not have a significant impact on the distribution of maximum ISTOF values. However, as we can see by comparing distributions (h), (i) and (j), such an increase shifts (in time domain) the time instant when stress traffic will be entailed (maximum stress time). As we can see, both average and median values in distribution (j), corresponding to tm18, are higher than those in distribution (h), corresponding to tm10. Test Model Group
Test Model
periodic
tm8
58
655
347
346
129.8
tm12
18
613
332
337
131.54
tm13
49
664
334
334
131.15
tm14
41
631
333
337
125.3
tm9
33
618
137
118
105.0
tm15
72
657
366
362
139.32
tm16
26
615
151
115
109.11
tm10
22
211
89
66
43.0
tm17
14
235
67
59
32.54
tm18
136
372
239
242
40.39
bounded
irregular
Min
Max
Average
Median
Standard Deviation
Table 24-Descriptive statistics of the distributions in Figure 110.
260 Test Model Group 600
600
600
600 500 500
500
500
400
400
300
300
200
200
100
100
400 400 300
periodic
300 200 200 100 100 0 .02 .04 .06 .08
.01 .03 .05 .07
Probability
Probability
(a)-tm8
(b)- tm12
.01 .03 .05 .07
.02 .04 .06 .08
Probability
Probability
(c)- tm13
(d)- tm14
600
600 600
500
500
500
400
400
400
300
300
bounded
300
200
200
200
100
100
100
0
.05
.15
.03 .05 .08 .10
.25
.05 .10 .15 .20
Probability
Probability
Probability
(f)- tm15
(e)-tm9
(g)- tm16
200 200 300
irregular
100
100 200
.05 .10 .15 .20 Probability
(h)-tm10
.05.10
.20
Probability
(i)- tm17
.05 .10 .15 .20 Probability
(j)- tm18
Figure 110- Histograms of maximum stress time values for 1000 runs of each test model. The y-axis values are in time units
261 11.3.8.4 Impact on Convergence Efficiency across Generations Regarding the impact of arrival patterns on convergence efficiency across generations in the GA, Figure 111 depicts the histograms of the generation numbers when a stable maximum fitness plateau is reached in 1000 runs of test models tm8, tm9, tm10, tm12,…tm18. The corresponding descriptive statistics are shown in Table 25. On average, 49-59 generations were required to converge to the final result (a stress test requirement) across all TMs: tm8, tm9, tm10, tm12,…tm18. No more 100 generations are required in all cases. As we can see, variations in arrival pattern parameters has a slight impact on convergence efficiency across generations. We discuss such impacts individually for each of the three test model groups:
TMs with periodic APs (tm8, tm12, tm13, and tm14): The results for tm13 converge relatively faster than the other three (almost the same), as the minimum, average and medians denote. This can be explained as the APs in tm13 are periodic with both period and deviation values of 5. This AP resembles to a unconstrained ATS, in which all time instant are accepted. Therefore, the GA will have better chances to find “fit” individuals earlier. In the other three, more applications of the GA operators are required to converge the population.
TMs with bounded APs (tm9, tm15 and tm16): As the corresponding minimum, average and medians denote, the results for tm16 converge relatively faster than the other two (almost the same). This can be explained by the URSP formula for bounded APs ( URSP = ⎡minIAT ( maxIAT − minIAT )⎤.minIAT ). By calculating the range
262 of URSPs based on the given ranges of minIAT and maxIAT, tm16 has the lowest value of URSP among the above set of TMs with bounded APs (tm9, tm15 and tm16). By having a smaller value for URSP, our GA can search the time domain (up to maximum search time) to a greater extent, thus, yielding a faster convergence.
TMs with irregular APs (tm10, tm17 and tm18): As the corresponding minimum, average and medians denote, the results for tm17 converge relatively faster than the other two. This can be explained by the higher number of irregular arrival points in tm17, i.e., the range of [50,100] compared to [5,10] in tm10and tm18. By having a higher number of irregular arrival points, our GA can search the time domain (up to maximum search time) to a greater extent, thus, yielding a faster convergence. Test Model Group
Test Model
Periodic
tm8
42
tm12
Bounded
Irregular
Min
Max
Average
Median
Standard Deviation
99
57
56
10.45
41
99
58
57
10.94
tm13
28
97
50
49
10.81
tm14
43
99
58
57
11.70
tm9
39
97
58
57
11.0
tm15
40
99
58
57
10.86
tm16
30
98
50
49
10.48
tm10
44
99
59
58
11.27
tm17
27
88
49
48
9.35
tm18
36
96
59
57
11.09
Table 25-Descriptive statistics of the distributions in Figure 111.
263
Test Model Group 100 100 90
90
80
50
40
40
40
30
30
50 40 30
.05 .10 .15 .20 .25
Probability
(a)-tm8
60
20 .05 .10 .15 .20
Probability
70
50
50
.05 .10 .15 .20
80
60
60
30
Probability
(b)- tm12
(c)- tm13
100
.05 .10 .15 .20 Probability
(d)- tm14
100 100
90
90
90
80
80
80
70
70
70
60
bounded
90
70
70
60
periodic
100
90 80
80
70
100
60
60
50
50
50
40
40
40
30
30
30 .05 .10 .15 .20
20 .05 .10 .15 .20 .25
Probability
.05 .10 .15 .20
Probability
(e)-tm9
Probability
(g)- tm16
(f)- tm15 90
100
100 80
90
irregular
90
80
70
80
70
60
70
60
60
50
50
50
40 40
40 30
30 .05 .10 .15 .20 Probability
(h)-tm10
30 .05
.10
Probability
(i)- tm17
.15
.05 .10 .15 .20 .25 Probability
(j)- tm18
Figure 111- Histograms of the generation numbers when a stable maximum fitness plateau is reached in 1000 runs of each test model.
264 11.3.9 Impact of Maximum Search Time We report in this section the impact of variations in GA maximum search time on execution time, repeatability of outputs (maximum ISTOF and stress time values), and also maximum plateau generation numbers. Maximum search time is the range of the random numbers chosen from the ATS of a SD with arrival pattern (Section 10.7.4). We first compare GA results for TMs tm1, tm19 and tm20 in Figure 112. As described in Section 11.3.5.5, tm19 and tm20 have the same SUT components (SDs, DCCFPs, ISDSs, etc.) as tm1, but the GATimeSearchRange value for tm19 and tm20 are 5 and 150 time units, respectively, instead of 50 in tm1. Therefore, comparing GA results for tm1, tm19 and tm20 should reveal the impact of maximum search time on all variables of interest. The corresponding descriptive statistics are shown in Table 26. There are 12 graphs (3 rows in 4 columns) in Figure 112. Three rows correspond to different maximum search time, while columns relate to GA variables (execution time, maximum ISTOF values, maximum stress time values, and maximum plateau generation number). In terms of execution time, variations in maximum search time do not have an impact. Across 1000 runs, all three TMs (tm1, tm19 and tm20) show execution times in the range [45 ms, 130 ms]. Since a change in maximum search time only changes the range in which a random time from an ATS is selected, it is not surprising that there is no effect on the workload of different GA components.
265
Impact on Execution time
Maximum ISTOF values
130 80
70
100
(tm19)
80
10
110
Max Plateau Generation # 90
11
120
5
Maximum stress time values
9
90 70
80
60
8
50
70
40
7
60
30
50
6
60
20 .10.20
.40.50
.05.10.15
GA Maximum Search Time (time units)
Probability
130
.25
Probability
90 80
80
40
100
(tm1)
70
90
70
30
60
20
80 70
60 50 40
60 50
10
50 .10
.30
.50
.10 .20 .30 .40
30 .05 .10 .15 .20 .25
Probability
Probability
Probability
100 110
120
90
100
110
(tm20)
.05 .10 .15 .20
Probability
130
150
Probability
100 50
110
.05 .10 .15 .20 .25
Probability
90
120
50
.10 .20 .30 .40
80
100
90
90
80
80
70
50
70
60
40
60
70
100
60
50
50
30
40 .10 .30
.50
Probability
0 .10 .20 .30 .40 Probability
20 .10
.30
.50
Probability
.05 .10 .15 .20 Probability
Figure 112- Impact of variations in maximum search time on the GA’s behavior and outputs.
266 As the maximum search time increases across the three test models (5 in tm19 to 50 in tm1 and 150 in tm20), the maximum of maximum ISTOF values across 1000 runs of a TM increases, i.e. 82 traffic units for tm19, 91 traffic units for tm1 and 110 traffic units for tm20. This can be explained by an increase in the size of GA’s time search range (in ATSs) from tm19 to tm1 and tm20. From another perspective, the difference between the maximum and minimum of maximum ISTOF values also increases with the maximum search time. The differences between the maximum and minimum of maximum ISTOF values for tm19, tm1 and tm20 are 20 (82-62), 41 (91-50), and 69 (110-41) respectively. This can also be explained by the increase in the size of GA’s time search range (in ATSs) from tm19 to tm1 and tm20. In terms of maximum stress time values, similar patterns to maximum ISTOF values can be observed among the three distributions in column ‘maximum stress time values’ of Figure 112. In terms of maximum plateau generation number, we can see that the increase in maximum search time slightly delays convergence across generations, i.e., the maximum plateau generation number in tm19 runs is reached at 91, while it is 100 for both tm1 and tm20 runs.
267
Distribution Group
Test Model
Execution time
tm1
46
tm19
Maximum ISTOF values
Maximum stress time values
Max Plateau Generation #
Min
Max
Average
Median
Standard Deviation
125
58
62
11.34
46
125
65
62
16.86
tm20
46
125
69
63
17.50
tm1
65
112
81
81
7.0
tm19
60
82
73
72
4.67
tm20
42
112
61
62
6.79
tm1
6
56
22
20
12
tm19
6
11
8
9
1.54
tm20
9
156
31
13
37.56
tm1
27
98
49
47
10.78
tm19
26
94
48
46
10.52
tm20
27
99
48
47
10.69
Table 26-Descriptive statistics of the distributions in Figure 112.
268
Chapter 12
CASE STUDY
A comprehensive case study is presented in this chapter. An overview of the types of targeted systems by our stress test technique is provided in Section 12.1. Section 12.2 discusses the requirements for a suitable case study. As discussed in Section 12.2, none of the systems in our survey meets the requirements. Therefore, we developed a prototype system introduced in Section 12.3, based on actual specifications. The system is referred to as SCAPS (A SCADA-based Power System). The UML design model of SCAPS is also given in Section 12.3. Section 12.4 presents the stress test architecture used in our case study. Some descriptions of the stress test execution environment are given in Section 12.5. Using the UML design model of SCAPS, the building process of a corresponding stress test model (required by our test technique) is described in Section 12.6. Stress testing SCAPS by time-shifting stress test technique is described Section 12.7. In each of the last two sections, stress test results are also reported, which are used to assess the effectiveness of our stress test techniques at triggering network trafficrelated failures. Stress Testing SCAPS by Genetic Algorithm-based stress test technique is presented Section 12.8.
269 12.1 An Overview of Target Systems Our stress test technique can be used to stress test systems which are distributed, hard real-time, and safety-critical. We present a brief introduction here on two important groups of such systems. 1. Distributed Control Systems (DCS) 2. Supervisory Control and Data Acquisition (SCADA) Systems Although some systems can fall in both categories, it is more convenient to discuss them separately. A Distributed Control Systems (DCS) [4] is a computer-based control system where sections of a plant have their own processors, linked together to provide both information dissemination and manufacturing coordination. A DCS system is used in industrial and civil engineering applications to monitor and control distributed equipment with remote human intervention. A DCS system is generally, since the 1990s, digital, and normally consist of field instruments, connected via wiring to computer buses or electrical buses to multiplexer/demultiplexers, analog to digital converters, and Human-Machine Interface or control consoles. A DCS is a very broad umbrella that describes solutions across a large variety of industries, including: Electrical power distribution grids and generation plants; Environmental control systems; Traffic signals; Water management systems; Refining and chemical plants. SCADA stands for Supervisory Control And Data Acquisition. As the name indicates, SCADA systems are not full control systems (like DCS), but they rather focus on supervisory aspects of a system. As such, it is a software package that is executed on top
270 of hardware to which it is interfaced, in general via Programmable Logic Controllers (PLCs), or other commercial hardware modules [102]. SCADA systems interact with their controlled environment via input/output (I/O) channels. SCADA systems are used not only in industrial processes, e.g., steel making [5], power generation (conventional and nuclear) and distribution [103-107], chemistry and oil [108], but also in facilities such as nuclear fusion [109, 110]. The size of such plants ranges from a few to several thousands I/O channels. SCADA systems evolve rapidly and are now penetrating the market of plants with a number of I/O channels of several 100 K. SCADA and DCS are related but they are different in important ways. A DCS is processoriented as it focuses on the control process (such as a chemical plant), and presents data to operators. On the other hand, a SCADA system is data-gathering oriented, where the control centre and operators are the main focus points. The remote equipment is merely there to collect the data--though it may also do some very complex control process. A DCS operator station is normally intimately connected with its I/O (through local wiring, field bus, networks, etc.). When the DCS operator wants to see information he usually makes a request directly to the field I/O and gets a response. Field events can directly interrupt the system and advise the operator. A SCADA system must operate reasonably when field communications fail. The quality of the data shown to the operator is an important facet of a SCADA system operation. SCADA systems often provide special event processing mechanisms to handle conditions that occur between data acquisition periods. A typical architecture of SCADA systems is shown in Figure 113.
271
` Client
` Client
Dedicated Server
Ethernet
...
Data Server
Controller
Controller
Data Server
Controller
Controller
Controller
Figure 113-A typical architecture of SCADA systems. 12.2 Choosing a Target System as Case Study There are various distributed, real-time prototype systems in academia (e.g. [111], [112], [104]) and also real systems in industry (e.g. [113], [114], [115], [116]), which are currently in use. 12.2.1 Requirements for a Suitable Case Study We group the requirements for a suitable case study into two groups: (1) system’s functional features and behaviors, and (2) modeling technique. A suitable case study should have the following functional features and behaviors: •
Requirement 1: It should be distributed, hard real-time, and preferably safetycritical, in which deadline misses can lead to catastrophic results, as our stress test technique tries to force the system to exhibit distributed traffic faults which will, in turn, lead to (hard) real-time faults.
272 •
Requirement 2: The system should be preferably data-intensive, i.e., a distributed system in which most (or at least some) of the messages exchanged among distributed nodes have large data sizes. Again, our stress test technique tries to find the most data intensive distributed messages and produces schedules so that such messages run concurrently.
•
Requirement 3: It should be possible to run the system on a typical hardware/software platform in a research institute. We can replace the embedded components and special hardware with test stubs or component simulators, if necessary.
Since our stress test technique needs a SUT’s design model, a suitable case study should also meet the following requirements in terms of modeling technique: •
Requirement 4: The design model or source code of the system should be available. The design model can be built by reverse engineering the source code. However reverse engineering of UML models of a system from its source code is usually costly for large systems.
•
Requirement 5: The design model should be in UML 2.0, since our test technique needs it to be so. Since UML 2.0 has enhanced compared to its previous versions, models based on UML 1.x are also suitable.
12.2.2 None of the Systems in our survey Meets the Requirements None of the existing systems we are aware of meets all of the above requirements. We provide a brief, structured summary below:
273 •
Requirement 1: Not all distributed systems we surveyed are hard RT and safety-critical. For example QADPZ (Quite Advanced Distributed Parallel Zystem) [111] is a distributed system, but does not have safety-critical constraints.
•
Requirement 2: None of the systems we surveyed which meets other requirements also meets this one, such as the RT distributed factory automation system [112] which was RT, but not data intensive.
•
Requirement 3: Most systems need special software/hardware platforms to run on, which can not easily be deployed and executed in an academic setting, like ours. We are even flexible in replacing the embedded components and special hardware with test stubs or component simulators, if possible. However, doing this for a complex system is not easy, for example COACH (Component Based Open Source Architecture for Distributed Telecom Applications) [113] seemed to satisfy the other requirements, but it did not have a well-document design. Considering the huge size of the system (in the order of million lines of code), we estimated that we can not have a good understanding of the system architecture and carefully find the dependant components of each component and embed test stubs for specific hardware components that we did not have and were required to run the system.
•
Requirement 4: The systems model/source code are not freely available or even not available at all. This is either due to the fact that this information is sensitive and/or classified, such as for JITC (The Joint Interoperability Test Command)
274 [114] and [104], or to the fact that the systems are very expensive, such as CitectSCADA [115] and ElipseSCADA [116]. •
Requirement 5: As a corollary of our discussion on requirement 4, no UML 2.0 model of the systems in our selection pool was available.
12.3 Our Prototype System: A SCADA-based Power System Because none of the systems we surveyed meets the requirements, we decided to analyze, design, and build our own prototype system by using the ideas and concepts from existing distributed system technologies. The Specifications of our SCAda-based Power System (SCAPS) is described in Section 12.3.1. In Section 12.3.2, we discuss how and why SCAPS meets our case study requirements. We present the SCAPS’ UML design model in Section 12.3.3. Our stress test objective is presented in Section 12.3.4. Relevant implementation issues are presented in Section 12.3.5. Section 12.3.6 provides a brief description of SCAPS’ hardware and configuration. 12.3.1 SCAPS Specifications We intend to design a SCADA power system which controls the power distribution grid across a nation consisting of several provinces. Each province has several cities and regions. Each city and region has several local power distribution grids. There is one central server in each province which gathers the SCADA data from Tele-Control units (TCs) from all over the province, installed in local grids, and perform the following realtime data-intensive safety-critical functions as part of the Power Application Software installed on the SCAPS servers:
275 •
Overload monitoring and control (OM and OC): Using the data received from local TCs, each provincial server identifies the overload conditions on a local grid and cooperates with other provinces’ servers to reduce the load on overloaded local grids. If the grid stays overloaded for several seconds and the load does not get decreased, a system malfunction is to occur, such as hardware damage and regional black-out. Due to the safety-critical nature of the system, overload monitoring and overload control should be performed in less than 1,300 and 1,000 ms, respectively. Note that these values are in the range of real deadline values for the OM and OC operations in operational SCADA-based power systems [103107].
•
Detection of separated power system: Any separated (disconnected) grid should be identified immediately by the central server, and proper precautions should be made to balance the regional/provincial/national load due to this black-out so that the rest of the system stays stable. Due to the safety-critical nature of the system, detection of separated power system should be performed in less than 1,300 ms.
•
Power restoration after network failure: This functionality provides emergency strategies to prevent network disruption just after a network fault and later presents strategies and switching operation of breakers and disconnectors to restore power while keeping network’s reliability. Due to the safety-critical nature of the system, this functionality should be performed in less than 1,000 ms.
It should be noted that we only focus on the real-time data-intensive safety-critical functions of the SCAPS here. Therefore, our stress test technique will be more effective in revealing faults if it is applied to such functions (use-cases) of a SUT. The above three
276 functions are typical functions performed by SCADA power systems [104, 117], and will be shown in a use case diagram (Section 12.3.3.1), where we present the partial UML model of SCAPS. Some of the non real-time, non safety-critical functions of these systems, which we do not consider in our system, are [104, 117]: •
State estimation: Estimates most likely numerical data set to represent current network
•
Load forecasting: Anticipates hourly total loads (24 points) for 1-7 days ahead based on the weather forecast, type of day, etc. utilizing historical data about weather and load.
•
Power flow control: Supports operators activities by providing effective power flow control by evaluating network reliability for each several-minute time period for the next several hours, considering anticipated total load, network configuration, load flow, and contingencies.
•
Economical load dispatching: Controls generator outputs economically according to demand considering the dynamic characteristics of boiler controller of thermal power generators while keeping ability to respond quickly to sudden load changes.
•
Unit commitment of generator: A suitable schedule for starting/stopping the generators for the next 1-7 days is made using dynamic programming.
12.3.2 SCAPS Meets the Case-Study Requirements To justify our decision, we discuss below how SCAPS meets all the requirements in Section 12.2.1:
277 •
Requirement 1: SCAPS is distributed, hard real-time, and safety-critical, as discussed in Section 12.2.1.
•
Requirement 2: TCs send large amounts of information about the status and load of each component in their distribution grid to the provincial servers. SCAPS is therefore data-intensive.
•
Requirement 3: We design and build a SCAPS prototype, using the architecture of existing similar systems. We had, however, to account for the limitation of our research center’s hardware/software platforms when designing and implementing the system in such a way to preserve the realism of our case study. For example, we did not have access to dedicated power distribution hardware such as load meters and sensors and we used stubs to emulate their behavior.
•
Requirement 4: We develop the SCAPS UML model and source code, hence ensuring we have a complete set of development artifacts.
•
Requirement 5: Our SCAPS models make use of UML 2.0.
12.3.3 SCAPS UML Design Model Consistent with the SCAPS specification in Section 12.3.1, its partial UML model is provided below. What we mean by a partial model is one which mostly includes the model elements required by our stress test approach, as discussed in Chapter 5. The UML model, presented in this section, consists of the following artifacts: •
Use-Case diagram: Although this diagram is not needed by our testing technique, we present it to provide the reader with a better understanding on the overall functionality of the system.
•
Network deployment diagram
278 •
Class diagram
•
Sequence diagrams
•
Modified Interaction Overview Diagram (MIOD)
12.3.3.1 Use-Case Diagram We design SCAPS to be used in Canada. To simplify the design and implementation, we consider only two Canadian provinces in the system, Ontario (ON) and Quebec (QC). For example, OM_ON stands for overload monitoring for the province of Ontario; and DSPS_QC stands for Detection of Separated Power System (DSPS) for the province of Quebec. The use-case diagram is shown in Figure 114. A timer actor triggers Overload Monitoring (OM) and Detection of Separated Power System (DSPS) use-cases according to specified arrival patterns. Real-time data-intensive safety-critical
Overload Monitoring (OM) * «extends»
«includes»
OM_ON
«includes» OM_QC
«includes»
Overload Control (OC)
* *
«includes»
ASA (Automatic System Agent)
DSPS_ON
«includes» «extends»
«includes»
Gathering data from local TCs * *
Detection of Separated Power System (DSPS)
*
«includes»
«includes»
TCs (TeleControl units)
DSPS_QC
Power Restoration after Network Failure (PRNF) *
*
Timer
Figure 114- Modified SCAPS Use-Case Diagram including a Timer actor.
279 12.3.3.2 Network Deployment Diagram The Network Deployment Diagram (NDD) of SCAPS is shown in Figure 115. «network» Canada
SEV_CA1
SEV_CA2
«network» Ontario
«network» Quebec
«network» Ottawa
«network» Toronto
«network» Montreal
«network» Quebec City
TC_YOW1
TC_YYZ1
TC_YMX1
TC_YQB1
TC_YOW2
TC_YYZ2
TC_YMX2
TC_YQB2
TC_YOW3 SEV_ON
SEV_QC
Figure 115- SCAPS network deployment diagram. The networks for the provinces of Ontario and Quebec are shown in the NDD. Only two cities are considered in each of these two provinces. Three TCs (Tele-Control units) are considered for the city of Ottawa, while other cities have two TCs. There is one server (SEV_ON and SEV_QC) in each of the provinces. There are two servers at the national level: SEV_CA1 is the main server. SEV_CA2 is the backup server, i.e., it starts to operate whenever the main server fails. 12.3.3.3 Class Diagram Part of the SCAPS class diagram which is required to illustrate the case study is shown in Figure 116. The classes are grouped in two groups: entity and control classes [49, 118]. Entity classes are those which are used either as parameters (by inheriting from SetFuncParameter) or return values (by inheriting from QueryFuncResult) of methods of
280 control classes. Control classes are those from which active control objects will be instantiated and are the participating objects in SDs. All entity classes are data-intensive, since grid and load data of power systems for each region (or city) usually contain huge amounts of data [106, 119]. Entity Classes
Data-Intensive
SetFuncParameter
GridData
GridStructure
QueryFuncResult
GridStatus *
Control Classes
*
-End2
LoadStatus
gridStatus -End1
*
LoadData
*
LoadPolicy
loadStatus -End1
-End2
TC
ProvController
+query(in dataType, out output:QueryFuncResult) +setNewLoadPolicy(in policy:LoadPolicy) +setNewGridStructure(in gs:GridStructure)
+queryONData(in dataType, out output:QueryFuncResult) +queryQCData(in dataType, out output:QueryFuncResult)
ASA +analyzeOverload(in load:LoadStatus) +balanceLoadON(in loadON:LoadStatus, in loadQC:LoadStatus) +balanceLoadQC(in loadON:LoadStatus, in loadQC:LoadStatus) +buildNewGridStructureON(in gsON:GridStatus, in gsQC:GridStatus, out gs:GridStructure) +buildNewGridStructureQC(in gsON:GridStatus, in gsQC:GridStatus, out gs:GridStructure)
Figure 116-SCAPS partial class diagram. Furthermore, since there are two main groups of use-cases (overload and separated grid handlers), we group entity classes by two abstract classes GridData and LoadData. LoadStatus and GridStatus are the results of function query in class TC and queryONData and queryQCData in class ProvController. LoadPolicy and GridStructure are the parameters of set functions setNewLoadPolicy and setNewGridStructure in class
281 TC, respectively. For brevity, usage dependencies among classes have not been shown in the class diagram, e.g. from ProvController to QueryFuncResult. Tele-Control (TC) unit objects will be instantiated from class TC. Objects of class ProvController and ASA will be deployed on provincial (SEV_ON and SEV_QC) and national servers (the main server SEV_CA1 and the backup SEV_CA2), respectively. 12.3.3.4 Sequence Diagrams To render the effort involved in our case study manageable, we simplified the design model and implementation of SCAPS by only accounting for a subset of use cases and by implementing stubs simulating some of the functionalities of the system. In doing so, we tried to emulate as closely as possible the behavior of real SCADA-based power systems. More precisely, we designed the SDs in ways that the simplifications did not impact the types of faults (e.g., RT faults) targeted by our stress test technique. We incorporated enough messages and alternatives in SDs to allow the generation of non-trivial stress test requirements. Since we designed SCAPS as a hard RT system, we therefore modeled the RT constraint using the UML SPT profile [12]. Eight SDs are presented in Figure 117-Figure 122. They correspond to use-cases in the SCAPS use-case diagram (Figure 114). SDs OM_ON and OM_QC in Figure 117 correspond to the overload monitoring use case. For example, an object of type ASA (Automatic System Agent) sends a message to an object of type ProvController (provincial controller) in SD OM_ON to query Ontario’s load data. The result is returned and is stored in ASAloadON. The object of type ASA then analyzes the overload situation by analyzing the ASAloadON.
282 {RTArrivalPattern=" 'periodic', (2400, 'ms'), (100, 'ms')" RTduration < (5, 'ms')}
{RTArrivalPattern=" 'periodic', (2100, 'ms'), (100, 'ms')" RTduration < (5, 'ms')}
sd OM_ON
sd OM_QC
:ASA {node = SEV_CA1}
:ProvController {node = SEV_ON}
triggerOM_ON
triggerOM_QC
queryONData(“load”)
queryQCData(“load”)
ref queryONData(“load”)
{RTstart=(0,'ms') RTend=(100,'ms')}
:ProvController {node = SEV_QC}
:ASA {node = SEV_CA1}
:ASA.loadON analyzeOverload(:ASA.loadON)
{RTstart=(500,'ms') RTend=(1200,'ms')}
{RTstart=(1200,'ms') RTend=(1300,'ms')}
{RTstart=(0,'ms') RTend=(100,'ms')}
{RTstart=(300,'ms') RTend=(900,'ms')}
{RTstart=(900,'ms') RTend=(1000,'ms')}
(a)
ref queryQCData(“load”)
:ASA.loadQC analyzeOverload(:ASA.loadQC)
(b)
Figure 117- SDs OM_ON and OM_QC (Overload Monitoring). To find out how the timing information of the SDs in this section have been devised, refer to Section 12.3.3.5. The
two
SDs
in
Figure
118
(queryONData(dataType))
and
Figure
119
(queryQCData(dataType)) are utility SDs which are used by the other SDs using the InteractionOccurrence construct. As it was shown in the Network Deployment Diagram (NDD) of SCAPS (Figure 115), five TCs (Tele-Control units) were considered for the province of Ontario. Therefore, there is a parallel construct made up of five interactions in the SD of Figure 118 which queries the load data from each of the five TCs. Reply messages in queryONData(dataType) and queryQCData(dataType) have been labeled based on the name of the sender object. For example, the reply message YOW1 is a reply to the load query from the TC deployed on the node YOW1 (one of the TCs in the city of Ottawa). The entire load data of each province is finally returned by an object of type ProvController to the caller.
283 sd queryONData(dataType)
:ProvController {node = SEV_ON}
:TC {node = TC_YOW1}
:TC {node = TC_YOW2}
:TC {node = TC_YOW3}
:TC {node = TC_YYZ1}
:TC {node = TC_YYZ2}
queryONData(dataType) {RTstart=(0,'ms') RTend=(50,'ms')}
{RTstart=(50,'ms') RTend=(250,'ms')}
par
{RTstart=(0,'ms') RTend=(50,'ms')}
query(dataType) {RTstart=(50,'ms') RTend=(400,'ms')}
YOW1 query(dataType)
{RTstart=(50,'ms') RTend=(280,'ms')}
YOW2 query(dataType) {RTstart=(0,'ms') RTend=(50,'ms')}
YOW3
{RTstart=(50,'ms') RTend=(150,'ms')}
query(dataType) YYZ1
{RTstart=(0,'ms') RTend=(50,'ms')}
{RTstart=(50,'ms') RTend=(200,'ms')} query(dataType) YYZ2
{RTstart=(0,'ms') RTend=(50,'ms')}
Figure 118-SD queryONData(dataType). sd queryQCData(dataType)
:ProvController {node = SEV_QC}
:TC {node = TC_YMX1}
queryQCData(dataType) {RTstart=(0,'ms') RTend=(100,'ms')}
{RTstart=(0,'ms') RTend=(100,'ms')}
:TC {node = TC_YMX2}
{RTstart=(100,'ms') RTend=(300,'ms')}
:TC {node = TC_YQB1}
{RTstart=(100,'ms') RTend=(200,'ms')}
par query(dataType)
{RTstart=(100,'ms') RTend=(200,'ms')}
YMX1 query(dataType)
{RTstart=(100,'ms') RTend=(200,'ms')}
YMX2 query(dataType) {RTstart=(0,'ms') RTend=(100,'ms')} {RTstart=(0,'ms') RTend=(100,'ms')}
:TC {node = TC_YQB2}
YQB1
query(dataType) YQB2
Figure 119-SD queryQCData(dataType). OC (Overload Control) SD (Figure 120) checks if there is an overload situation in any of the two provinces (using overloadIn() as a condition). If this is the case in any of the two provinces, a new power distribution load policy is generated by an object of type ASA and it is sent to the respective provincial controller (using setNewLoadPolicy()). Similar to the OM_ON and OM_QC SDs, DSPS_ON and DSPS_QC SDs (Figure 121) fetch grid connectivity data from the provincial controllers and check whether there is any separated power system (using detectSeparatedPS()).
284 Similar to the OC SD (Figure 120), PRNF (Power Restoration after Network Failure) SD (Figure 122) checks if there is any separated power system in any of the two provinces (using anySeparationIn() as a condition). If this is the case in any of the two provinces, a new power grid structure is generated by an object of type ASA and it is sent to the respective provincial controller (setNewGridStructure()). We assign to SCAPS SDs realistic arrival pattern constraints. A realistic periodic arrival pattern value must be larger than the execution duration of the SD it is assigned to. This is because an invocation of the SD should complete execution before it is re-executed (due to a new event according to its arrival pattern). For example, recall from Section 12.3.3.4 that SD OM_ON’s duration is 1300 ms. We assume a periodic arrival pattern value of, say, 2400 ms for it. Similarly, since the durations of DSPS_ON and DSPS_QC are 1300 and 1100 ms, periodic arrival patterns with period and deviation values of 1700, 200 ms, and 1400, 200 ms are assigned to them, respectively. To account for time delays in real-world, a deviation of 100 ms is considered for this periodic arrival pattern. Since SCAPS is a reactive system, we assign periodic arrival pattern to its SDs. Reactive systems usually check for environment changes periodically and take appropriate actions.
285 sd OC
:ProvController {node = SEV_ON}
:ASA {node = SEV_CA1}
:ProvController {node = SEV_QC}
par alt
{RTstart=(0,'ms') RTend=(300,'ms')}
[overloadIn(:ASA:loadON)]
newLoadON=balanceLoadON(:ASA.loadON, :ASA.loadQC) {RTstart=(300,'ms') RTend=(1000,'ms')}
setNewLoadPolicy(newLoadON) [else] keepOldLoadPolicy()
{RTstart=(0,'ms') RTend=(50,'ms')}
alt
{RTstart=(0,'ms') RTend=(200,'ms')}
[overloadIn(:ASA:loadQC)]
newLoadQC=balanceLoadQC(:ASA.loadON, :ASA.loadQC) {RTstart=(200,'ms') RTend=(800,'ms')}
setNewLoadPolicy(newLoadQC)
[else] keepOldLoadPolicy()
{RTstart=(0,'ms') RTend=(50,'ms')}
Figure 120- SD OC (Overload Control). {RTArrivalPattern=" 'periodic', (1700, 'ms'), (200, 'ms')" RTduration < (5, 'ms')}
{RTArrivalPattern=" 'periodic', (1400, 'ms'), (200, 'ms')" RTduration < (5, 'ms')}
sd DSPS_ON
sd DSPS_QC :ProvController {node = SEV_ON}
:ASA {node = SEV_CA1} triggerDSPS_ON
:ProvController {node = SEV_QC}
:ASA {node = SEV_CA1} triggerDSPS_QC
queryONData(“connectivity”)
queryQCData(“connectivity”) ref
{RTstart=(0,'ms') RTend=(100,'ms')}
queryONData(“connectivity”) :ASA.connectivityON
{RTstart=(600,'ms') RTend=(1100,'ms')}
{RTstart=(1100,'ms') RTend=(1300,'ms')}
detectSeparatedPS(:ASA.connectivityON)
(c)
{RTstart=(0,'ms') RTend=(100,'ms')}
ref queryQCData(“connectivity”)
:ASA.connectivityQC
{RTstart=(500,'ms') RTend=(900,'ms')}
{RTstart=(900,'ms') RTend=(1100,'ms')}
detectSeparatedPS(:ASA.connectivityQC)
(d)
Figure 121-SD DSPS_ON and DSPS_QC (Detection of Separated Power System).
286 sd PRNF :ProvController {node = SEV_ON}
:ASA {node = SEV_CA1}
:ProvController {node = SEV_QC}
par {RTstart=(0,'ms') RTend=(300,'ms')}
{RTstart=(300,'ms') RTend=(1000,'ms')}
alt
[anySeparationIn(:ASA:connectivityON)]
newGSON=buildNewGridStructureON(:ASA.connectivityON, :ASA.connectivityQC) setNewGridStructure(newGSON)
{RTstart=(0,'ms') RTend=(50,'ms')}
{RTstart=(0,'ms') RTend=(400,'ms')}
{RTstart=(400,'ms') RTend=(1000,'ms')}
[else] keepOldGridStructure()
alt
[anySeparationIn(:ASA:connectivityQC)]
newGSQC=buildNewGridStructureQC(:ASA.connectivityON, :ASA.connectivityQC) setNewGridStructure(newGSQC)
{RTstart=(0,'ms') RTend=(50,'ms')} [else] keepOldGridStructure()
Figure 122-SD PRNF (Power Restoration after Network Failure). 12.3.3.5 Timing Information of Messages Recall from Section 5.1.1.1 that three of the approaches used in the literature to estimate timing information of messages in DRTSs are: (1) Static analysis and manual estimations (such as [55]), (2) Runtime monitoring (such as [56]), and (3) Benchmarks (such as [49]). In a real development environment, one of those techniques will necessarily be used. Since our case study did not take place in a real development environment, the timing information of the SDs in the previous section was derived according to a specific procedure (a type of runtime monitoring) that is described next. Once a running system was developed, the code was instrumented to log message durations. Such a runtime monitoring technique was used to get a statistical overview of the time length of
287 messages at runtime prior to the testing phase. Statistical distributions of start and end times of messages were derived by running the system and were used to set the message timing information as specified in the SDs in the previous section. One important objective in our data collecton process was to reduce the probe effects (due to monitoring) as much as possible. We followed ideas from [1] to do so, e.g., having simple, short log statements. Our measurements of the durations of those log statements confirmed that their execution durations were negligible compared to the durations of the measured messages, thus providing a minimal probe effect. Furthermore, since we were using dedicated PC/OS configurations for our measurements (i.e., no other major application was running on the machines), negligible side effects from the OS and other applications affected our process. Refer to Sections 12.3.5 and 12.3.6 for further details on SCAPS implementation details and runtime configurations. Furthermore, to simplify the scheduling calculations in Sections 12.7 and 12.8, message durations were rounded to the closest 100 ms, e.g., 86 ms for message queryONData() was rounded to 100 ms. One other objective in estimating timing information was to obtain realistic values. We considered two aspects: (1) system executions must be based on an operational profile, and (2) real-time constraints from real SCADA systems should be accounted for. SCAPS was executed according to an operational profile (Section 12.8.2.1), which will also be used as a baseline for the comparison of our test results. Furthermore, recall from Section 12.3.1 that, due to the safety-critial nature of the system, overload monitoring and overload control was specified to be performed in less than 1,300 and 1,000 ms, respectively. Note that these deadlines are realistic ranges according to the SCADA literature [103-107]. To have values in realistic ranges, the following control procedure
288 was followed. Since the system used as a case study was a prototype developed for the specific purpose of our analysis, the design variables (e.g,, the data size of message parameters transmitted over the network) were controlled in a way that the summation of average message durations (derived from the above runtime monitoring technique) be within the real-time deadline for SDs with real-time constraints. Such a control was done in part by manipulating data sizes of function parameters and return values, e.g., parameter ASALoadON in Figure 117. For example, if a certain setting for data sizes of function parameters led to a deadline miss at runtime, the data size of the function parameter(s) leading to the deadline miss were reduced. Thus, we made sure that the no deadline misses occured in the system execution based on the operational profile, e.g., the total duration of messages in SD OM was within 1,300 ms. In other words, having set a SD execution deadline, we derived its message durations by controlling system parameters (design variables). Refactoring was performed to repeatedly change system design parameters after runtime monitoring to make sure that all specified real-time constraints were met. In the context of real system modeling and testing, the above time estimation procedure will typically be done in the reverse order: after estimating message durations with a certain degree of uncertainty, a conservative SD execution deadline may be set and documented in the system specification. If such a deadline does not satisfy the business logic of a system (i.e., a long conservative duration for a short critical deadline), the relevant system resources (e.g., network bandwidth) have to be increased to satisfy realtime constraints. To study the impacts of uncertainty in estimating timing information,
289 one would need need to perform sensitivity analysis on our stress test generation technique (Section 10.9). 12.3.3.6 Modified Interaction Overview Diagram The MIOD of SCAPS is shown in Figure 123. The four dashed edges in Figure 123 are due to the system’s reactive nature and indicate that the system will continue repeating the two main functionality (overload monitoring and detection of separated power systems) until it is stopped. Thus, those four edges will not be analyzed when deriving the Independent-SD Sets (ISDSs) of SCAPS in Section 12.6.4. As denoted in the SCADA-based power systems literature (e.g. [103-105, 107, 120]), such systems have both soft and hard RT constraints. As discussed in Section 5.6, RT constraints can be either specified at the SD level (on messages execution times) or at the MIOD level (on SDs execution times). MIOD-level RT constraints are dependent on SDlevel constraints, since a SD’s actual execution time is the sum of the messages execution times in one of its CCFPs, which executes in a particular run.
290
[system shutdown]
[system shutdown] OM_STARTUP SRTC1 «SRTaction» {duration